
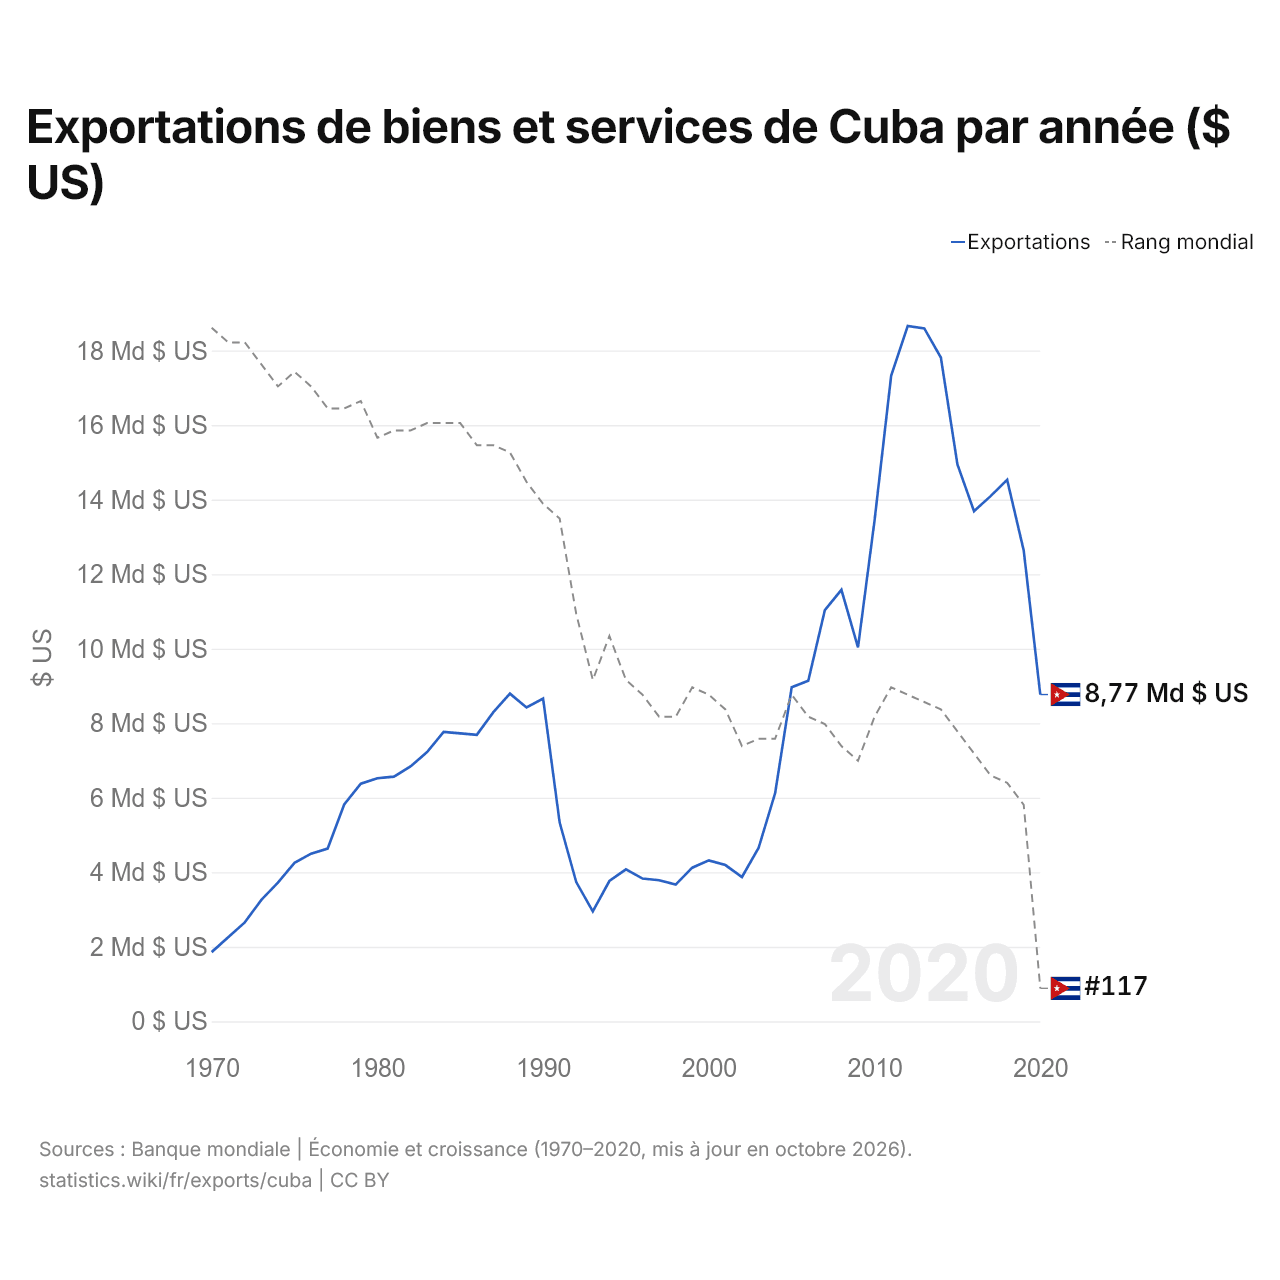
Exportations de biens et services de Cuba par année ($ US)
| Année | $ US | Rang mondial |
|---|---|---|
| Exportations | Rang mondial | |
| 2020 | 8 769 000 000 $ US | #117 |
| 2019 | 12 632 000 000 $ US | #92 |
| 2018 | 14 530 000 000 $ US | #89 |
| 2017 | 14 093 000 000 $ US | #88 |
| 2016 | 13 689 600 000 $ US | #85 |
| 2015 | 14 941 000 000 $ US | #82 |
| 2014 | 17 812 000 000 $ US | #79 |
| 2013 | 18 593 000 000 $ US | #78 |
| 2012 | 18 659 000 000 $ US | #77 |
| 2011 | 17 319 000 000 $ US | #76 |
| 2010 | 13 443 518 519 $ US | #80 |
| 2009 | 10 036 111 111 $ US | #86 |
| 2008 | 11 580 000 000 $ US | #84 |
| 2007 | 11 035 092 593 $ US | #81 |
| 2006 | 9 138 888 889 $ US | #80 |
| 2005 | 8 962 900 000 $ US | #77 |
| 2004 | 6 120 800 000 $ US | #83 |
| 2003 | 4 649 900 000 $ US | #83 |
| 2002 | 3 872 000 000 $ US | #84 |
| 2001 | 4 193 000 000 $ US | #79 |
| 2000 | 4 318 900 000 $ US | #77 |
| 1999 | 4 123 500 000 $ US | #76 |
| 1998 | 3 668 100 000 $ US | #80 |
| 1997 | 3 785 600 000 $ US | #80 |
| 1996 | 3 831 000 000 $ US | #77 |
| 1995 | 4 078 053 747 $ US | #75 |
| 1994 | 3 766 477 027 $ US | #69 |
| 1993 | 2 951 182 568 $ US | #75 |
| 1992 | 3 736 544 459 $ US | #66 |
| 1991 | 5 332 907 602 $ US | #53 |
| 1990 | 8 662 106 516 $ US | #51 |
| 1989 | 8 421 585 288 $ US | #48 |
| 1988 | 8 794 332 850 $ US | #44 |
| 1987 | 8 295 404 426 $ US | #43 |
| 1986 | 7 687 511 279 $ US | #43 |
| 1985 | 7 725 366 416 $ US | #40 |
| 1984 | 7 766 066 363 $ US | #40 |
| 1983 | 7 224 138 184 $ US | #40 |
| 1982 | 6 838 236 471 $ US | #41 |
| 1981 | 6 565 420 000 $ US | #41 |
| 1980 | 6 521 956 667 $ US | #42 |
| 1979 | 6 377 068 904 $ US | #37 |
| 1978 | 5 819 724 675 $ US | #38 |
| 1977 | 4 635 330 843 $ US | #38 |
| 1976 | 4 499 232 765 $ US | #35 |
| 1975 | 4 251 739 756 $ US | #33 |
| 1974 | 3 719 910 244 $ US | #35 |
| 1973 | 3 258 402 051 $ US | #32 |
| 1972 | 2 654 199 161 $ US | #29 |
| 1971 | 2 255 959 900 $ US | #29 |
| 1970 | 1 857 363 400 $ US | #27 |
Les exportations de biens et services de Cuba s'élèvent à 8,77 milliards de dollars (2020), contre 1,86 milliard de dollars en 1970. Le maximum a été de 18,7 milliards de dollars, en 2012. Elles se classent au 117e rang mondial, en baisse par rapport au 92e rang l'année précédente. Leur meilleur rang a été le 27e, occupé pour la dernière fois en 1970.
Les exportations de biens et services de Cuba sont les 20es plus élevées de 27 pays situés en Amérique latine. Les importations de biens et services de Cuba s'élèvent à 8,07 milliards de dollars (2020), au 124e rang mondial. Les exportations de Cuba dépassent ses importations de 702 millions de dollars, soit un excédent commercial (2020).
Exportations de biens de Cuba par catégorie
Exportations de biens, 2022: 2,17 Md $US
La première catégorie des exportations de biens de Cuba est « métaux communs (fer, acier, cuivre, aluminium) », avec 53,4 %, suivie de « aliments transformés, huiles, aliments pour animaux, boissons et tabac », avec 26,6 %.
Destinations des exportations de biens de Cuba : les 10 premières
| Rang | Pays | Exportations de biens | Part | |
|---|---|---|---|---|
| 1 |
 Espagne |
347 M $US | 16 % | |
| 2 |
 Chine |
175 M $US | 8,09 % | |
| 3 |
 Allemagne |
40,8 M $US | 1,88 % | |
| 4 |
 France |
28,7 M $US | 1,32 % | vs France |
| 5 |
 Venezuela |
26,9 M $US | 1,24 % | vs Venezuela |
| 6 |
 Canada |
23,9 M $US | 1,1 % | vs Canada |
| 7 |
 Chypre |
17,5 M $US | 0,81 % | |
| 8 |
 Belgique |
14,3 M $US | 0,66 % | vs Belgique |
| 9 |
 Italie |
13,8 M $US | 0,64 % | |
| 10 |
 Mexique |
12,5 M $US | 0,58 % | |
| Autres partenaires et non précisés | 1,47 Md $US | 67,7 % |
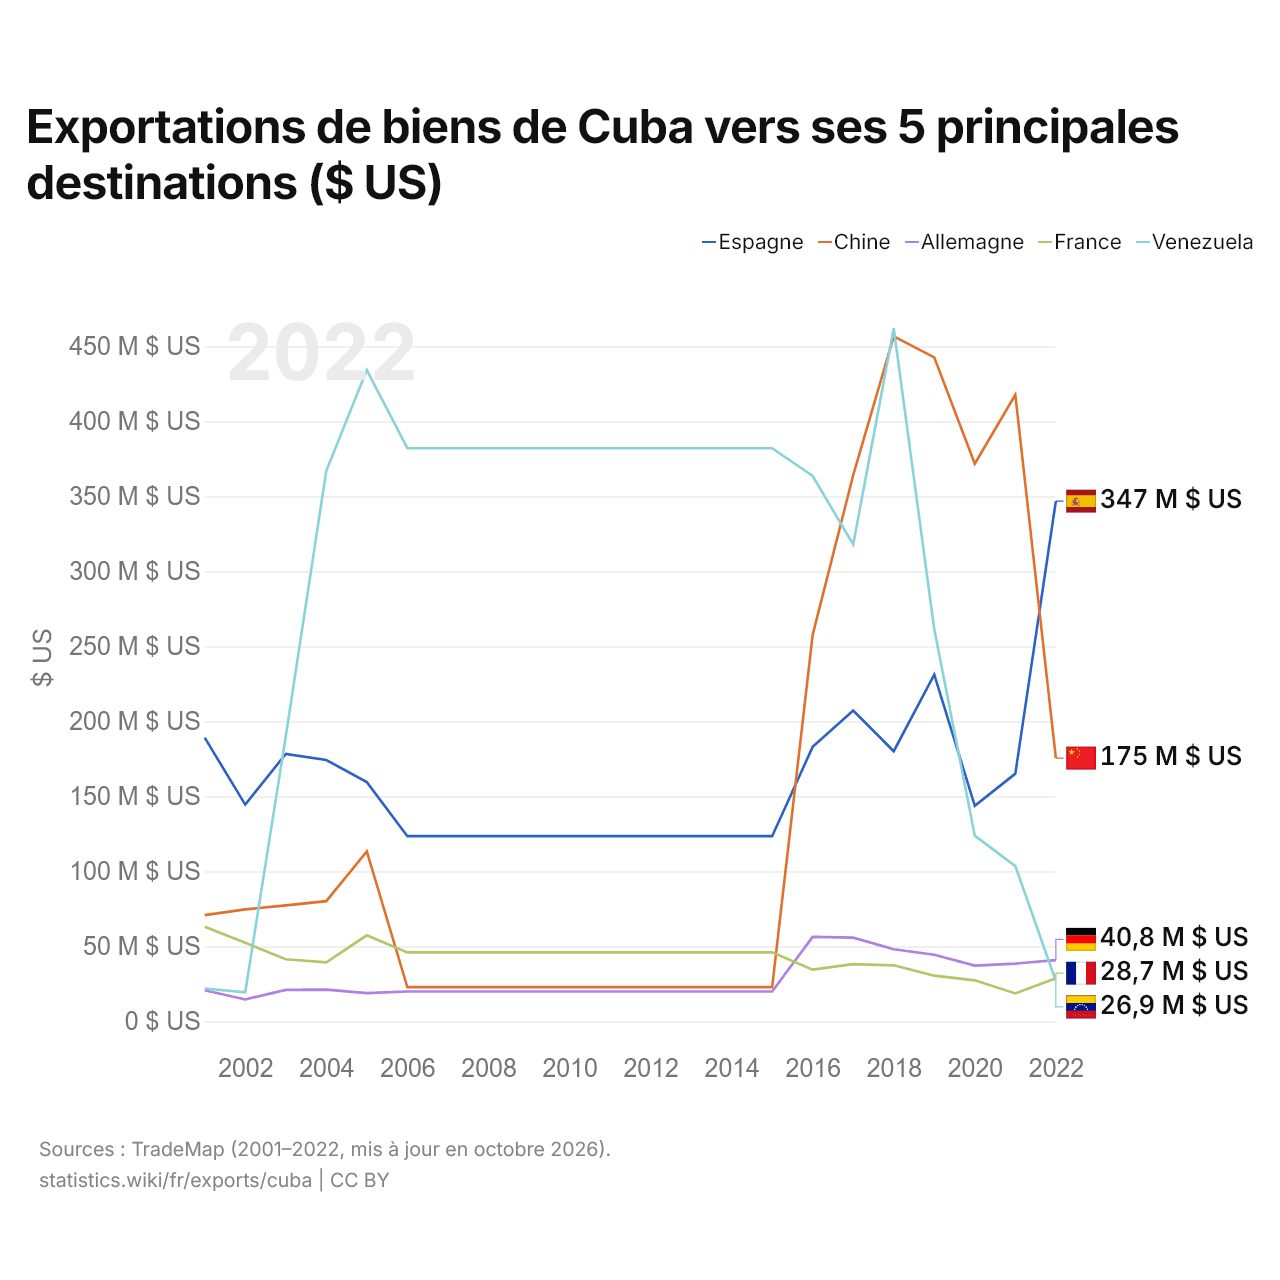
Exportations de biens de Cuba vers ses 5 principales destinations ($ US)
| Année | $ US | ||||
|---|---|---|---|---|---|
| Espagne | Chine | Allemagne | France | Venezuela | |
| 2022 | 346 807 000 $ US | 175 499 000 $ US | 40 840 000 $ US | 28 705 000 $ US | 26 857 000 $ US |
| 2021 | 165 101 000 $ US | 417 708 000 $ US | 38 498 000 $ US | 18 608 000 $ US | 103 489 000 $ US |
| 2020 | 143 685 000 $ US | 371 763 000 $ US | 37 181 000 $ US | 27 323 000 $ US | 123 751 000 $ US |
| 2019 | 231 196 000 $ US | 442 637 000 $ US | 44 417 000 $ US | 30 431 000 $ US | 261 380 000 $ US |
| 2018 | 180 038 000 $ US | 456 586 000 $ US | 48 047 000 $ US | 37 356 000 $ US | 462 048 000 $ US |
| 2017 | 207 180 000 $ US | 364 081 000 $ US | 55 801 000 $ US | 38 108 000 $ US | 317 861 000 $ US |
| 2016 | 182 997 000 $ US | 257 626 000 $ US | 56 297 000 $ US | 34 473 000 $ US | 363 568 000 $ US |
| 2015 | 123 411 000 $ US | 22 853 000 $ US | 19 880 000 $ US | 45 977 000 $ US | 382 032 000 $ US |
| 2014 | 123 411 000 $ US | 22 853 000 $ US | 19 880 000 $ US | 45 977 000 $ US | 382 032 000 $ US |
| 2013 | 123 411 000 $ US | 22 853 000 $ US | 19 880 000 $ US | 45 977 000 $ US | 382 032 000 $ US |
| 2012 | 123 411 000 $ US | 22 853 000 $ US | 19 880 000 $ US | 45 977 000 $ US | 382 032 000 $ US |
| 2011 | 123 411 000 $ US | 22 853 000 $ US | 19 880 000 $ US | 45 977 000 $ US | 382 032 000 $ US |
| 2010 | 123 411 000 $ US | 22 853 000 $ US | 19 880 000 $ US | 45 977 000 $ US | 382 032 000 $ US |
| 2009 | 123 411 000 $ US | 22 853 000 $ US | 19 880 000 $ US | 45 977 000 $ US | 382 032 000 $ US |
| 2008 | 123 411 000 $ US | 22 853 000 $ US | 19 880 000 $ US | 45 977 000 $ US | 382 032 000 $ US |
| 2007 | 123 411 000 $ US | 22 853 000 $ US | 19 880 000 $ US | 45 977 000 $ US | 382 032 000 $ US |
| 2006 | 123 411 000 $ US | 22 853 000 $ US | 19 880 000 $ US | 45 977 000 $ US | 382 032 000 $ US |
| 2005 | 159 482 000 $ US | 113 314 000 $ US | 18 833 000 $ US | 57 348 000 $ US | 434 152 000 $ US |
| 2004 | 174 200 000 $ US | 80 150 000 $ US | 21 084 000 $ US | 39 268 000 $ US | 367 036 000 $ US |
| 2003 | 178 219 000 $ US | 77 336 000 $ US | 20 966 000 $ US | 41 397 000 $ US | 189 857 000 $ US |
| 2002 | 144 478 000 $ US | 74 606 000 $ US | 14 574 000 $ US | 52 369 000 $ US | 19 369 000 $ US |
| 2001 | 189 116 000 $ US | 70 789 000 $ US | 20 744 000 $ US | 63 120 000 $ US | 21 890 000 $ US |
Les exportations de biens s'élèvent à 347 millions de dollars vers l'Espagne (2022), 175 millions de dollars vers la Chine (2022), 40,8 millions de dollars vers l'Allemagne (2022), 28,7 millions de dollars vers la France (2022) et 26,9 millions de dollars vers le Venezuela (2022). Le changement le plus récent dans leur ordre remonte à 2022, quand les exportations de Cuba vers l'Espagne ont dépassé celles vers la Chine.
Cuba dans le classement mondial des exportations
| Rang | Pays | Exportations | Part mondiale | |
|---|---|---|---|---|
| 114 |
 Nicaragua |
9,25 Md $US (2025) | 0,03 % | vs Nicaragua |
| 115 |
 Mozambique |
9,24 Md $US (2025) | 0,03 % | |
| 116 |
 Zambie |
8,85 Md $US (2024) | 0,03 % | |
| 117 |
 Cuba |
8,77 Md $US | 0,04 % | |
| 118 |
 Congo-Brazza |
7,83 Md $US (2025) | 0,02 % | |
| 119 |
 Cameroun |
7,71 Md $US (2025) | 0,02 % | |
| 120 |
 Zimbabwe |
7,50 Md $US (2024) | 0,02 % |
Exportations de biens et services de Cuba, % du PIB
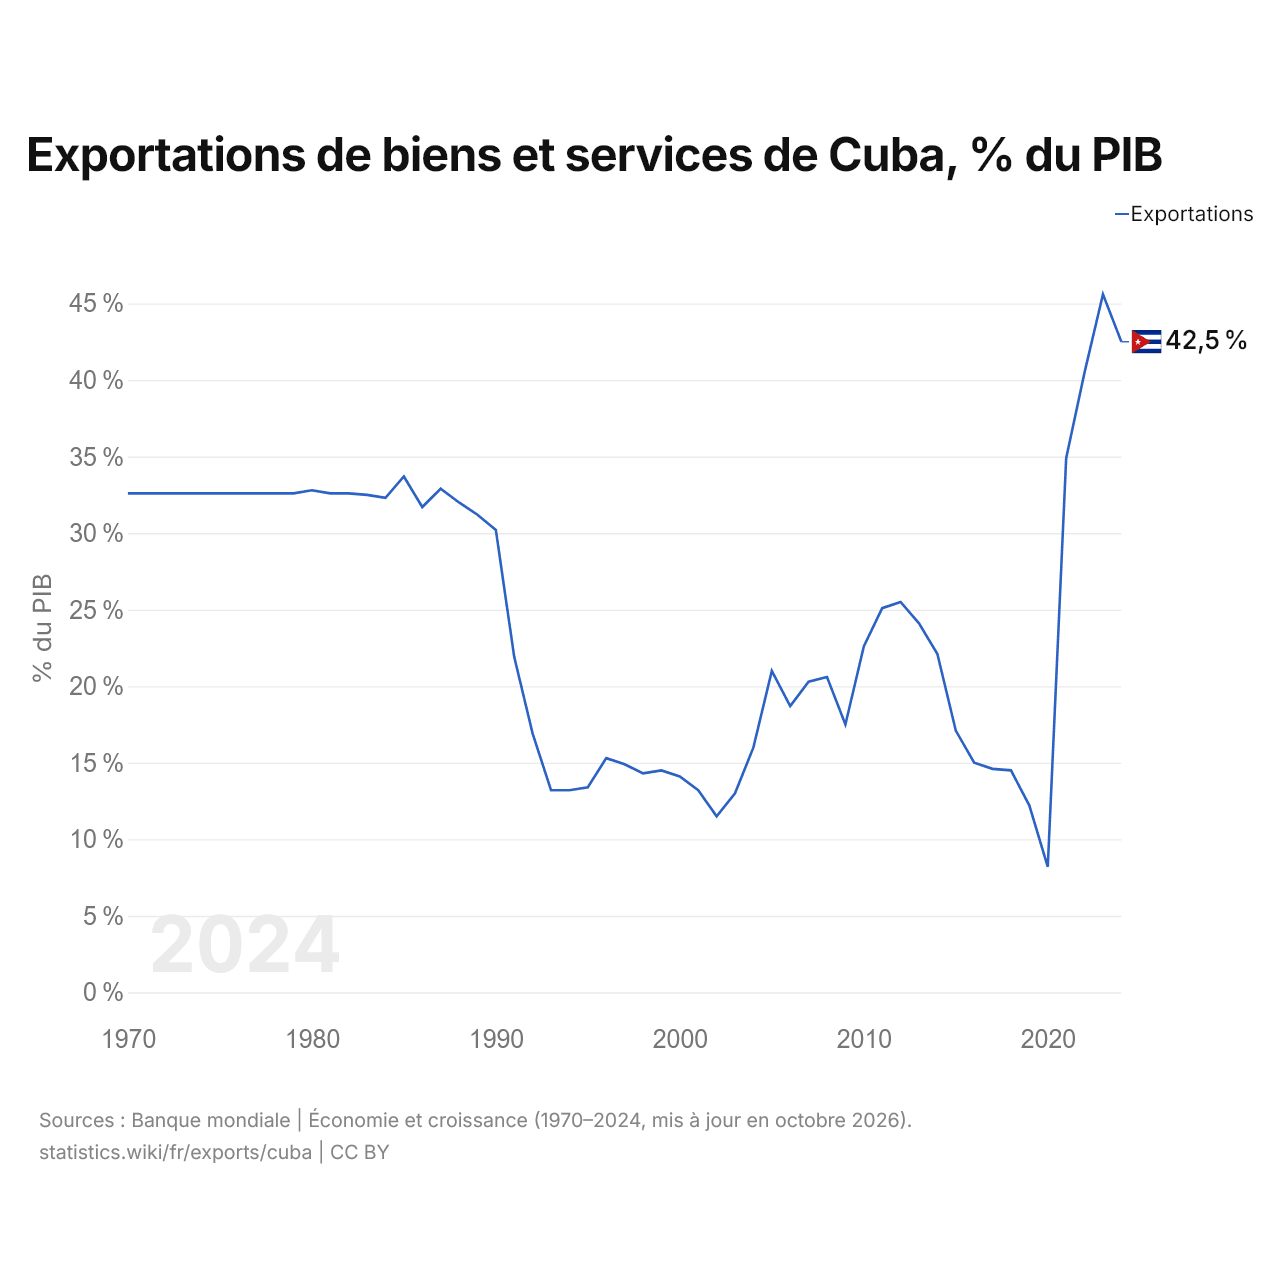
Les exportations de biens et services de Cuba équivalent à 42,5 % de son PIB (2024), contre 32,6 % en 1970. La part la plus élevée a été de 45,6 %, en 2023.
Comparer les exportations de Cuba avec celles d'autres pays
Sources :
- TradeMap (2001–2022, mis à jour en octobre 2026)
- Banque mondiale | Économie et croissance (1970–2025, mis à jour en octobre 2026)
Creative Commons Attribution (CC BY) : vous pouvez copier, partager, adapter et réutiliser ce contenu, y compris à des fins commerciales, à condition de citer statistics.wiki et d’indiquer les modifications apportées. Les sources citées ci-dessus peuvent avoir leurs propres conditions de licence.