
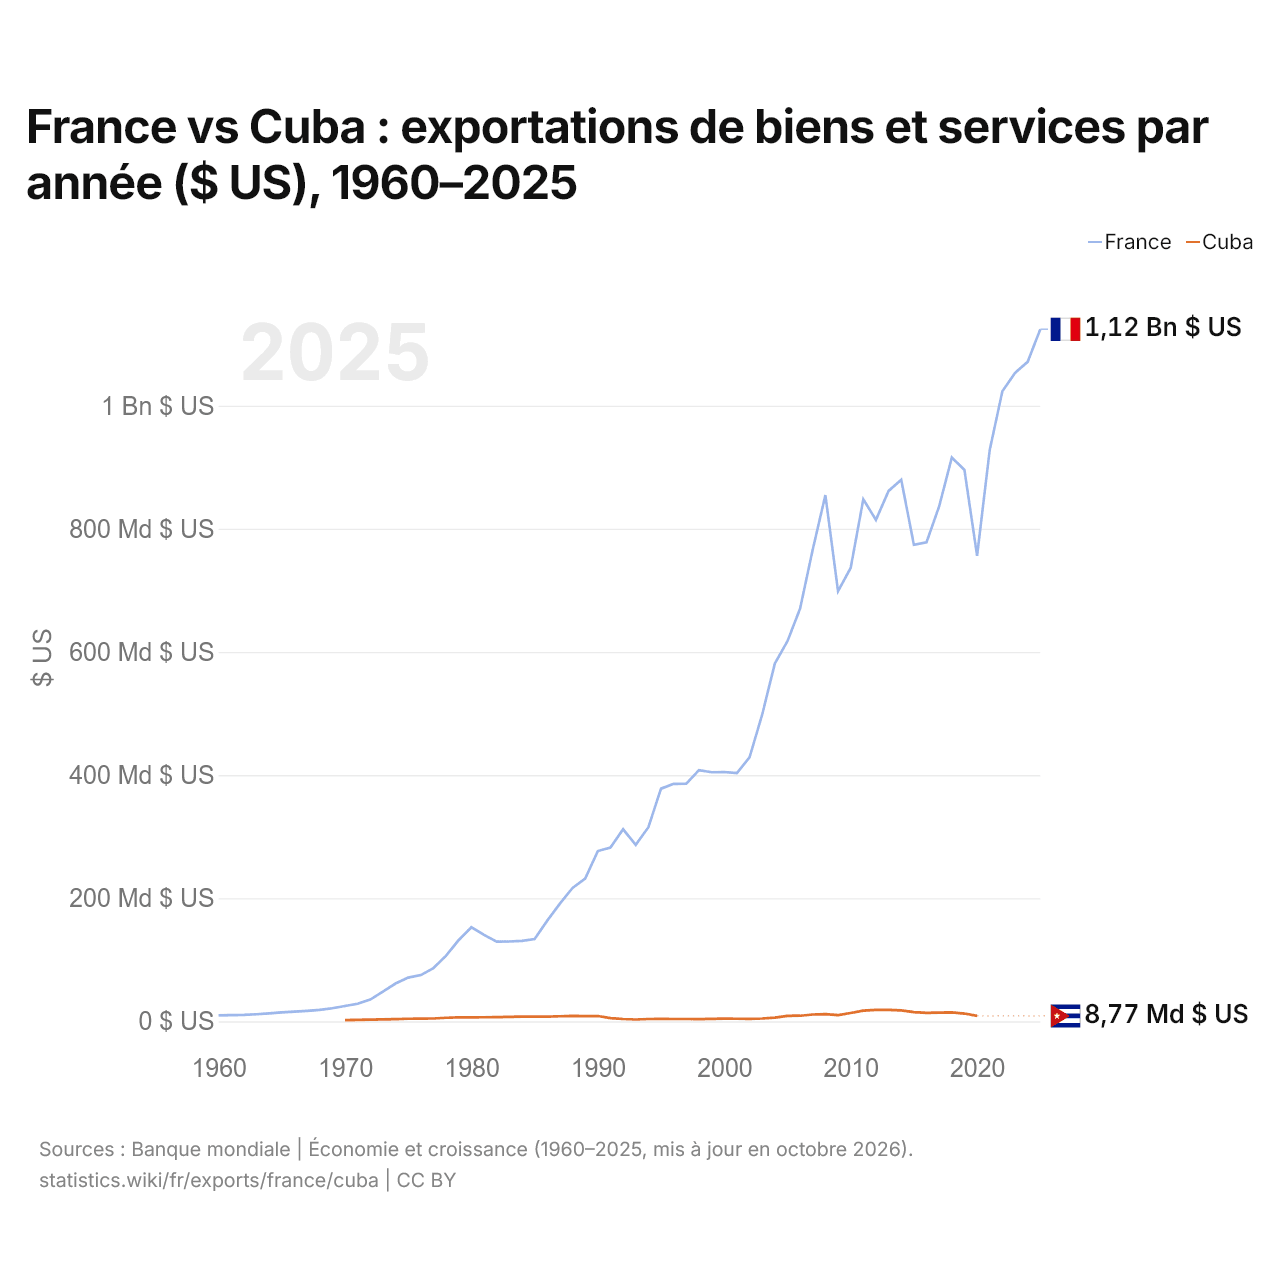
France vs Cuba : exportations de biens et services par année ($ US), 1960–2025
| Année | $ US | |
|---|---|---|
 France |
 Cuba |
|
| 2025 | 1 124 107 902 931 $ US | - |
| 2024 | 1 071 066 237 472 $ US | - |
| 2023 | 1 053 069 574 155 $ US | - |
| 2022 | 1 023 340 977 697 $ US | - |
| 2021 | 928 139 254 791 $ US | - |
| 2020 | 756 174 143 647 $ US | 8 769 000 000 $ US |
| 2019 | 895 514 342 479 $ US | 12 632 000 000 $ US |
| 2018 | 915 638 789 627 $ US | 14 530 000 000 $ US |
| 2017 | 836 510 836 278 $ US | 14 093 000 000 $ US |
| 2016 | 778 134 181 664 $ US | 13 689 600 000 $ US |
| 2015 | 774 108 364 253 $ US | 14 941 000 000 $ US |
| 2014 | 879 595 852 391 $ US | 17 812 000 000 $ US |
| 2013 | 861 474 336 499 $ US | 18 593 000 000 $ US |
| 2012 | 814 445 012 228 $ US | 18 659 000 000 $ US |
| 2011 | 847 885 600 685 $ US | 17 319 000 000 $ US |
| 2010 | 736 352 883 613 $ US | 13 443 518 519 $ US |
| 2009 | 698 805 241 357 $ US | 10 036 111 111 $ US |
| 2008 | 854 598 937 578 $ US | 11 580 000 000 $ US |
| 2007 | 766 429 838 942 $ US | 11 035 092 593 $ US |
| 2006 | 670 507 475 708 $ US | 9 138 888 889 $ US |
| 2005 | 617 386 391 344 $ US | 8 962 900 000 $ US |
| 2004 | 580 996 794 039 $ US | 6 120 800 000 $ US |
| 2003 | 497 989 403 586 $ US | 4 649 900 000 $ US |
| 2002 | 428 784 967 659 $ US | 3 872 000 000 $ US |
| 2001 | 403 310 126 489 $ US | 4 193 000 000 $ US |
| 2000 | 404 994 866 620 $ US | 4 318 900 000 $ US |
| 1999 | 404 544 866 221 $ US | 4 123 500 000 $ US |
| 1998 | 407 948 410 051 $ US | 3 668 100 000 $ US |
| 1997 | 385 977 860 193 $ US | 3 785 600 000 $ US |
| 1996 | 385 700 089 755 $ US | 3 831 000 000 $ US |
| 1995 | 377 901 958 207 $ US | 4 078 053 747 $ US |
| 1994 | 315 281 781 664 $ US | 3 766 477 027 $ US |
| 1993 | 286 749 942 089 $ US | 2 951 182 568 $ US |
| 1992 | 311 915 489 467 $ US | 3 736 544 459 $ US |
| 1991 | 282 187 071 271 $ US | 5 332 907 602 $ US |
| 1990 | 276 540 778 219 $ US | 8 662 106 516 $ US |
| 1989 | 231 757 351 429 $ US | 8 421 585 288 $ US |
| 1988 | 216 541 900 672 $ US | 8 794 332 850 $ US |
| 1987 | 191 116 992 251 $ US | 8 295 404 426 $ US |
| 1986 | 163 573 823 279 $ US | 7 687 511 279 $ US |
| 1985 | 133 608 336 984 $ US | 7 725 366 416 $ US |
| 1984 | 130 768 670 720 $ US | 7 766 066 363 $ US |
| 1983 | 129 679 318 358 $ US | 7 224 138 184 $ US |
| 1982 | 129 417 606 548 $ US | 6 838 236 471 $ US |
| 1981 | 140 423 536 512 $ US | 6 565 420 000 $ US |
| 1980 | 152 790 282 521 $ US | 6 521 956 667 $ US |
| 1979 | 132 072 926 303 $ US | 6 377 068 904 $ US |
| 1978 | 106 772 238 372 $ US | 5 819 724 675 $ US |
| 1977 | 86 513 238 834 $ US | 4 635 330 843 $ US |
| 1976 | 75 121 414 914 $ US | 4 499 232 765 $ US |
| 1975 | 70 958 390 699 $ US | 4 251 739 756 $ US |
| 1974 | 61 397 981 451 $ US | 3 719 910 244 $ US |
| 1973 | 48 415 733 648 $ US | 3 258 402 051 $ US |
| 1972 | 35 386 996 099 $ US | 2 654 199 161 $ US |
| 1971 | 28 648 395 880 $ US | 2 255 959 900 $ US |
| 1970 | 24 880 359 041 $ US | 1 857 363 400 $ US |
| 1969 | 21 332 691 446 $ US | - |
| 1968 | 18 545 142 886 $ US | - |
| 1967 | 16 945 727 282 $ US | - |
| 1966 | 15 759 518 400 $ US | - |
| 1965 | 14 511 926 398 $ US | - |
| 1964 | 12 972 299 548 $ US | - |
| 1963 | 11 534 712 171 $ US | - |
| 1962 | 10 480 171 412 $ US | - |
| 1961 | 10 206 604 646 $ US | - |
| 1960 | 9 666 380 037 $ US | - |
Les exportations de biens et services de la France s'élèvent à 1,12 billion de dollars (2025), et celles de Cuba à 8,77 milliards de dollars (2020). En 1970, les exportations de la France étaient 13 fois plus élevées : 24,9 milliards de dollars pour la France et 1,86 milliard de dollars pour Cuba.
Les exportations de biens et services de la France sont supérieures à celles de Cuba chaque année depuis 1970.
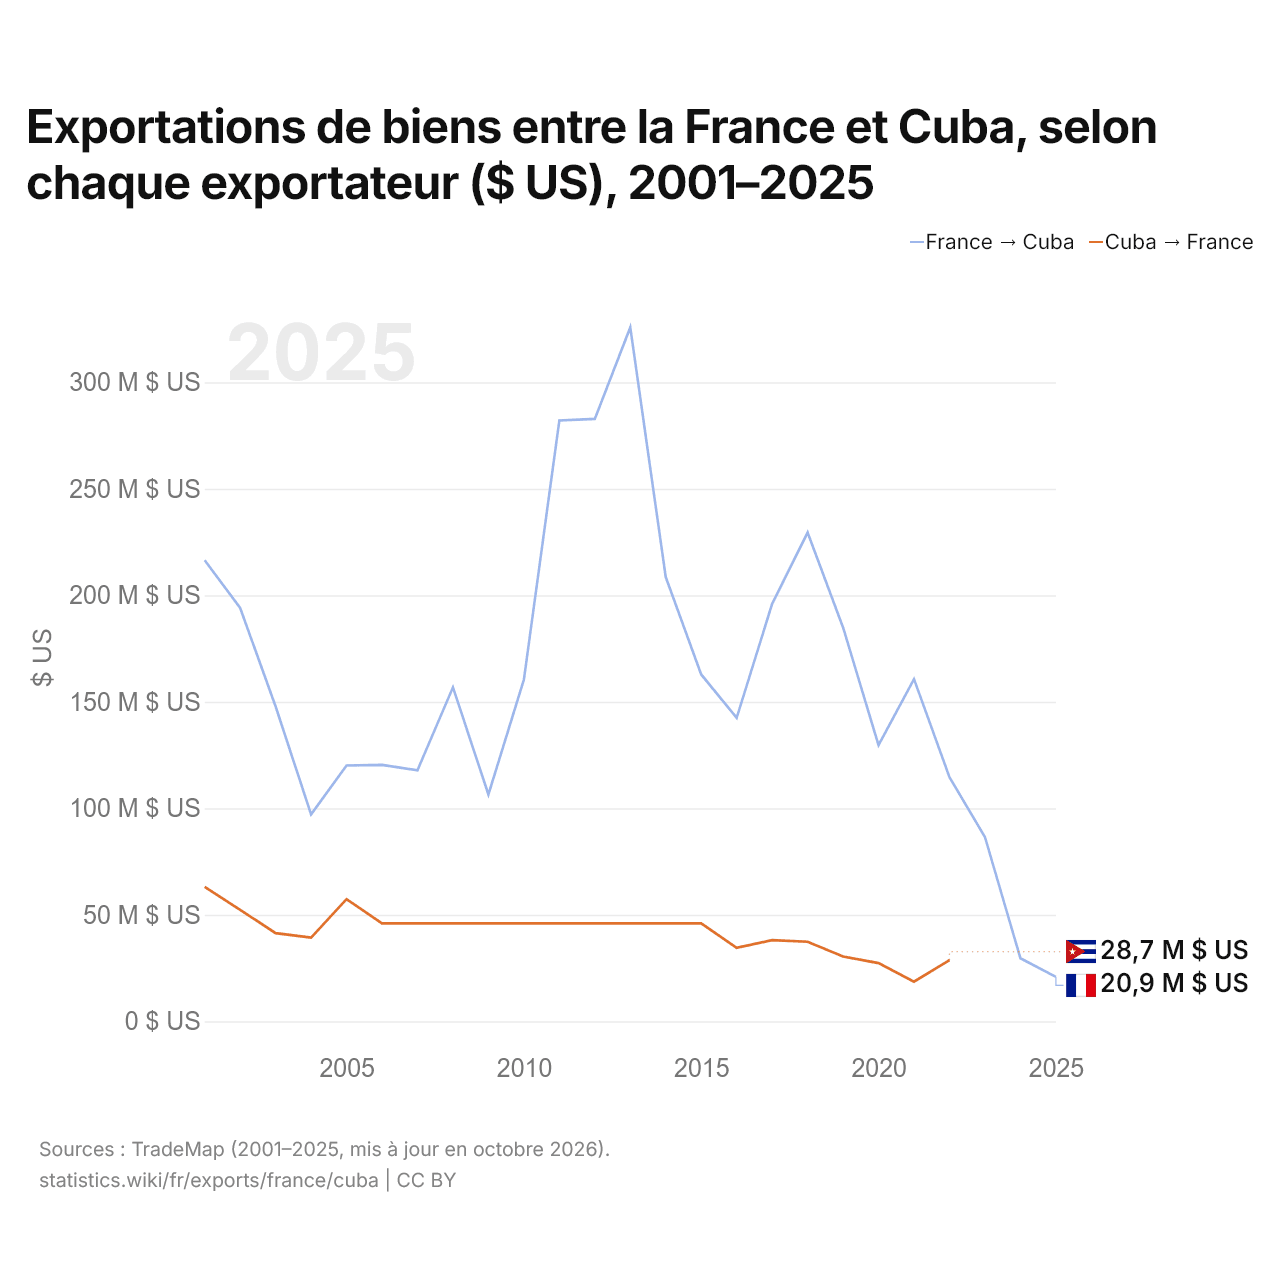
Exportations de biens entre la France et Cuba, selon chaque exportateur ($ US), 2001–2025
| Année | $ US | |
|---|---|---|
| France → Cuba | Cuba → France | |
| 2025 | 20 899 000 $ US | - |
| 2024 | 29 635 000 $ US | - |
| 2023 | 86 557 000 $ US | - |
| 2022 | 114 656 000 $ US | 28 705 000 $ US |
| 2021 | 160 681 000 $ US | 18 608 000 $ US |
| 2020 | 129 694 000 $ US | 27 323 000 $ US |
| 2019 | 184 936 000 $ US | 30 431 000 $ US |
| 2018 | 229 462 000 $ US | 37 356 000 $ US |
| 2017 | 196 033 000 $ US | 38 108 000 $ US |
| 2016 | 142 486 000 $ US | 34 473 000 $ US |
| 2015 | 162 861 000 $ US | 45 977 000 $ US |
| 2014 | 208 589 000 $ US | 45 977 000 $ US |
| 2013 | 325 799 000 $ US | 45 977 000 $ US |
| 2012 | 282 835 000 $ US | 45 977 000 $ US |
| 2011 | 282 084 000 $ US | 45 977 000 $ US |
| 2010 | 160 364 000 $ US | 45 977 000 $ US |
| 2009 | 106 480 000 $ US | 45 977 000 $ US |
| 2008 | 156 810 000 $ US | 45 977 000 $ US |
| 2007 | 117 886 000 $ US | 45 977 000 $ US |
| 2006 | 120 432 000 $ US | 45 977 000 $ US |
| 2005 | 120 122 000 $ US | 57 348 000 $ US |
| 2004 | 97 147 000 $ US | 39 268 000 $ US |
| 2003 | 147 812 000 $ US | 41 397 000 $ US |
| 2002 | 194 083 000 $ US | 52 369 000 $ US |
| 2001 | 216 496 000 $ US | 63 120 000 $ US |
Les exportations de biens de la France vers Cuba, selon la France, s'élevaient à 115 millions de dollars, et celles de Cuba vers la France, selon Cuba, à 28,7 millions de dollars : 4,0 fois plus pour celles de la France. En 2001, elles s'élevaient à 216 millions de dollars pour la France et à 63,1 millions de dollars pour Cuba.
France vs Cuba : chiffres des exportations
|
France
|
Cuba
|
|
|---|---|---|
| Exportations | 1,12 Bn $US (2025) | 8,77 Md $US (2020) |
| Rang mondial | 5/176 | 117/176 |
| Part mondiale | 3,22 % | 0,04 % |
| % du PIB | 33,4 % | 8,2 % |
| Première catégorie de biens | Machines, électronique et véhicules (39,3 %, 2025) | Métaux communs (fer, acier, cuivre, aluminium) (53,4 %, 2022) |
| Première destination des biens | Allemagne (13,5 %, 2025) | Espagne (16 %, 2022) |
Comparer les exportations de 2 pays au choix
Sources :
- Banque mondiale | Économie et croissance (1960–2025, mis à jour en octobre 2026)
- TradeMap (2001–2025, mis à jour en octobre 2026)
Creative Commons Attribution (CC BY) : vous pouvez copier, partager, adapter et réutiliser ce contenu, y compris à des fins commerciales, à condition de citer statistics.wiki et d’indiquer les modifications apportées. Les sources citées ci-dessus peuvent avoir leurs propres conditions de licence.