
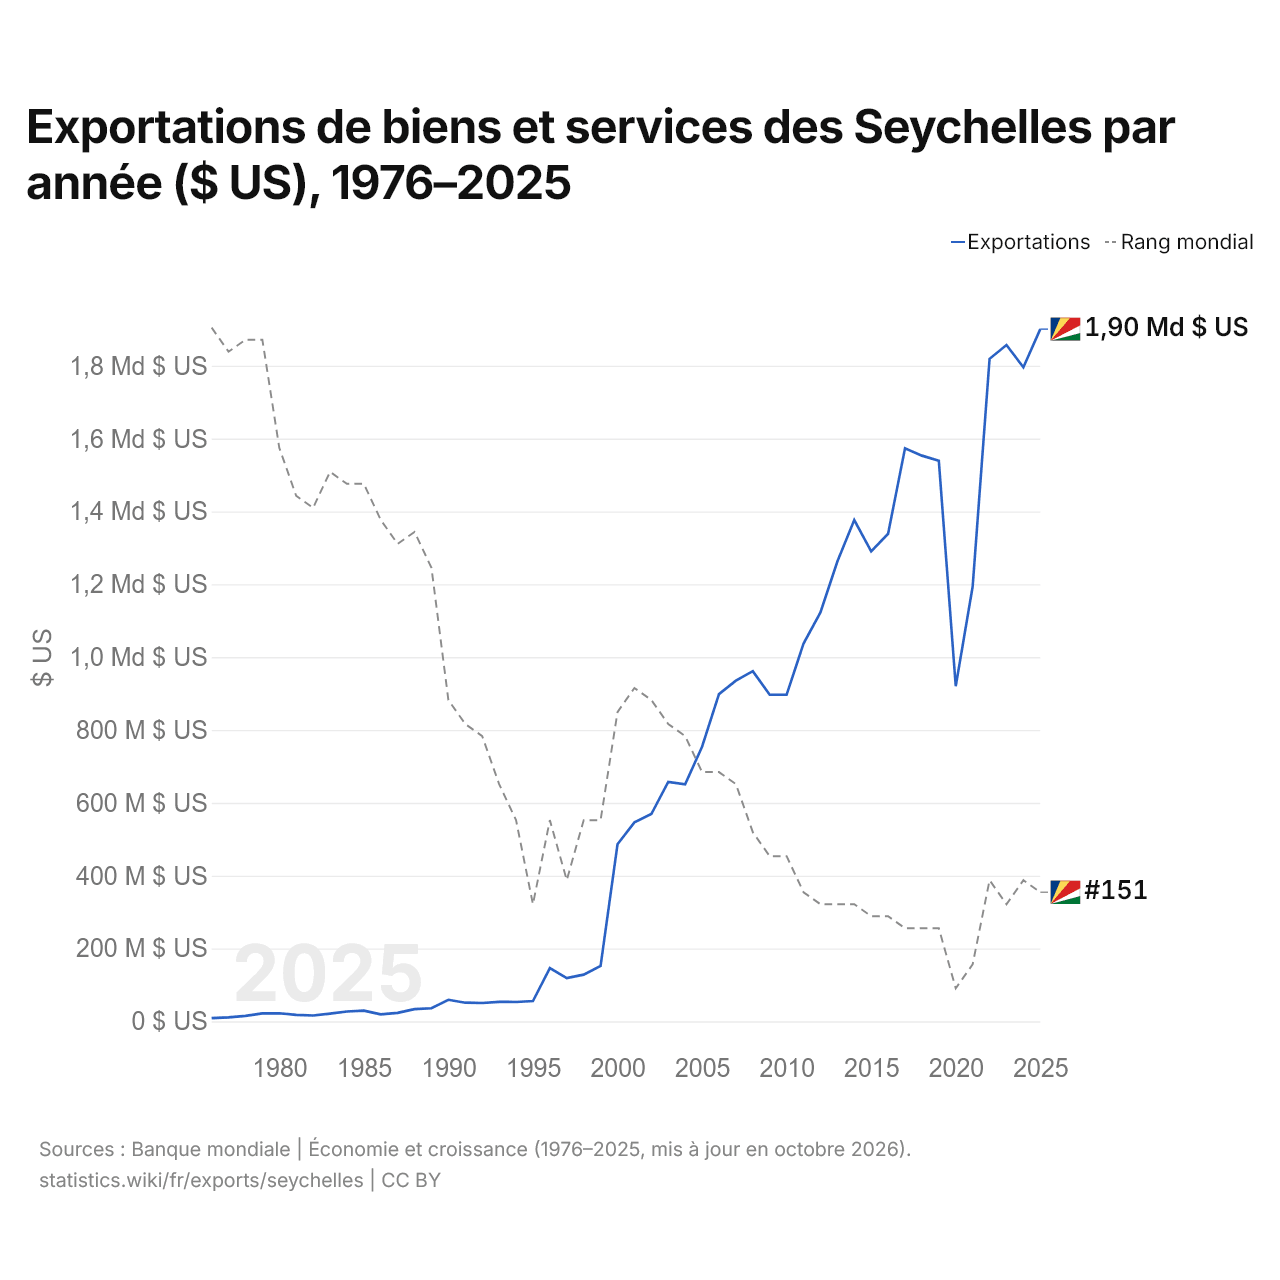
Exportations de biens et services des Seychelles par année ($ US), 1976–2025
| Année | $ US | Rang mondial |
|---|---|---|
| Exportations | Rang mondial | |
| 2025 | 1 900 518 395 $ US | #151 |
| 2024 | 1 795 765 733 $ US | #150 |
| 2023 | 1 856 806 848 $ US | #152 |
| 2022 | 1 818 966 306 $ US | #150 |
| 2021 | 1 193 663 263 $ US | #157 |
| 2020 | 920 042 422 $ US | #159 |
| 2019 | 1 538 983 436 $ US | #154 |
| 2018 | 1 553 145 430 $ US | #154 |
| 2017 | 1 573 333 403 $ US | #154 |
| 2016 | 1 338 730 180 $ US | #153 |
| 2015 | 1 290 375 235 $ US | #153 |
| 2014 | 1 376 210 127 $ US | #152 |
| 2013 | 1 262 543 323 $ US | #152 |
| 2012 | 1 122 604 568 $ US | #152 |
| 2011 | 1 037 324 780 $ US | #151 |
| 2010 | 896 873 106 $ US | #148 |
| 2009 | 896 738 913 $ US | #148 |
| 2008 | 961 331 923 $ US | #146 |
| 2007 | 935 575 118 $ US | #142 |
| 2006 | 898 472 650 $ US | #141 |
| 2005 | 754 034 109 $ US | #141 |
| 2004 | 650 842 527 $ US | #138 |
| 2003 | 657 204 442 $ US | #137 |
| 2002 | 569 063 799 $ US | #135 |
| 2001 | 546 294 060 $ US | #134 |
| 2000 | 486 226 808 $ US | #136 |
| 1999 | 152 013 308 $ US | #145 |
| 1998 | 128 162 616 $ US | #145 |
| 1997 | 118 656 888 $ US | #150 |
| 1996 | 146 186 060 $ US | #145 |
| 1995 | 55 776 980 $ US | #152 |
| 1994 | 52 986 352 $ US | #145 |
| 1993 | 53 589 237 $ US | #142 |
| 1992 | 50 252 836 $ US | #138 |
| 1991 | 51 160 208 $ US | #137 |
| 1990 | 59 192 935 $ US | #135 |
| 1989 | 35 914 016 $ US | #124 |
| 1988 | 33 344 241 $ US | #121 |
| 1987 | 23 213 176 $ US | #122 |
| 1986 | 19 278 076 $ US | #120 |
| 1985 | 29 326 495 $ US | #117 |
| 1984 | 26 935 625 $ US | #117 |
| 1983 | 21 248 692 $ US | #116 |
| 1982 | 15 986 241 $ US | #119 |
| 1981 | 17 859 602 $ US | #118 |
| 1980 | 22 163 209 $ US | #114 |
| 1979 | 21 890 204 $ US | #105 |
| 1978 | 15 164 545 $ US | #105 |
| 1977 | 11 089 069 $ US | #106 |
| 1976 | 8 673 004 $ US | #104 |
En 2025, les exportations de biens et services des Seychelles s'élevaient à 1,9 milliard de dollars, contre 8,67 millions de dollars en 1976. Elles se classaient au 151e rang mondial, en baisse par rapport au 150e rang en 2024. Leur meilleur rang a été le 104e, occupé pour la dernière fois en 1976.
En 2025, les exportations de biens et services des Seychelles étaient les 39es plus élevées de 50 pays situés en Afrique. Les importations de biens et services des Seychelles s'élevaient à 2,21 milliards de dollars en 2025, au 153e rang mondial. En 2025, les importations des Seychelles dépassaient leurs exportations de 312 millions de dollars, soit un déficit commercial.
Exportations de biens des Seychelles par catégorie, 2025
Exportations de biens, 2025: 587 M $US
En 2025, la première catégorie des exportations de biens des Seychelles était « aliments transformés, huiles, aliments pour animaux, boissons et tabac », avec 45,0 %, suivie de « pétrole, gaz, minerais et autres matières premières », avec 29,9 %.
Destinations des exportations de biens des Seychelles : les 10 premières, 2025
| Rang | Pays | Exportations de biens | Part | |
|---|---|---|---|---|
| 1 |
 EAU |
188 M $US | 32 % | |
| 2 |
 France |
92,3 M $US | 15,7 % | vs France |
| 3 |
 Allemagne |
52,2 M $US | 8,89 % | |
| 4 |
 Royaume-Uni |
45,1 M $US | 7,68 % | |
| 5 |
 Italie |
41,5 M $US | 7,06 % | |
| 6 |
 Espagne |
24,2 M $US | 4,12 % | |
| 7 |
 Thaïlande |
17,0 M $US | 2,89 % | |
| 8 |
 Pays-Bas |
16,3 M $US | 2,78 % | |
| 9 |
 Maurice |
14,4 M $US | 2,45 % | vs Maurice |
| 10 |
 Côte d’Ivoire |
13,7 M $US | 2,33 % | |
| Autres partenaires et non précisés | 82,5 M $US | 14 % |
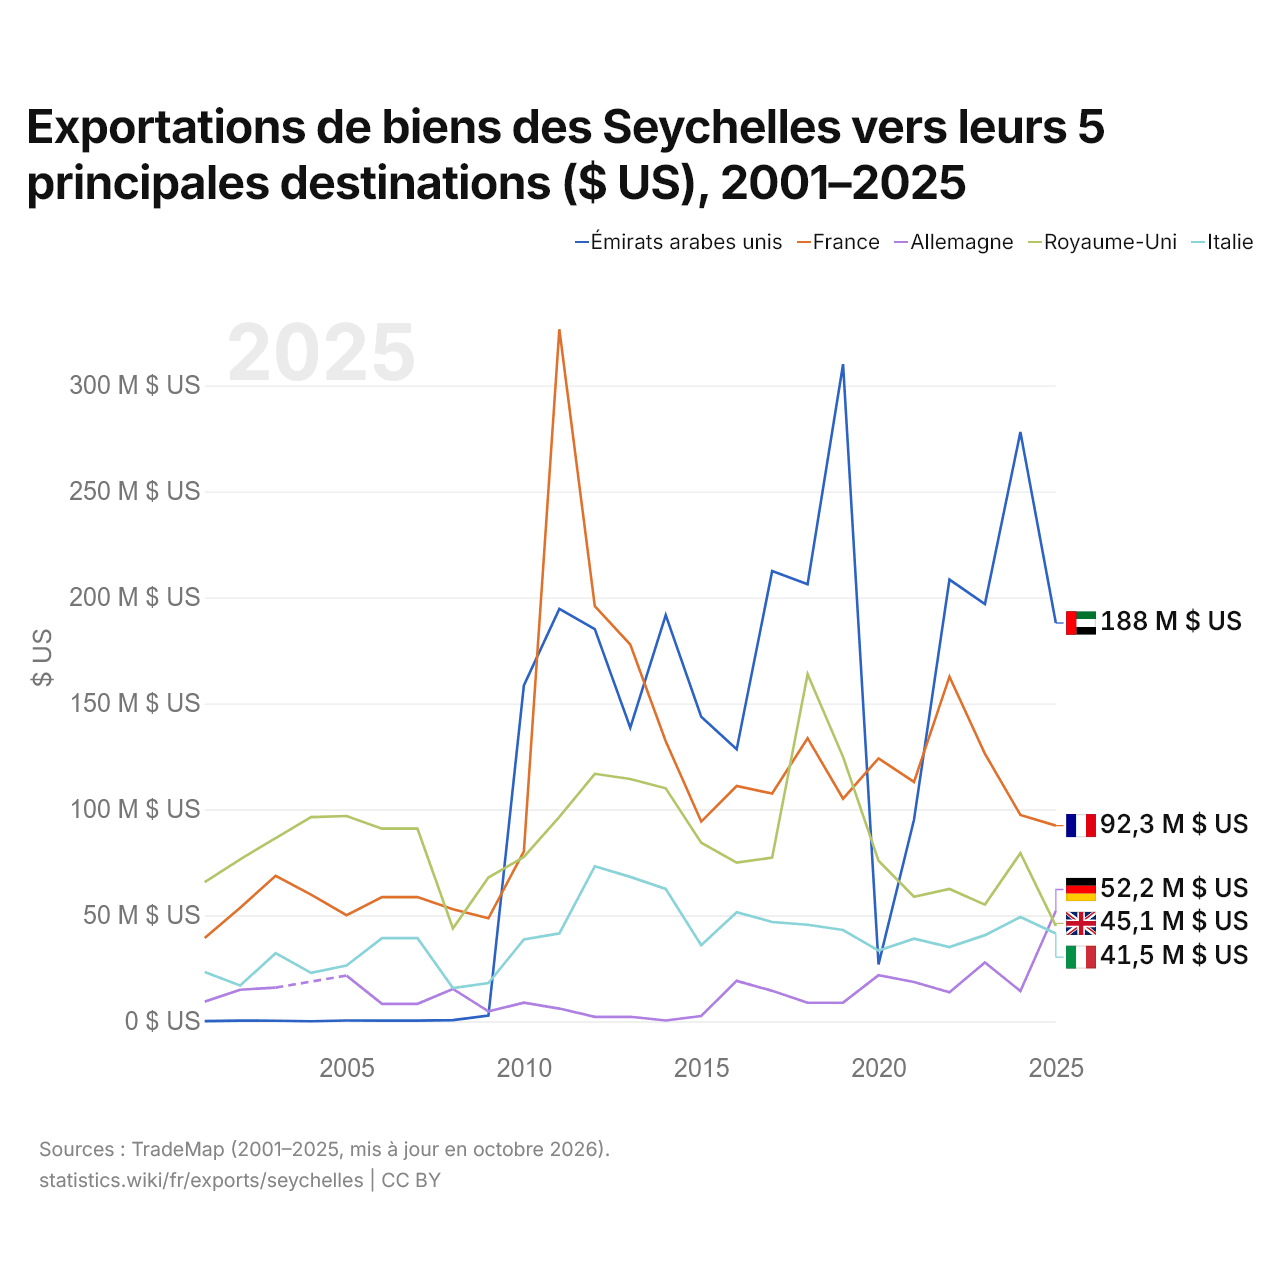
Exportations de biens des Seychelles vers leurs 5 principales destinations ($ US), 2001–2025
| Année | $ US | ||||
|---|---|---|---|---|---|
| Émirats arabes unis | France | Allemagne | Royaume-Uni | Italie | |
| 2025 | 187 926 000 $ US | 92 319 000 $ US | 52 194 000 $ US | 45 063 000 $ US | 41 458 000 $ US |
| 2024 | 277 982 000 $ US | 97 385 000 $ US | 14 274 000 $ US | 79 340 000 $ US | 49 190 000 $ US |
| 2023 | 196 869 000 $ US | 126 242 000 $ US | 27 743 000 $ US | 55 063 000 $ US | 40 666 000 $ US |
| 2022 | 208 416 000 $ US | 162 605 000 $ US | 13 731 000 $ US | 62 441 000 $ US | 35 018 000 $ US |
| 2021 | 95 116 000 $ US | 112 931 000 $ US | 18 531 000 $ US | 58 797 000 $ US | 39 013 000 $ US |
| 2020 | 26 862 000 $ US | 124 070 000 $ US | 21 728 000 $ US | 75 731 000 $ US | 33 398 000 $ US |
| 2019 | 310 041 000 $ US | 105 032 000 $ US | 8 815 000 $ US | 124 757 000 $ US | 43 099 000 $ US |
| 2018 | 206 247 000 $ US | 133 601 000 $ US | 8 758 000 $ US | 163 763 000 $ US | 45 567 000 $ US |
| 2017 | 212 405 000 $ US | 107 491 000 $ US | 14 385 000 $ US | 77 244 000 $ US | 46 876 000 $ US |
| 2016 | 128 318 000 $ US | 111 018 000 $ US | 19 101 000 $ US | 74 857 000 $ US | 51 489 000 $ US |
| 2015 | 143 673 000 $ US | 94 230 000 $ US | 2 517 000 $ US | 84 276 000 $ US | 35 891 000 $ US |
| 2014 | 191 663 000 $ US | 132 168 000 $ US | 387 000 $ US | 109 942 000 $ US | 62 453 000 $ US |
| 2013 | 138 508 000 $ US | 177 793 000 $ US | 2 165 000 $ US | 114 324 000 $ US | 68 158 000 $ US |
| 2012 | 185 023 000 $ US | 195 916 000 $ US | 2 096 000 $ US | 116 783 000 $ US | 73 148 000 $ US |
| 2011 | 194 564 000 $ US | 326 505 000 $ US | 6 025 000 $ US | 96 428 000 $ US | 41 471 000 $ US |
| 2010 | 158 531 000 $ US | 80 233 000 $ US | 8 807 000 $ US | 77 529 000 $ US | 38 632 000 $ US |
| 2009 | 2 714 000 $ US | 48 606 000 $ US | 4 707 000 $ US | 67 817 000 $ US | 18 051 000 $ US |
| 2008 | 567 000 $ US | 52 908 000 $ US | 15 283 000 $ US | 43 859 000 $ US | 15 664 000 $ US |
| 2007 | 351 000 $ US | 58 628 000 $ US | 8 247 000 $ US | 90 879 000 $ US | 39 264 000 $ US |
| 2006 | 351 000 $ US | 58 628 000 $ US | 8 247 000 $ US | 90 879 000 $ US | 39 264 000 $ US |
| 2005 | 375 000 $ US | 50 085 000 $ US | 21 574 000 $ US | 96 860 000 $ US | 26 324 000 $ US |
| 2004 | 23 000 $ US | 59 771 000 $ US | - | 96 310 000 $ US | 22 864 000 $ US |
| 2003 | 259 000 $ US | 68 648 000 $ US | 15 922 000 $ US | 86 451 000 $ US | 32 155 000 $ US |
| 2002 | 352 000 $ US | 53 580 000 $ US | 14 917 000 $ US | 76 443 000 $ US | 16 883 000 $ US |
| 2001 | 77 000 $ US | 39 355 000 $ US | 9 291 000 $ US | 65 716 000 $ US | 23 222 000 $ US |
En 2025, les exportations de biens s'élevaient à 188 millions de dollars vers les Émirats arabes unis, 92,3 millions de dollars vers la France, 52,2 millions de dollars vers l'Allemagne, 45,1 millions de dollars vers le Royaume-Uni et 41,5 millions de dollars vers l'Italie. Le premier rang des cinq destinations des Seychelles est occupé par les Émirats arabes unis depuis 2022. Le changement le plus récent dans leur ordre remonte à 2025, quand les exportations des Seychelles vers l'Allemagne ont dépassé celles vers le Royaume-Uni.
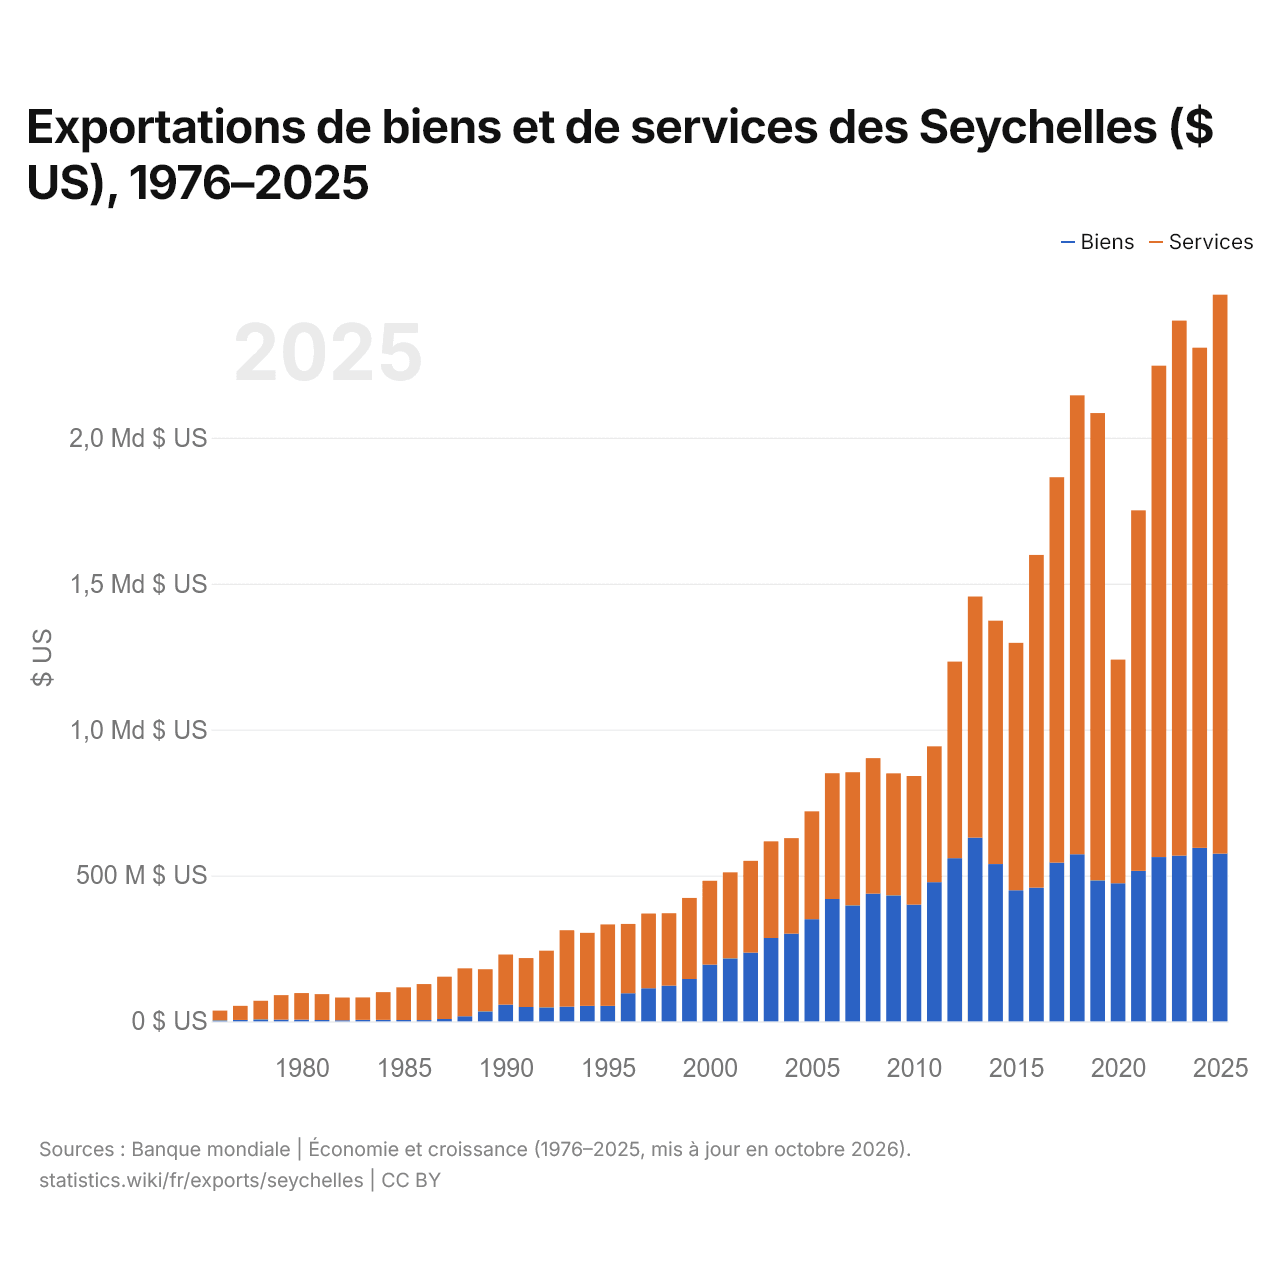
Exportations de biens et de services des Seychelles ($ US), 1976–2025
| Année | $ US | |
|---|---|---|
| Biens | Services | |
| 2025 | 574 614 830 $ US | 1 915 745 447 $ US |
| 2024 | 594 523 419 $ US | 1 714 005 325 $ US |
| 2023 | 568 316 419 $ US | 1 833 105 125 $ US |
| 2022 | 562 903 302 $ US | 1 684 206 083 $ US |
| 2021 | 515 711 919 $ US | 1 235 449 695 $ US |
| 2020 | 473 095 872 $ US | 766 629 735 $ US |
| 2019 | 483 204 709 $ US | 1 601 451 164 $ US |
| 2018 | 572 651 573 $ US | 1 572 709 369 $ US |
| 2017 | 543 869 936 $ US | 1 320 666 142 $ US |
| 2016 | 458 313 705 $ US | 1 140 039 659 $ US |
| 2015 | 449 378 321 $ US | 847 696 384 $ US |
| 2014 | 539 047 612 $ US | 834 193 214 $ US |
| 2013 | 629 231 855 $ US | 826 684 610 $ US |
| 2012 | 559 121 525 $ US | 673 666 642 $ US |
| 2011 | 476 895 953 $ US | 465 559 713 $ US |
| 2010 | 400 233 777 $ US | 440 514 381 $ US |
| 2009 | 431 798 721 $ US | 417 995 764 $ US |
| 2008 | 437 609 651 $ US | 464 460 174 $ US |
| 2007 | 397 557 334 $ US | 456 183 432 $ US |
| 2006 | 419 201 876 $ US | 431 162 096 $ US |
| 2005 | 350 101 877 $ US | 369 568 297 $ US |
| 2004 | 300 362 779 $ US | 327 338 528 $ US |
| 2003 | 285 614 758 $ US | 331 206 284 $ US |
| 2002 | 235 928 394 $ US | 314 064 568 $ US |
| 2001 | 215 749 650 $ US | 294 851 057 $ US |
| 2000 | 194 101 619 $ US | 287 608 113 $ US |
| 1999 | 145 135 780 $ US | 277 820 842 $ US |
| 1998 | 122 306 453 $ US | 248 009 780 $ US |
| 1997 | 113 263 291 $ US | 256 154 891 $ US |
| 1996 | 96 318 230 $ US | 237 398 985 $ US |
| 1995 | 53 234 215 $ US | 278 959 885 $ US |
| 1994 | 52 988 035 $ US | 250 343 249 $ US |
| 1993 | 50 332 591 $ US | 261 717 896 $ US |
| 1992 | 47 917 342 $ US | 194 224 026 $ US |
| 1991 | 49 177 472 $ US | 167 643 972 $ US |
| 1990 | 56 996 411 $ US | 171 929 930 $ US |
| 1989 | 34 220 329 $ US | 144 366 320 $ US |
| 1988 | 17 263 395 $ US | 164 423 612 $ US |
| 1987 | 8 085 239 $ US | 144 852 423 $ US |
| 1986 | 4 413 725 $ US | 123 271 308 $ US |
| 1985 | 4 635 064 $ US | 111 990 340 $ US |
| 1984 | 4 975 064 $ US | 95 065 988 $ US |
| 1983 | 4 993 390 $ US | 76 798 729 $ US |
| 1982 | 3 840 098 $ US | 77 763 642 $ US |
| 1981 | 4 643 106 $ US | 88 692 174 $ US |
| 1980 | 5 650 041 $ US | 91 218 839 $ US |
| 1979 | 6 223 197 $ US | 83 623 961 $ US |
| 1978 | 6 630 740 $ US | 63 804 693 $ US |
| 1977 | 4 827 705 $ US | 48 237 800 $ US |
| 1976 | 3 046 281 $ US | 33 886 501 $ US |
En 2025, les exportations de biens des Seychelles s'élevaient à 575 millions de dollars et celles de services à 1,92 milliard de dollars ; les services représentaient 76,9 % du total, contre 91,8 % en 1976.
Les Seychelles dans le classement mondial des exportations, 2025







Exportations de biens et services des Seychelles, % du PIB, 1976–2025
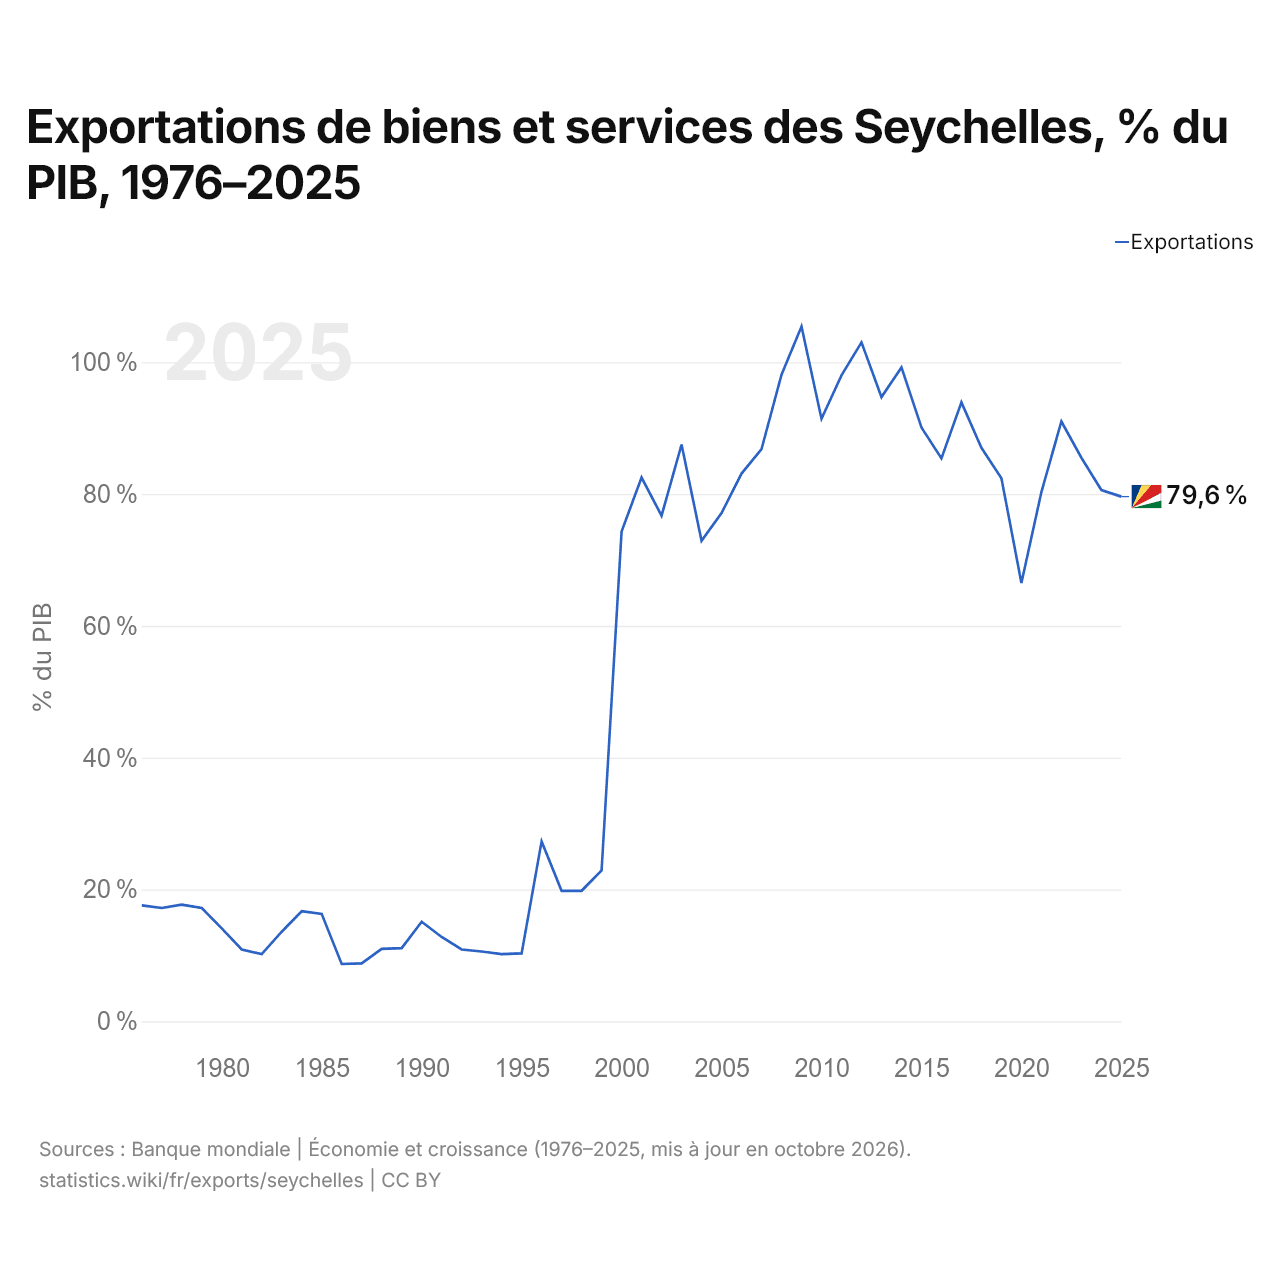
En 2025, les exportations de biens et services des Seychelles équivalaient à 79,6 % de leur PIB, contre 17,6 % en 1976. La part la plus élevée a été de 105,4 %, en 2009.
Comparer les exportations des Seychelles avec celles d'autres pays
Sources :
- Banque mondiale | Économie et croissance (1976–2025, mis à jour en octobre 2026)
- TradeMap (2001–2025, mis à jour en octobre 2026)
Creative Commons Attribution (CC BY) : vous pouvez copier, partager, adapter et réutiliser ce contenu, y compris à des fins commerciales, à condition de citer statistics.wiki et d’indiquer les modifications apportées. Les sources citées ci-dessus peuvent avoir leurs propres conditions de licence.