
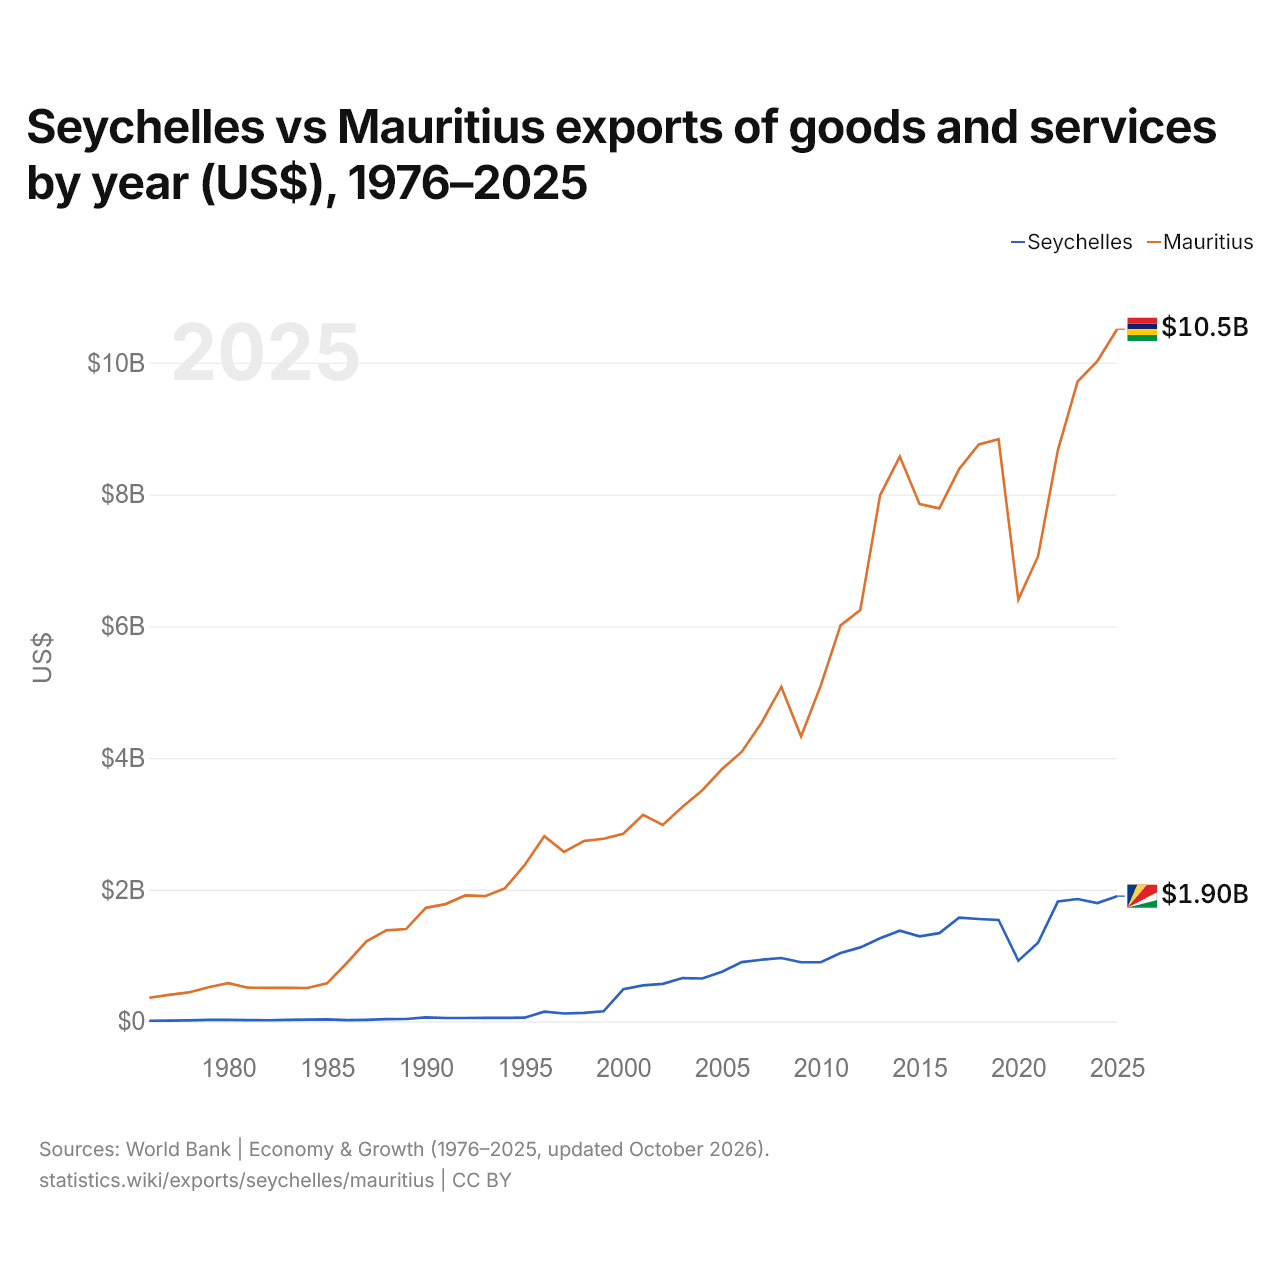
Seychelles vs Maurice : exportations de biens et services par année ($ US), 1976–2025
| Année | $ US | |
|---|---|---|
 Seychelles |
 Maurice |
|
| 2025 | 1 900 518 395 $ US | 10 508 453 742 $ US |
| 2024 | 1 795 765 733 $ US | 10 025 062 117 $ US |
| 2023 | 1 856 806 848 $ US | 9 715 616 542 $ US |
| 2022 | 1 818 966 306 $ US | 8 671 207 275 $ US |
| 2021 | 1 193 663 263 $ US | 7 062 411 511 $ US |
| 2020 | 920 042 422 $ US | 6 403 116 604 $ US |
| 2019 | 1 538 983 436 $ US | 8 837 804 270 $ US |
| 2018 | 1 553 145 430 $ US | 8 760 255 080 $ US |
| 2017 | 1 573 333 403 $ US | 8 385 997 463 $ US |
| 2016 | 1 338 730 180 $ US | 7 788 248 023 $ US |
| 2015 | 1 290 375 235 $ US | 7 852 564 560 $ US |
| 2014 | 1 376 210 127 $ US | 8 575 510 562 $ US |
| 2013 | 1 262 543 323 $ US | 7 987 464 268 $ US |
| 2012 | 1 122 604 568 $ US | 6 245 529 946 $ US |
| 2011 | 1 037 324 780 $ US | 6 011 123 130 $ US |
| 2010 | 896 873 106 $ US | 5 100 895 259 $ US |
| 2009 | 896 738 913 $ US | 4 325 246 090 $ US |
| 2008 | 961 331 923 $ US | 5 077 630 569 $ US |
| 2007 | 935 575 118 $ US | 4 534 954 334 $ US |
| 2006 | 898 472 650 $ US | 4 094 163 167 $ US |
| 2005 | 754 034 109 $ US | 3 829 946 692 $ US |
| 2004 | 650 842 527 $ US | 3 508 043 725 $ US |
| 2003 | 657 204 442 $ US | 3 257 695 158 $ US |
| 2002 | 569 063 799 $ US | 2 982 651 358 $ US |
| 2001 | 546 294 060 $ US | 3 136 674 473 $ US |
| 2000 | 486 226 808 $ US | 2 849 019 401 $ US |
| 1999 | 152 013 308 $ US | 2 771 402 053 $ US |
| 1998 | 128 162 616 $ US | 2 738 797 090 $ US |
| 1997 | 118 656 888 $ US | 2 573 649 428 $ US |
| 1996 | 146 186 060 $ US | 2 811 723 402 $ US |
| 1995 | 55 776 980 $ US | 2 369 967 141 $ US |
| 1994 | 52 986 352 $ US | 2 018 277 243 $ US |
| 1993 | 53 589 237 $ US | 1 900 665 939 $ US |
| 1992 | 50 252 836 $ US | 1 912 137 909 $ US |
| 1991 | 51 160 208 $ US | 1 779 993 085 $ US |
| 1990 | 59 192 935 $ US | 1 723 622 086 $ US |
| 1989 | 35 914 016 $ US | 1 400 873 863 $ US |
| 1988 | 33 344 241 $ US | 1 381 558 262 $ US |
| 1987 | 23 213 176 $ US | 1 214 376 183 $ US |
| 1986 | 19 278 076 $ US | 885 094 544 $ US |
| 1985 | 29 326 495 $ US | 576 008 405 $ US |
| 1984 | 26 935 625 $ US | 506 437 055 $ US |
| 1983 | 21 248 692 $ US | 508 533 939 $ US |
| 1982 | 15 986 241 $ US | 508 528 358 $ US |
| 1981 | 17 859 602 $ US | 510 935 885 $ US |
| 1980 | 22 163 209 $ US | 579 103 449 $ US |
| 1979 | 21 890 204 $ US | 516 795 210 $ US |
| 1978 | 15 164 545 $ US | 438 890 038 $ US |
| 1977 | 11 089 069 $ US | 401 979 142 $ US |
| 1976 | 8 673 004 $ US | 357 403 437 $ US |
En 2025, les exportations de biens et services des Seychelles s'élevaient à 1,9 milliard de dollars et celles de Maurice à 10,5 milliards de dollars : celles de Maurice étaient 5,5 fois plus élevées. En 1976, les exportations de Maurice étaient 41 fois plus élevées : 8,67 millions de dollars pour les Seychelles et 357 millions de dollars pour Maurice.
Les exportations de biens et services de Maurice sont supérieures à celles des Seychelles chaque année depuis 1976.
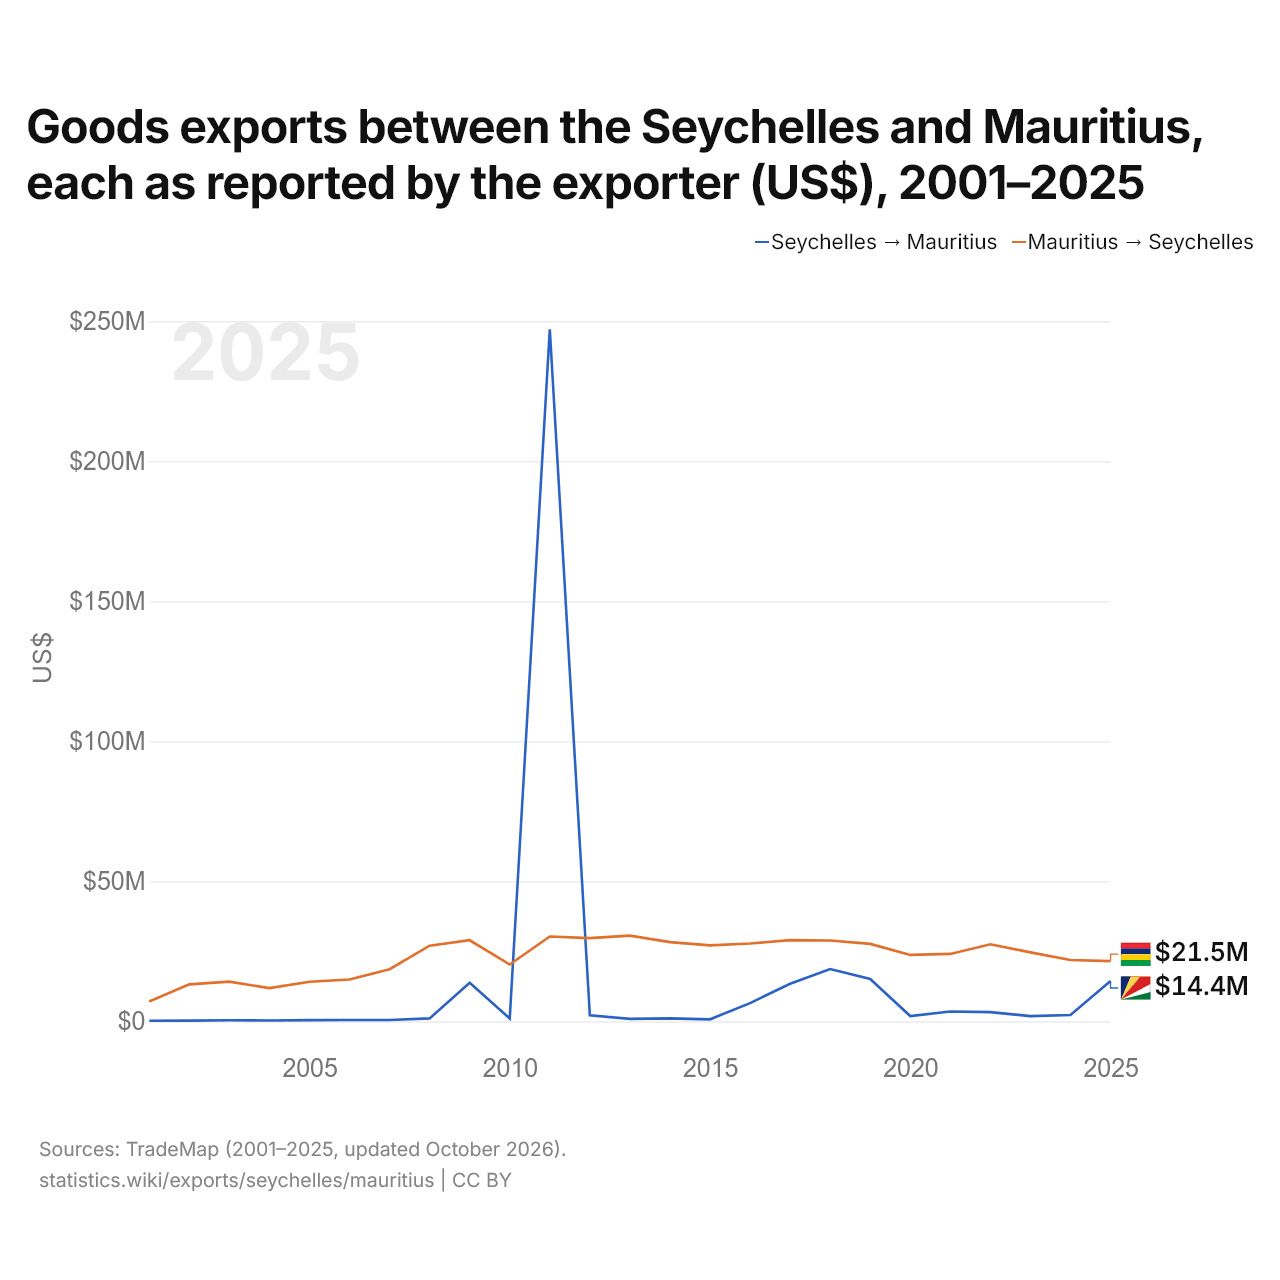
Exportations de biens entre les Seychelles et Maurice, selon chaque exportateur ($ US), 2001–2025
| Année | $ US | |
|---|---|---|
| Seychelles → Maurice | Maurice → Seychelles | |
| 2025 | 14 402 000 $ US | 21 481 000 $ US |
| 2024 | 2 245 000 $ US | 21 885 000 $ US |
| 2023 | 1 874 000 $ US | 24 632 000 $ US |
| 2022 | 3 309 000 $ US | 27 514 000 $ US |
| 2021 | 3 511 000 $ US | 24 065 000 $ US |
| 2020 | 1 875 000 $ US | 23 711 000 $ US |
| 2019 | 15 122 000 $ US | 27 652 000 $ US |
| 2018 | 18 660 000 $ US | 28 869 000 $ US |
| 2017 | 13 436 000 $ US | 29 015 000 $ US |
| 2016 | 6 497 000 $ US | 27 776 000 $ US |
| 2015 | 724 000 $ US | 27 112 000 $ US |
| 2014 | 1 054 000 $ US | 28 268 000 $ US |
| 2013 | 900 000 $ US | 30 589 000 $ US |
| 2012 | 2 147 000 $ US | 29 713 000 $ US |
| 2011 | 247 082 000 $ US | 30 287 000 $ US |
| 2010 | 1 033 000 $ US | 20 284 000 $ US |
| 2009 | 13 749 000 $ US | 28 949 000 $ US |
| 2008 | 1 043 000 $ US | 26 999 000 $ US |
| 2007 | 488 000 $ US | 18 582 000 $ US |
| 2006 | 488 000 $ US | 14 930 000 $ US |
| 2005 | 441 000 $ US | 14 139 000 $ US |
| 2004 | 298 000 $ US | 11 840 000 $ US |
| 2003 | 385 000 $ US | 14 148 000 $ US |
| 2002 | 232 000 $ US | 13 206 000 $ US |
| 2001 | 206 000 $ US | 7 057 000 $ US |
En 2025, les exportations de biens des Seychelles vers Maurice, selon les Seychelles, s'élevaient à 14,4 millions de dollars, et celles de Maurice vers les Seychelles, selon Maurice, à 21,5 millions de dollars : 49 % de plus pour celles de Maurice. En 2001, elles s'élevaient à 206 000 dollars pour les Seychelles et à 7,06 millions de dollars pour Maurice.
Seychelles vs Maurice : chiffres des exportations
|
Seychelles
|
Maurice
|
|
|---|---|---|
| Exportations | 1,90 Md $US (2025) | 10,5 Md $US (2025) |
| Rang mondial | 151/176 | 112/176 |
| Part mondiale | 0,005 % | 0,03 % |
| % du PIB | 79,6 % | 65,0 % |
| Première catégorie de biens | Aliments transformés, huiles, aliments pour animaux, boissons et tabac (45 %, 2025) | Aliments transformés, huiles, aliments pour animaux, boissons et tabac (32 %, 2025) |
| Première destination des biens | Émirats arabes unis (32 %, 2025) | France (13,3 %, 2025) |
Comparer les exportations de 2 pays au choix
Sources :
- Banque mondiale | Économie et croissance (1976–2025, mis à jour en octobre 2026)
- TradeMap (2001–2025, mis à jour en octobre 2026)
Creative Commons Attribution (CC BY) : vous pouvez copier, partager, adapter et réutiliser ce contenu, y compris à des fins commerciales, à condition de citer statistics.wiki et d’indiquer les modifications apportées. Les sources citées ci-dessus peuvent avoir leurs propres conditions de licence.