
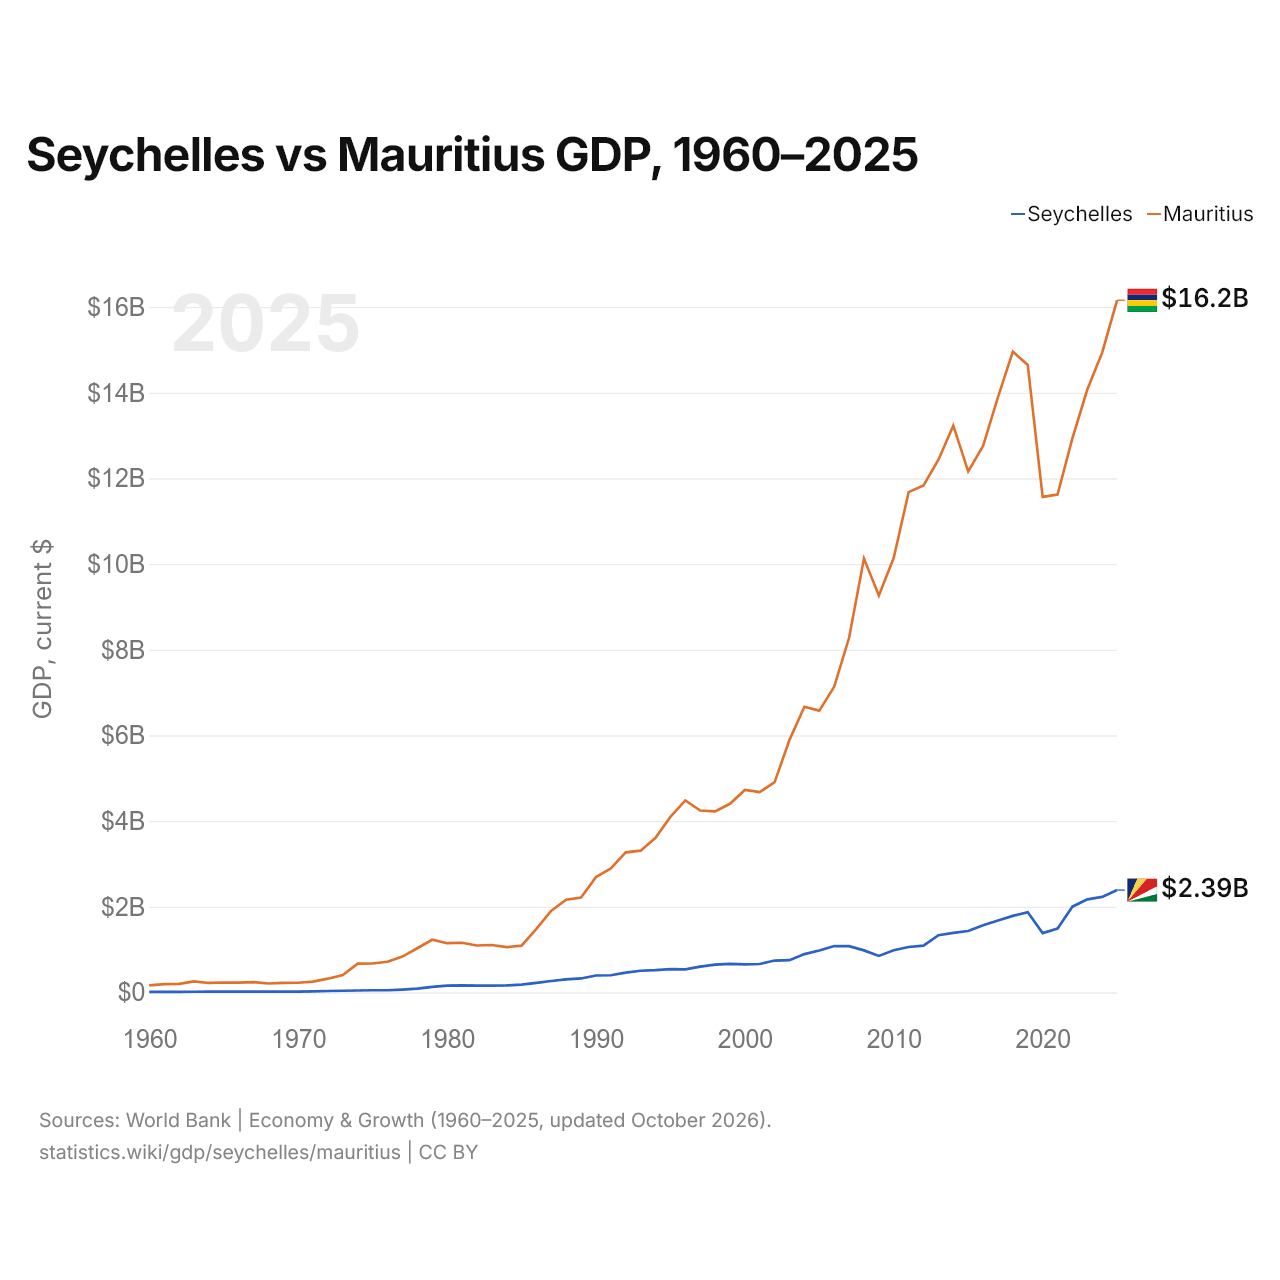
Seychelles vs Maurice : PIB, 1960–2025
| Année | PIB, dollars US courants | |
|---|---|---|
 Seychelles |
 Maurice |
|
| 2025 | 2 387 022 853 $ US | 16 157 804 492 $ US |
| 2024 | 2 228 608 684 $ US | 14 938 055 690 $ US |
| 2023 | 2 171 547 935 $ US | 14 072 212 290 $ US |
| 2022 | 1 999 888 599 $ US | 12 936 444 123 $ US |
| 2021 | 1 487 173 795 $ US | 11 622 048 697 $ US |
| 2020 | 1 382 551 752 $ US | 11 566 111 138 $ US |
| 2019 | 1 868 690 097 $ US | 14 645 235 205 $ US |
| 2018 | 1 784 313 927 $ US | 14 957 535 716 $ US |
| 2017 | 1 675 370 641 $ US | 13 896 938 315 $ US |
| 2016 | 1 568 513 348 $ US | 12 757 680 847 $ US |
| 2015 | 1 432 403 352 $ US | 12 162 211 503 $ US |
| 2014 | 1 387 577 870 $ US | 13 230 490 082 $ US |
| 2013 | 1 333 160 407 $ US | 12 434 596 541 $ US |
| 2012 | 1 089 407 839 $ US | 11 832 323 837 $ US |
| 2011 | 1 058 918 707 $ US | 11 677 718 382 $ US |
| 2010 | 981 616 542 $ US | 10 144 716 155 $ US |
| 2009 | 850 901 620 $ US | 9 264 482 256 $ US |
| 2008 | 979 597 394 $ US | 10 127 741 915 $ US |
| 2007 | 1 077 308 814 $ US | 8 277 474 850 $ US |
| 2006 | 1 081 441 283 $ US | 7 137 710 413 $ US |
| 2005 | 977 899 382 $ US | 6 576 108 447 $ US |
| 2004 | 893 012 218 $ US | 6 667 418 752 $ US |
| 2003 | 750 847 230 $ US | 5 894 873 920 $ US |
| 2002 | 742 134 838 $ US | 4 906 494 249 $ US |
| 2001 | 662 064 156 $ US | 4 675 755 867 $ US |
| 2000 | 654 212 394 $ US | 4 726 108 622 $ US |
| 1999 | 662 838 615 $ US | 4 402 193 195 $ US |
| 1998 | 647 287 376 $ US | 4 225 813 976 $ US |
| 1997 | 598 966 982 $ US | 4 243 755 308 $ US |
| 1996 | 535 250 347 $ US | 4 481 489 762 $ US |
| 1995 | 540 733 048 $ US | 4 094 741 652 $ US |
| 1994 | 517 570 058 $ US | 3 606 050 873 $ US |
| 1993 | 504 230 621 $ US | 3 307 302 126 $ US |
| 1992 | 461 409 399 $ US | 3 267 677 814 $ US |
| 1991 | 398 307 170 $ US | 2 895 354 736 $ US |
| 1990 | 392 163 561 $ US | 2 689 212 760 $ US |
| 1989 | 324 333 367 $ US | 2 211 312 823 $ US |
| 1988 | 301 985 618 $ US | 2 163 252 449 $ US |
| 1987 | 265 212 957 $ US | 1 906 174 438 $ US |
| 1986 | 221 147 061 $ US | 1 482 601 552 $ US |
| 1985 | 179 691 483 $ US | 1 090 611 325 $ US |
| 1984 | 160 992 921 $ US | 1 054 564 759 $ US |
| 1983 | 156 098 237 $ US | 1 104 956 573 $ US |
| 1982 | 157 211 790 $ US | 1 092 923 636 $ US |
| 1981 | 163 750 728 $ US | 1 157 769 444 $ US |
| 1980 | 156 783 830 $ US | 1 147 027 924 $ US |
| 1979 | 127 261 099 $ US | 1 227 446 632 $ US |
| 1978 | 85 552 366 $ US | 1 029 040 323 $ US |
| 1977 | 64 526 401 $ US | 834 722 972 $ US |
| 1976 | 49 278 982 $ US | 713 510 052 $ US |
| 1975 | 47 803 146 $ US | 673 311 287 $ US |
| 1974 | 43 134 496 $ US | 669 894 030 $ US |
| 1973 | 36 896 280 $ US | 404 285 775 $ US |
| 1972 | 30 645 123 $ US | 318 664 900 $ US |
| 1971 | 21 965 951 $ US | 251 437 338 $ US |
| 1970 | 18 432 032 $ US | 224 125 805 $ US |
| 1969 | 16 452 028 $ US | 221 553 613 $ US |
| 1968 | 16 074 028 $ US | 206 576 631 $ US |
| 1967 | 16 632 032 $ US | 238 439 291 $ US |
| 1966 | 16 443 034 $ US | 227 534 083 $ US |
| 1965 | 15 603 032 $ US | 230 024 161 $ US |
| 1964 | 15 393 032 $ US | 218 914 569 $ US |
| 1963 | 13 923 029 $ US | 253 839 558 $ US |
| 1962 | 12 642 026 $ US | 197 738 208 $ US |
| 1961 | 11 592 024 $ US | 191 757 729 $ US |
| 1960 | 12 012 025 $ US | 162 089 564 $ US |
En 2025, le PIB de Maurice (16,2 milliards de dollars US) était 6,8 fois celui des Seychelles (2,39 milliards de dollars US). En 2015, le rapport était de 8,5. De 2015 à 2025, à prix constants de 2015, le PIB de Maurice a progressé de 25,9 % et celui des Seychelles de 48,9 %.
Depuis 1960, le PIB de Maurice a chaque année été le plus élevé des deux ; en 1960, il était 13 fois celui des Seychelles. En 2025, le PIB par habitant était de 19 449 $ US aux Seychelles et de 12 991 $ US à Maurice, soit 50 % de plus aux Seychelles.
Seychelles vs Maurice : derniers chiffres du PIB
|
Seychelles
|
Maurice
|
|
|---|---|---|
| PIB, dollars US courants | 2,39 Md $US | 16,2 Md $US |
| Rang mondial | 177/197 | 144/197 |
| Part mondiale | 0,002 % | 0,01 % |
| PIB, dollars US constants de 2015 | 2,13 Md $US | 15,3 Md $US |
| Écart de PIB | 0,15× | 6,8× |
Comparer le PIB de 2 pays au choix
Sources :
- Banque mondiale | Économie et croissance (1960–2025, mis à jour en octobre 2026)
Creative Commons Attribution (CC BY) : vous pouvez copier, partager, adapter et réutiliser ce contenu, y compris à des fins commerciales, à condition de citer statistics.wiki et d’indiquer les modifications apportées. Les sources citées ci-dessus peuvent avoir leurs propres conditions de licence.