
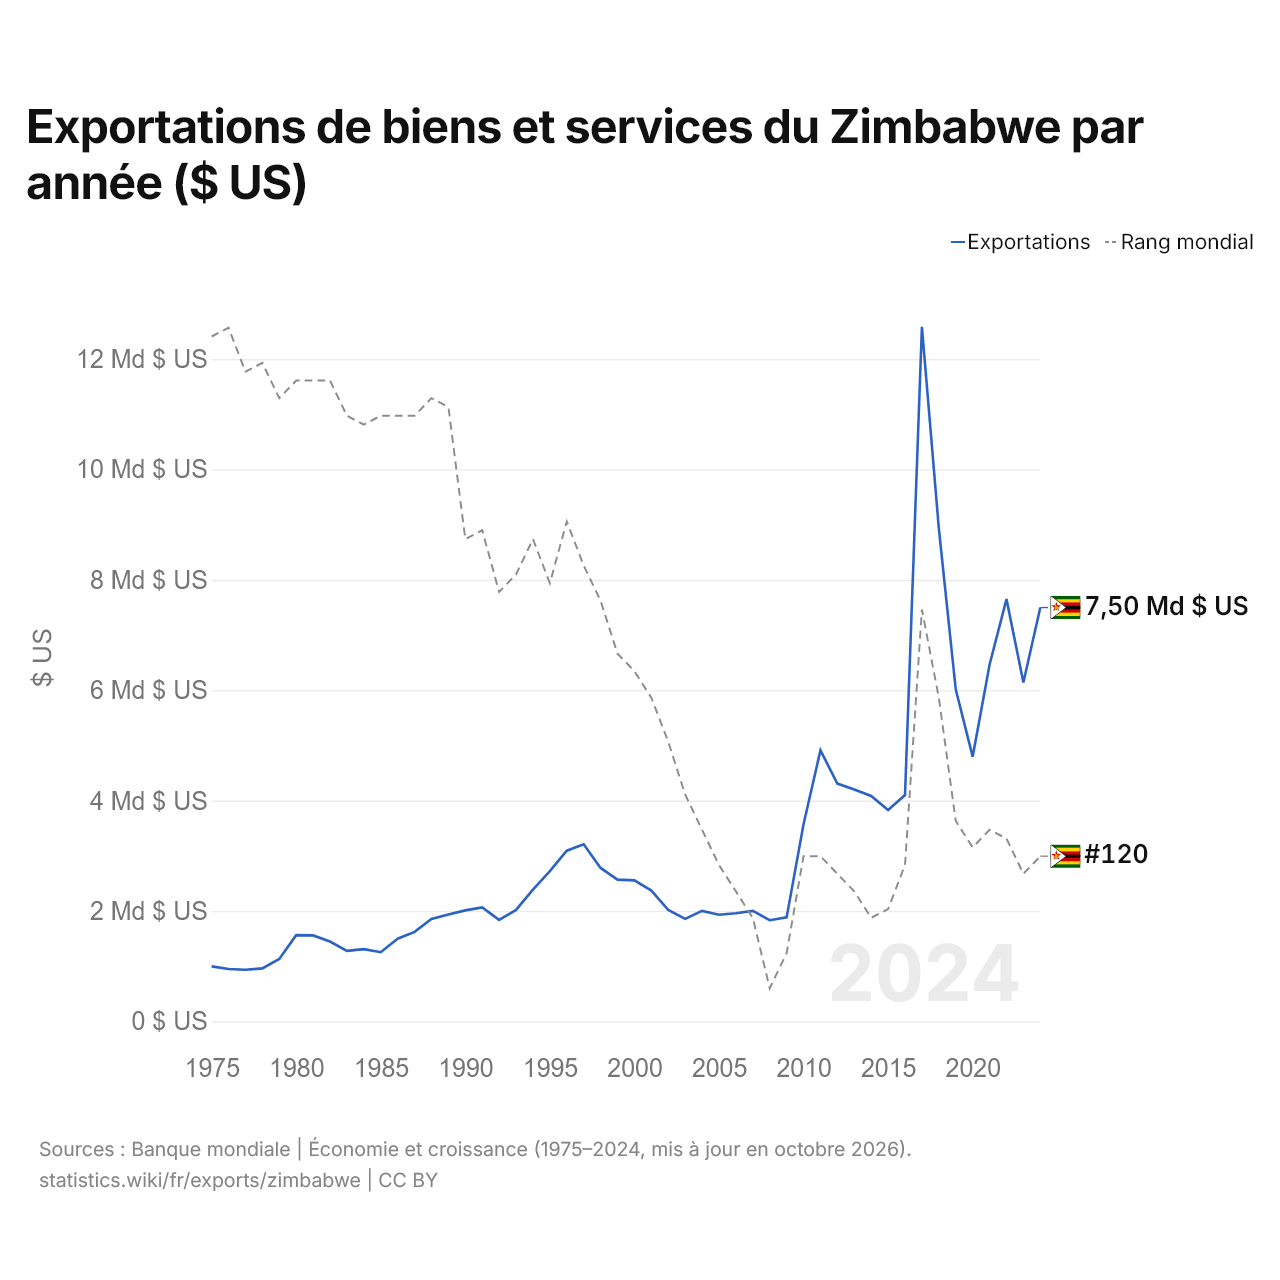
Exportations de biens et services du Zimbabwe par année ($ US)
| Année | $ US | Rang mondial |
|---|---|---|
| Exportations | Rang mondial | |
| 2024 | 7 497 382 806 $ US | #120 |
| 2023 | 6 140 200 070 $ US | #122 |
| 2022 | 7 650 412 329 $ US | #118 |
| 2021 | 6 461 646 332 $ US | #117 |
| 2020 | 4 795 084 587 $ US | #119 |
| 2019 | 6 016 225 251 $ US | #116 |
| 2018 | 8 932 843 137 $ US | #102 |
| 2017 | 12 584 462 151 $ US | #92 |
| 2016 | 4 100 250 000 $ US | #121 |
| 2015 | 3 827 000 000 $ US | #126 |
| 2014 | 4 082 500 000 $ US | #127 |
| 2013 | 4 199 750 000 $ US | #124 |
| 2012 | 4 308 750 000 $ US | #122 |
| 2011 | 4 910 000 000 $ US | #120 |
| 2010 | 3 571 000 000 $ US | #120 |
| 2009 | 1 883 500 000 $ US | #131 |
| 2008 | 1 832 000 000 $ US | #135 |
| 2007 | 2 000 500 000 $ US | #127 |
| 2006 | 1 958 500 000 $ US | #124 |
| 2005 | 1 931 750 000 $ US | #121 |
| 2004 | 2 002 250 000 $ US | #117 |
| 2003 | 1 856 500 000 $ US | #113 |
| 2002 | 2 020 000 000 $ US | #107 |
| 2001 | 2 370 500 000 $ US | #102 |
| 2000 | 2 554 250 000 $ US | #99 |
| 1999 | 2 566 750 000 $ US | #97 |
| 1998 | 2 779 500 000 $ US | #91 |
| 1997 | 3 208 250 000 $ US | #87 |
| 1996 | 3 091 750 000 $ US | #82 |
| 1995 | 2 720 500 000 $ US | #89 |
| 1994 | 2 385 500 000 $ US | #84 |
| 1993 | 2 017 500 000 $ US | #88 |
| 1992 | 1 839 250 000 $ US | #90 |
| 1991 | 2 065 000 000 $ US | #83 |
| 1990 | 2 009 607 343 $ US | #84 |
| 1989 | 1 935 204 474 $ US | #69 |
| 1988 | 1 856 204 058 $ US | #68 |
| 1987 | 1 619 777 305 $ US | #70 |
| 1986 | 1 496 041 260 $ US | #70 |
| 1985 | 1 252 436 243 $ US | #70 |
| 1984 | 1 306 736 254 $ US | #71 |
| 1983 | 1 277 291 527 $ US | #70 |
| 1982 | 1 446 131 890 $ US | #66 |
| 1981 | 1 557 022 080 $ US | #66 |
| 1980 | 1 561 474 151 $ US | #66 |
| 1979 | 1 129 262 585 $ US | #68 |
| 1978 | 958 785 487 $ US | #64 |
| 1977 | 934 237 560 $ US | #65 |
| 1976 | 948 809 396 $ US | #60 |
| 1975 | 995 633 792 $ US | #61 |
Les exportations de biens et services du Zimbabwe s'élèvent à 7,5 milliards de dollars (2024), contre 996 millions de dollars en 1975. Le maximum a été de 12,6 milliards de dollars, en 2017. Elles se classent au 120e rang mondial, en hausse par rapport au 122e rang l'année précédente. Leur meilleur rang a été le 60e, occupé pour la dernière fois en 1976.
Les exportations de biens et services du Zimbabwe sont les 24es plus élevées de 50 pays situés en Afrique. Les importations de biens et services du Zimbabwe s'élèvent à 9,74 milliards de dollars (2024), au 119e rang mondial. Les importations du Zimbabwe dépassent ses exportations de 2,24 milliards de dollars, soit un déficit commercial (2024).
Exportations de biens du Zimbabwe par catégorie, 2025
Exportations de biens, 2025: 9,71 Md $US
En 2025, la première catégorie des exportations de biens du Zimbabwe était « métaux précieux, pierres précieuses, bijoux, montres, instruments de musique et art », avec 49,9 %, suivie de « métaux communs (fer, acier, cuivre, aluminium) », avec 19,6 %.
Destinations des exportations de biens du Zimbabwe : les 10 premières, 2025
| Rang | Pays | Exportations de biens | Part | |
|---|---|---|---|---|
| 1 |
 EAU |
4,73 Md $US | 48,7 % | |
| 2 |
 Afrique du Sud |
2,20 Md $US | 22,7 % | |
| 3 |
 Chine |
1,36 Md $US | 14 % | |
| 4 |
 Mozambique |
266 M $US | 2,74 % | vs Mozambique |
| 5 |
 Belgique |
148 M $US | 1,52 % | |
| 6 |
 Zambie |
131 M $US | 1,35 % | vs Zambie |
| 7 |
 Indonésie |
102 M $US | 1,05 % | |
| 8 |
 Pays-Bas |
68,4 M $US | 0,7 % | |
| 9 |
 États-Unis |
51,6 M $US | 0,53 % | |
| 10 |
 Vietnam |
47,3 M $US | 0,49 % | |
| Autres partenaires et non précisés | 601 M $US | 6,19 % |
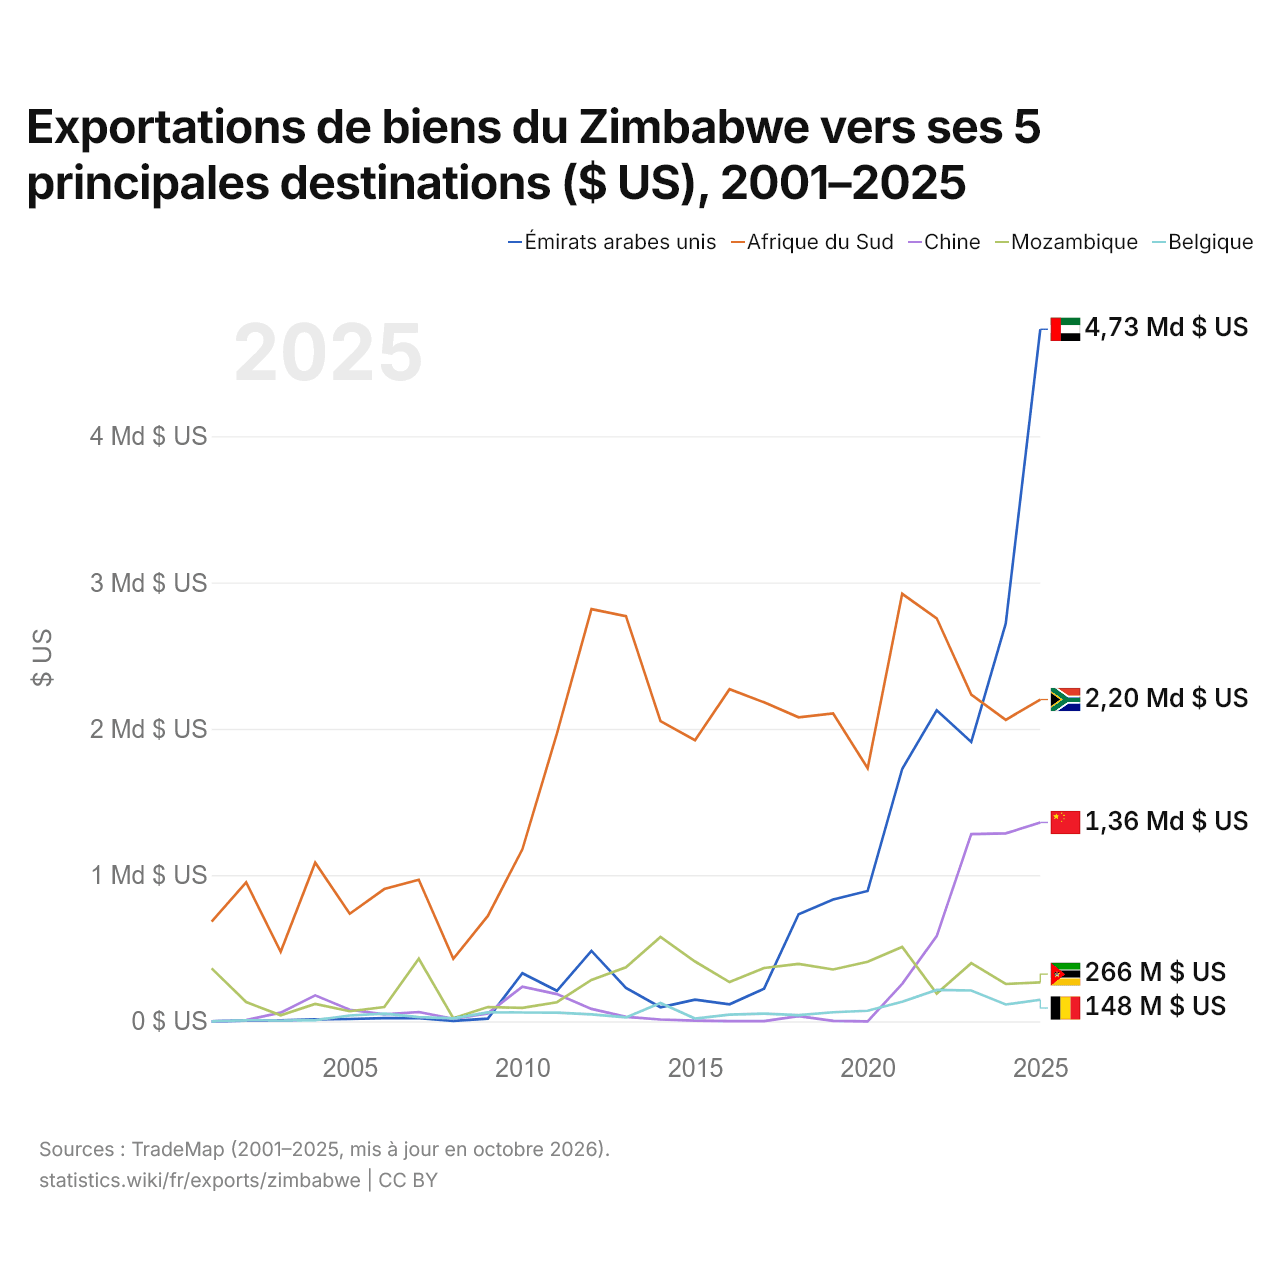
Exportations de biens du Zimbabwe vers ses 5 principales destinations ($ US), 2001–2025
| Année | $ US | ||||
|---|---|---|---|---|---|
| Émirats arabes unis | Afrique du Sud | Chine | Mozambique | Belgique | |
| 2025 | 4 731 598 000 $ US | 2 200 022 000 $ US | 1 359 568 000 $ US | 266 221 000 $ US | 147 608 000 $ US |
| 2024 | 2 720 056 000 $ US | 2 061 336 000 $ US | 1 285 022 000 $ US | 255 101 000 $ US | 115 112 000 $ US |
| 2023 | 1 910 079 000 $ US | 2 233 272 000 $ US | 1 280 340 000 $ US | 397 698 000 $ US | 210 744 000 $ US |
| 2022 | 2 126 190 000 $ US | 2 755 680 000 $ US | 582 815 000 $ US | 190 353 000 $ US | 214 942 000 $ US |
| 2021 | 1 725 323 000 $ US | 2 923 055 000 $ US | 256 069 000 $ US | 508 641 000 $ US | 134 109 000 $ US |
| 2020 | 891 193 000 $ US | 1 730 476 000 $ US | 42 000 $ US | 407 516 000 $ US | 72 518 000 $ US |
| 2019 | 832 896 000 $ US | 2 104 516 000 $ US | 3 247 000 $ US | 354 332 000 $ US | 61 942 000 $ US |
| 2018 | 732 278 000 $ US | 2 078 854 000 $ US | 36 054 000 $ US | 392 202 000 $ US | 42 168 000 $ US |
| 2017 | 223 253 000 $ US | 2 181 039 000 $ US | 960 000 $ US | 364 909 000 $ US | 52 948 000 $ US |
| 2016 | 116 683 000 $ US | 2 270 626 000 $ US | 883 000 $ US | 268 349 000 $ US | 45 698 000 $ US |
| 2015 | 147 956 000 $ US | 1 922 395 000 $ US | 4 436 000 $ US | 408 884 000 $ US | 18 816 000 $ US |
| 2014 | 96 086 000 $ US | 2 052 895 000 $ US | 12 608 000 $ US | 577 419 000 $ US | 125 015 000 $ US |
| 2013 | 229 097 000 $ US | 2 770 083 000 $ US | 30 903 000 $ US | 369 549 000 $ US | 26 661 000 $ US |
| 2012 | 481 906 000 $ US | 2 818 081 000 $ US | 85 042 000 $ US | 283 105 000 $ US | 47 586 000 $ US |
| 2011 | 208 854 000 $ US | 1 966 742 000 $ US | 186 157 000 $ US | 130 590 000 $ US | 60 003 000 $ US |
| 2010 | 329 178 000 $ US | 1 176 231 000 $ US | 237 460 000 $ US | 91 926 000 $ US | 60 447 000 $ US |
| 2009 | 18 167 000 $ US | 721 025 000 $ US | 54 204 000 $ US | 97 711 000 $ US | 61 020 000 $ US |
| 2008 | 3 049 000 $ US | 427 456 000 $ US | 17 219 000 $ US | 21 294 000 $ US | 20 038 000 $ US |
| 2007 | 21 656 000 $ US | 968 024 000 $ US | 63 510 000 $ US | 427 819 000 $ US | 28 438 000 $ US |
| 2006 | 21 812 000 $ US | 904 230 000 $ US | 47 203 000 $ US | 97 553 000 $ US | 52 657 000 $ US |
| 2005 | 16 045 000 $ US | 735 541 000 $ US | 78 735 000 $ US | 68 950 000 $ US | 39 802 000 $ US |
| 2004 | 12 965 000 $ US | 1 085 060 000 $ US | 177 467 000 $ US | 118 595 000 $ US | 7 796 000 $ US |
| 2003 | 6 513 000 $ US | 475 180 000 $ US | 59 355 000 $ US | 40 995 000 $ US | 5 641 000 $ US |
| 2002 | 4 607 000 $ US | 950 630 000 $ US | 8 788 000 $ US | 131 917 000 $ US | 7 466 000 $ US |
| 2001 | 10 000 $ US | 682 061 000 $ US | 222 000 $ US | 362 069 000 $ US | 124 000 $ US |
En 2025, les exportations de biens s'élevaient à 4,73 milliards de dollars vers les Émirats arabes unis, 2,2 milliards de dollars vers l'Afrique du Sud, 1,36 milliard de dollars vers la Chine, 266 millions de dollars vers le Mozambique et 148 millions de dollars vers la Belgique. Le premier rang des cinq destinations du Zimbabwe est occupé par les Émirats arabes unis depuis 2024.
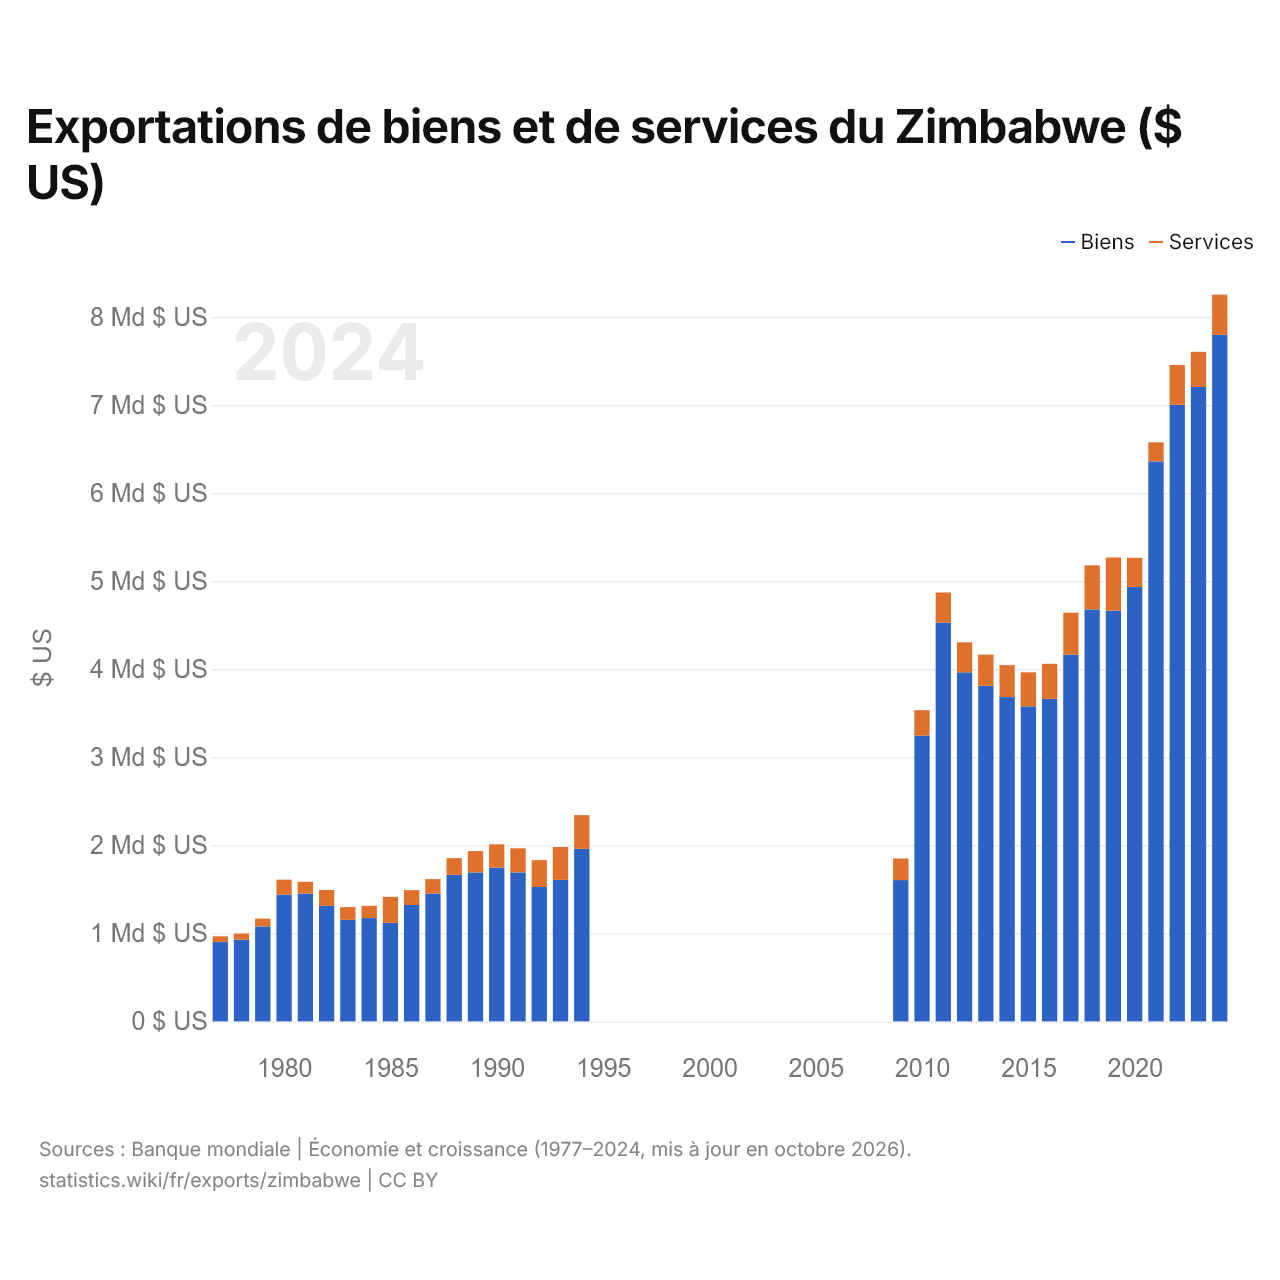
Exportations de biens et de services du Zimbabwe ($ US)
| Année | $ US | |
|---|---|---|
| Biens | Services | |
| 2024 | 7 794 595 145 $ US | 457 117 671 $ US |
| 2023 | 7 203 513 159 $ US | 399 204 775 $ US |
| 2022 | 7 000 207 432 $ US | 453 289 700 $ US |
| 2021 | 6 359 069 737 $ US | 215 734 658 $ US |
| 2020 | 4 931 846 338 $ US | 331 436 383 $ US |
| 2019 | 4 663 676 399 $ US | 603 248 271 $ US |
| 2018 | 4 677 632 739 $ US | 500 521 382 $ US |
| 2017 | 4 163 597 315 $ US | 476 619 318 $ US |
| 2016 | 3 662 938 962 $ US | 396 739 569 $ US |
| 2015 | 3 577 478 216 $ US | 386 683 413 $ US |
| 2014 | 3 682 098 511 $ US | 363 263 541 $ US |
| 2013 | 3 810 276 854 $ US | 353 906 535 $ US |
| 2012 | 3 963 772 579 $ US | 340 855 976 $ US |
| 2011 | 4 527 562 990 $ US | 342 571 467 $ US |
| 2010 | 3 245 065 709 $ US | 288 422 873 $ US |
| 2009 | 1 604 042 164 $ US | 245 526 675 $ US |
| 2008 | - | - |
| 2007 | - | - |
| 2006 | - | - |
| 2005 | - | - |
| 2004 | - | - |
| 2003 | - | - |
| 2002 | - | - |
| 2001 | - | - |
| 2000 | - | - |
| 1999 | - | - |
| 1998 | - | - |
| 1997 | - | - |
| 1996 | - | - |
| 1995 | - | - |
| 1994 | 1 958 829 540 $ US | 382 801 642 $ US |
| 1993 | 1 607 248 556 $ US | 371 673 964 $ US |
| 1992 | 1 525 847 667 $ US | 304 741 553 $ US |
| 1991 | 1 691 876 968 $ US | 273 193 760 $ US |
| 1990 | 1 745 891 811 $ US | 263 898 521 $ US |
| 1989 | 1 691 612 200 $ US | 241 571 361 $ US |
| 1988 | 1 662 965 462 $ US | 190 127 480 $ US |
| 1987 | 1 450 309 696 $ US | 164 446 991 $ US |
| 1986 | 1 321 242 767 $ US | 168 848 723 $ US |
| 1985 | 1 118 285 496 $ US | 295 136 548 $ US |
| 1984 | 1 172 224 374 $ US | 139 243 514 $ US |
| 1983 | 1 152 379 159 $ US | 144 898 776 $ US |
| 1982 | 1 310 635 229 $ US | 181 316 066 $ US |
| 1981 | 1 449 754 195 $ US | 134 001 007 $ US |
| 1980 | 1 439 506 679 $ US | 168 916 168 $ US |
| 1979 | 1 078 623 221 $ US | 88 170 835 $ US |
| 1978 | 926 611 947 $ US | 69 795 974 $ US |
| 1977 | 899 749 804 $ US | 65 176 223 $ US |
Les exportations de biens du Zimbabwe s'élèvent à 7,79 milliards de dollars (2024) et celles de services à 457 millions de dollars ; les services représentent 5,5 % du total, contre 6,8 % en 1977.
Le Zimbabwe dans le classement mondial des exportations
| Rang | Pays | Exportations | Part mondiale | |
|---|---|---|---|---|
| 117 |
 Cuba |
8,77 Md $US (2020) | 0,04 % | |
| 118 |
 Congo-Brazza |
7,83 Md $US (2025) | 0,02 % | |
| 119 |
 Cameroun |
7,71 Md $US (2025) | 0,02 % | |
| 120 |
 Zimbabwe |
7,50 Md $US | 0,02 % | |
| 121 |
 Turkménistan |
7,21 Md $US (2025) | 0,02 % | |
| 122 |
 Namibie |
6,74 Md $US (2025) | 0,02 % | vs Namibie |
| 123 |
 Mali |
6,64 Md $US (2025) | 0,02 % |
Exportations de biens et services du Zimbabwe, % du PIB
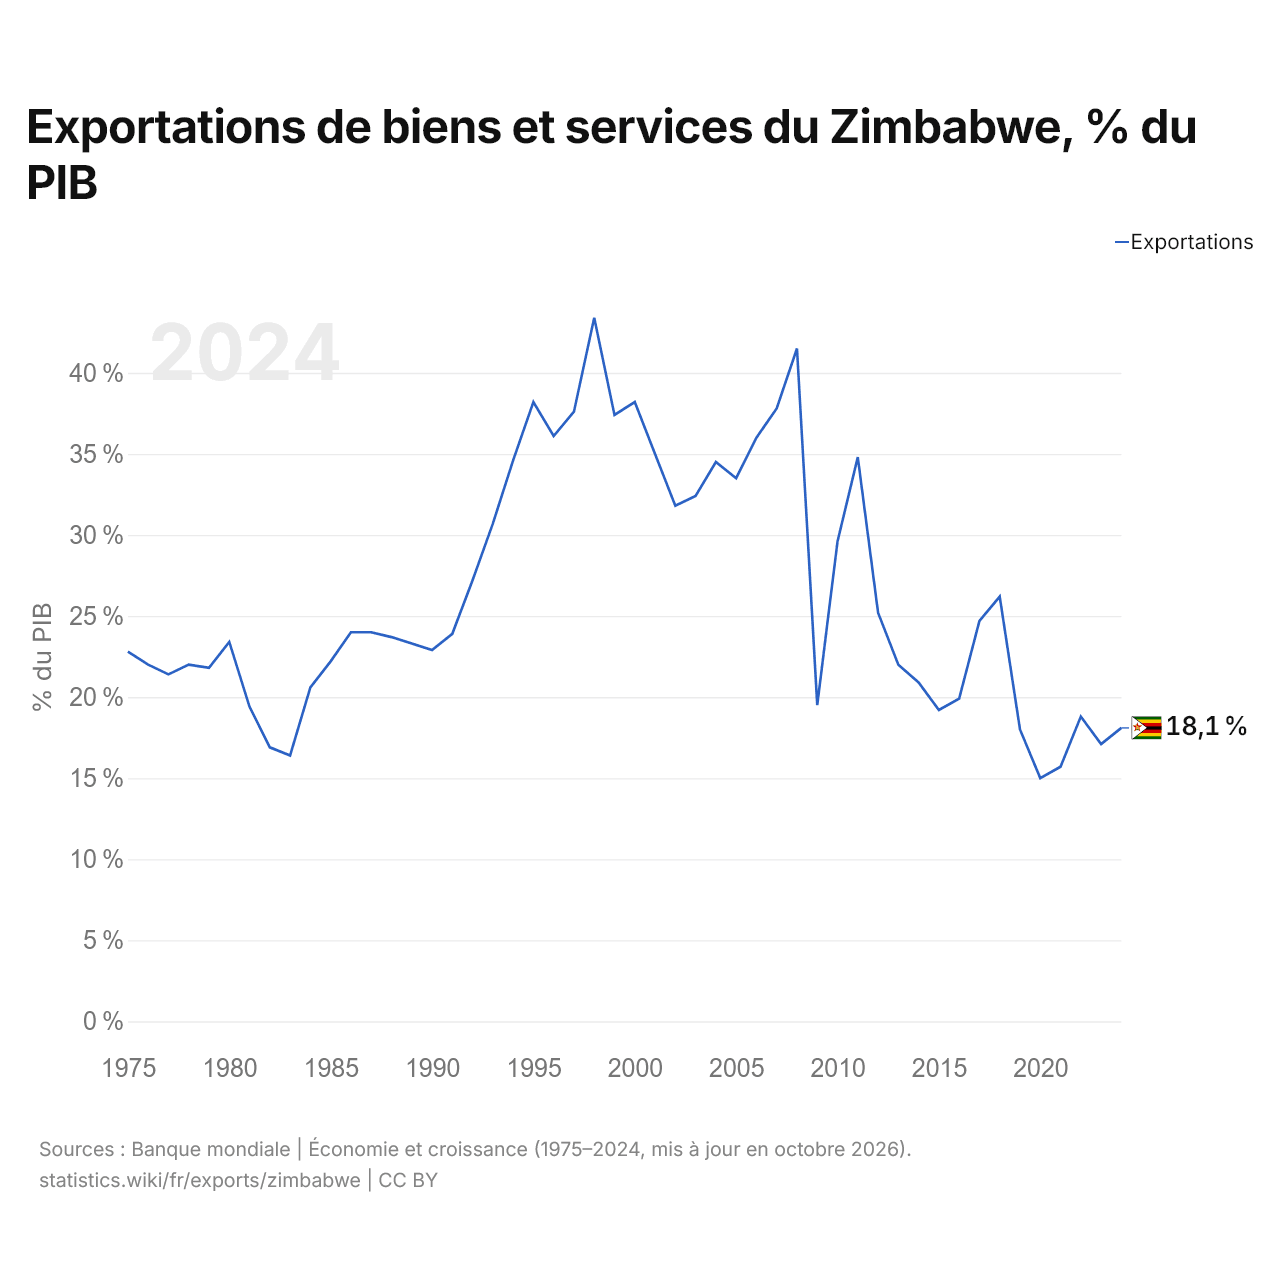
Les exportations de biens et services du Zimbabwe équivalent à 18,1 % de son PIB (2024), contre 22,8 % en 1975. La part la plus élevée a été de 43,4 %, en 1998.
Comparer les exportations du Zimbabwe avec celles d'autres pays
Sources :
- Banque mondiale | Économie et croissance (1975–2025, mis à jour en octobre 2026)
- TradeMap (2001–2025, mis à jour en octobre 2026)
Creative Commons Attribution (CC BY) : vous pouvez copier, partager, adapter et réutiliser ce contenu, y compris à des fins commerciales, à condition de citer statistics.wiki et d’indiquer les modifications apportées. Les sources citées ci-dessus peuvent avoir leurs propres conditions de licence.