
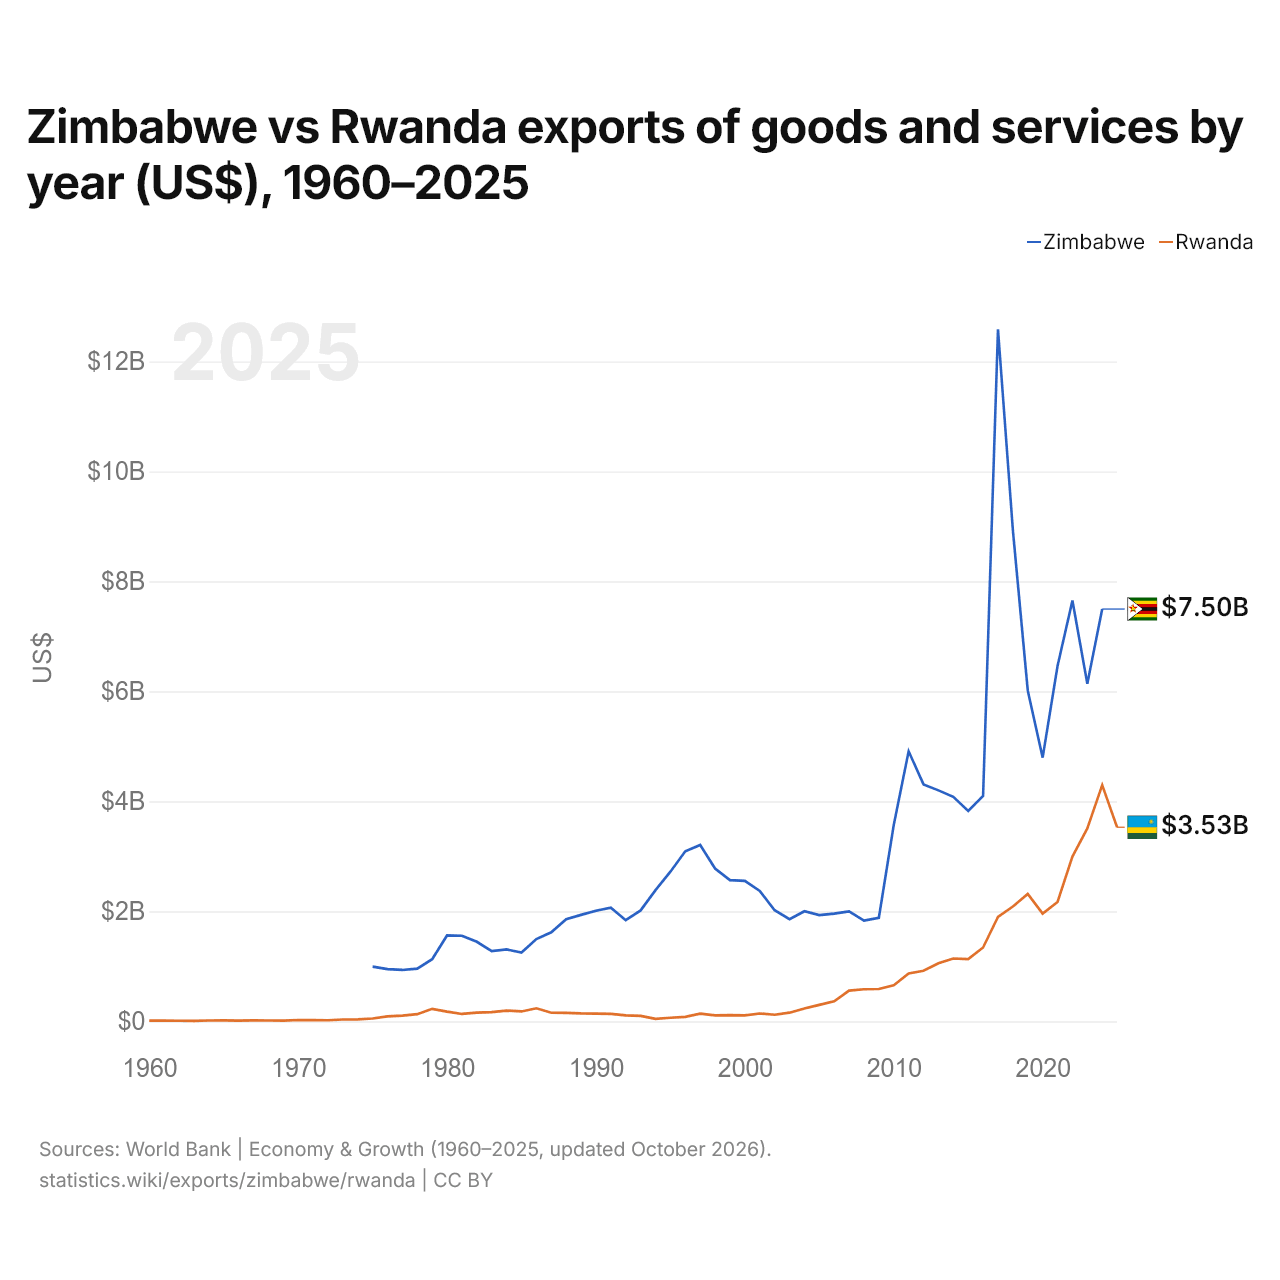
Zimbabwe vs Rwanda : exportations de biens et services par année ($ US), 1960–2025
| Année | $ US | |
|---|---|---|
 Zimbabwe |
 Rwanda |
|
| 2025 | - | 3 528 969 299 $ US |
| 2024 | 7 497 382 806 $ US | 4 294 750 318 $ US |
| 2023 | 6 140 200 070 $ US | 3 509 230 572 $ US |
| 2022 | 7 650 412 329 $ US | 2 996 830 051 $ US |
| 2021 | 6 461 646 332 $ US | 2 170 210 080 $ US |
| 2020 | 4 795 084 587 $ US | 1 957 774 332 $ US |
| 2019 | 6 016 225 251 $ US | 2 317 442 503 $ US |
| 2018 | 8 932 843 137 $ US | 2 087 871 422 $ US |
| 2017 | 12 584 462 151 $ US | 1 900 056 225 $ US |
| 2016 | 4 100 250 000 $ US | 1 342 645 864 $ US |
| 2015 | 3 827 000 000 $ US | 1 130 776 126 $ US |
| 2014 | 4 082 500 000 $ US | 1 142 961 316 $ US |
| 2013 | 4 199 750 000 $ US | 1 054 689 234 $ US |
| 2012 | 4 308 750 000 $ US | 919 753 326 $ US |
| 2011 | 4 910 000 000 $ US | 869 555 802 $ US |
| 2010 | 3 571 000 000 $ US | 656 799 357 $ US |
| 2009 | 1 883 500 000 $ US | 587 737 094 $ US |
| 2008 | 1 832 000 000 $ US | 583 342 339 $ US |
| 2007 | 2 000 500 000 $ US | 557 632 712 $ US |
| 2006 | 1 958 500 000 $ US | 364 321 638 $ US |
| 2005 | 1 931 750 000 $ US | 298 690 721 $ US |
| 2004 | 2 002 250 000 $ US | 234 096 821 $ US |
| 2003 | 1 856 500 000 $ US | 157 307 633 $ US |
| 2002 | 2 020 000 000 $ US | 119 101 755 $ US |
| 2001 | 2 370 500 000 $ US | 143 063 405 $ US |
| 2000 | 2 554 250 000 $ US | 108 794 034 $ US |
| 1999 | 2 566 750 000 $ US | 113 464 512 $ US |
| 1998 | 2 779 500 000 $ US | 107 969 131 $ US |
| 1997 | 3 208 250 000 $ US | 140 296 068 $ US |
| 1996 | 3 091 750 000 $ US | 81 019 757 $ US |
| 1995 | 2 720 500 000 $ US | 64 746 150 $ US |
| 1994 | 2 385 500 000 $ US | 46 157 505 $ US |
| 1993 | 2 017 500 000 $ US | 99 150 552 $ US |
| 1992 | 1 839 250 000 $ US | 109 794 498 $ US |
| 1991 | 2 065 000 000 $ US | 135 915 300 $ US |
| 1990 | 2 009 607 343 $ US | 139 140 330 $ US |
| 1989 | 1 935 204 474 $ US | 143 482 499 $ US |
| 1988 | 1 856 204 058 $ US | 154 093 974 $ US |
| 1987 | 1 619 777 305 $ US | 156 191 819 $ US |
| 1986 | 1 496 041 260 $ US | 237 818 907 $ US |
| 1985 | 1 252 436 243 $ US | 179 764 585 $ US |
| 1984 | 1 306 736 254 $ US | 194 851 744 $ US |
| 1983 | 1 277 291 527 $ US | 166 535 402 $ US |
| 1982 | 1 446 131 890 $ US | 157 982 515 $ US |
| 1981 | 1 557 022 080 $ US | 134 347 627 $ US |
| 1980 | 1 561 474 151 $ US | 176 030 077 $ US |
| 1979 | 1 129 262 585 $ US | 226 881 789 $ US |
| 1978 | 958 785 487 $ US | 130 093 074 $ US |
| 1977 | 934 237 560 $ US | 103 522 584 $ US |
| 1976 | 948 809 396 $ US | 90 352 700 $ US |
| 1975 | 995 633 792 $ US | 50 969 751 $ US |
| 1974 | - | 36 475 779 $ US |
| 1973 | - | 32 769 689 $ US |
| 1972 | - | 19 835 189 $ US |
| 1971 | - | 22 123 838 $ US |
| 1970 | - | 24 585 679 $ US |
| 1969 | - | 14 080 888 $ US |
| 1968 | - | 14 625 077 $ US |
| 1967 | - | 16 299 431 $ US |
| 1966 | - | 13 649 146 $ US |
| 1965 | - | 17 491 788 $ US |
| 1964 | - | 15 159 549 $ US |
| 1963 | - | 7 385 422 $ US |
| 1962 | - | 11 272 486 $ US |
| 1961 | - | 13 604 724 $ US |
| 1960 | - | 14 382 137 $ US |
Les exportations de biens et services du Zimbabwe s'élevaient à 7,5 milliards de dollars (2024) et celles du Rwanda à 4,29 milliards de dollars (2024) : celles du Zimbabwe étaient 1,7 fois plus élevées. En 1975, les exportations du Zimbabwe étaient 20 fois plus élevées : 996 millions de dollars pour le Zimbabwe et 51 millions de dollars pour le Rwanda.
Les exportations de biens et services du Zimbabwe sont supérieures à celles du Rwanda chaque année depuis 1975.
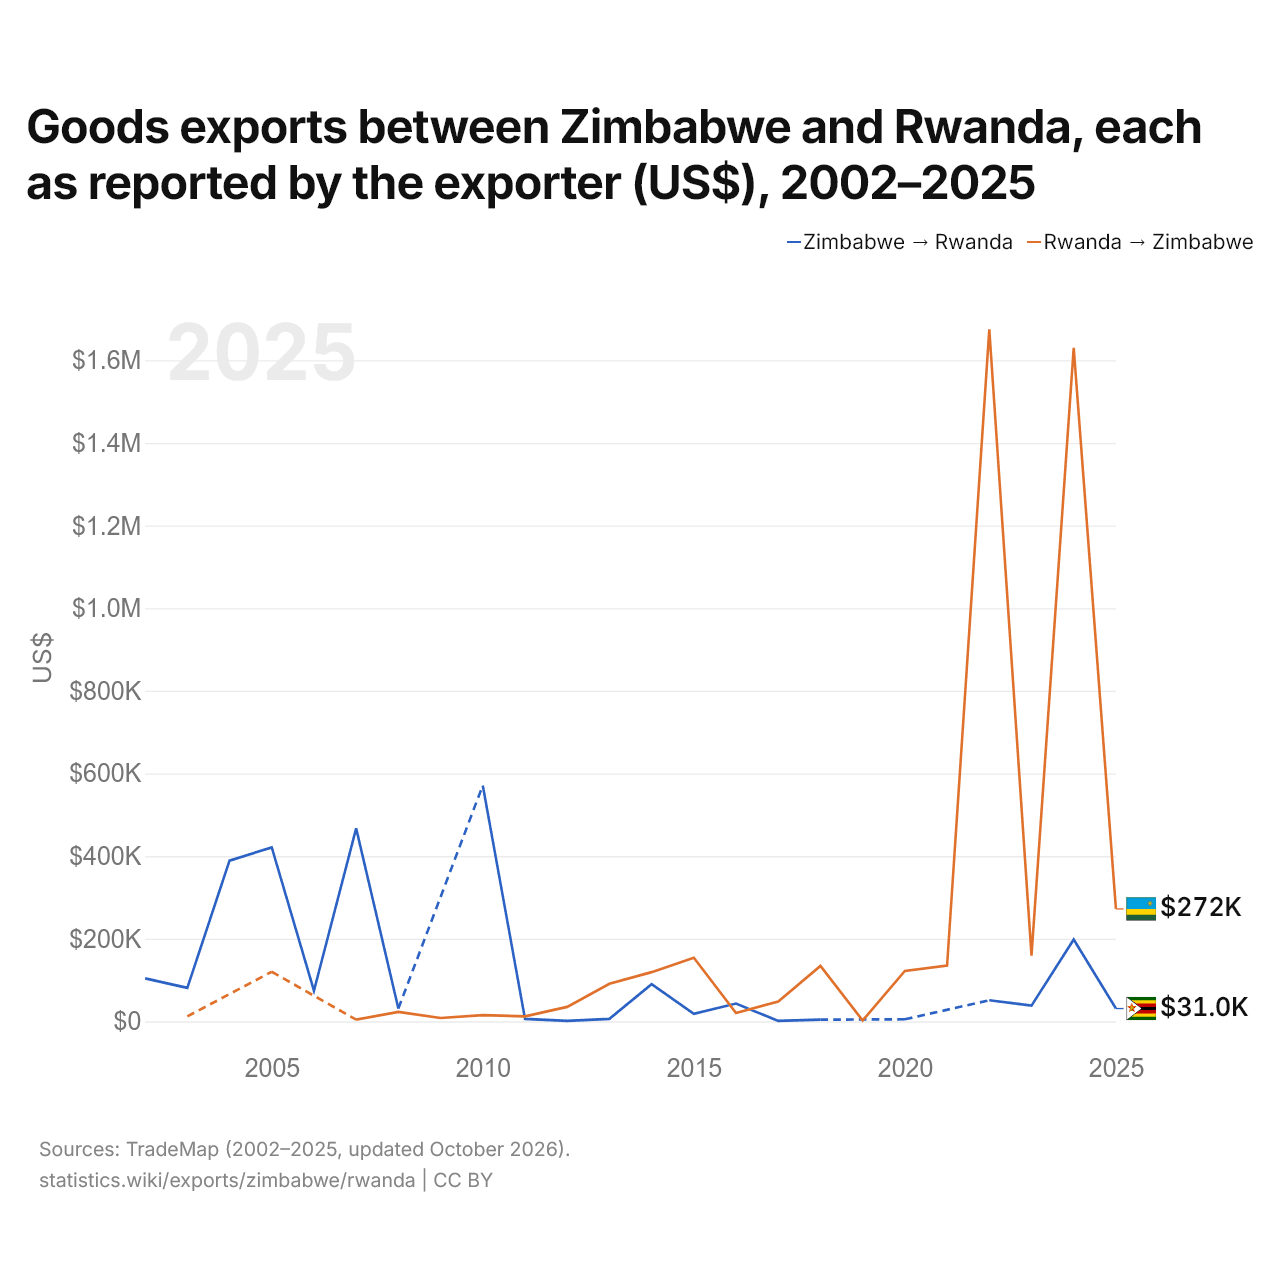
Exportations de biens entre le Zimbabwe et le Rwanda, selon chaque exportateur ($ US), 2002–2025
| Année | $ US | |
|---|---|---|
| Zimbabwe → Rwanda | Rwanda → Zimbabwe | |
| 2025 | 31 000 $ US | 272 000 $ US |
| 2024 | 198 000 $ US | 1 630 000 $ US |
| 2023 | 38 000 $ US | 159 000 $ US |
| 2022 | 51 000 $ US | 1 675 000 $ US |
| 2021 | - | 135 000 $ US |
| 2020 | 5 000 $ US | 122 000 $ US |
| 2019 | - | 2 000 $ US |
| 2018 | 4 000 $ US | 134 000 $ US |
| 2017 | 1 000 $ US | 48 000 $ US |
| 2016 | 43 000 $ US | 20 000 $ US |
| 2015 | 18 000 $ US | 154 000 $ US |
| 2014 | 90 000 $ US | 119 000 $ US |
| 2013 | 6 000 $ US | 91 000 $ US |
| 2012 | 1 000 $ US | 35 000 $ US |
| 2011 | 6 000 $ US | 12 000 $ US |
| 2010 | 571 000 $ US | 15 000 $ US |
| 2009 | - | 8 000 $ US |
| 2008 | 31 000 $ US | 23 000 $ US |
| 2007 | 467 000 $ US | 4 000 $ US |
| 2006 | 74 000 $ US | - |
| 2005 | 421 000 $ US | 120 000 $ US |
| 2004 | 389 000 $ US | - |
| 2003 | 81 000 $ US | 12 000 $ US |
| 2002 | 104 000 $ US | - |
En 2025, les exportations de biens du Zimbabwe vers le Rwanda, selon le Zimbabwe, s'élevaient à 31 000 dollars, et celles du Rwanda vers le Zimbabwe, selon le Rwanda, à 272 000 dollars : 8,8 fois plus pour celles du Rwanda. En 2003, elles s'élevaient à 81 000 dollars pour le Zimbabwe et à 12 000 dollars pour le Rwanda.
Zimbabwe vs Rwanda : chiffres des exportations
|
Zimbabwe
|
Rwanda
|
|
|---|---|---|
| Exportations | 7,50 Md $US (2024) | 3,53 Md $US (2025) |
| Rang mondial | 120/176 | 142/176 |
| Part mondiale | 0,02 % | 0,01 % |
| % du PIB | 18,1 % | 21,6 % |
| Première catégorie de biens | Métaux précieux, pierres précieuses, bijoux, montres, instruments de musique et art (49,9 %, 2025) | Métaux précieux, pierres précieuses, bijoux, montres, instruments de musique et art (23,5 %, 2025) |
| Première destination des biens | Émirats arabes unis (48,7 %, 2025) | République démocratique du Congo (39,5 %, 2025) |
Comparer les exportations de 2 pays au choix
Sources :
- Banque mondiale | Économie et croissance (1960–2025, mis à jour en octobre 2026)
- TradeMap (2002–2025, mis à jour en octobre 2026)
Creative Commons Attribution (CC BY) : vous pouvez copier, partager, adapter et réutiliser ce contenu, y compris à des fins commerciales, à condition de citer statistics.wiki et d’indiquer les modifications apportées. Les sources citées ci-dessus peuvent avoir leurs propres conditions de licence.