
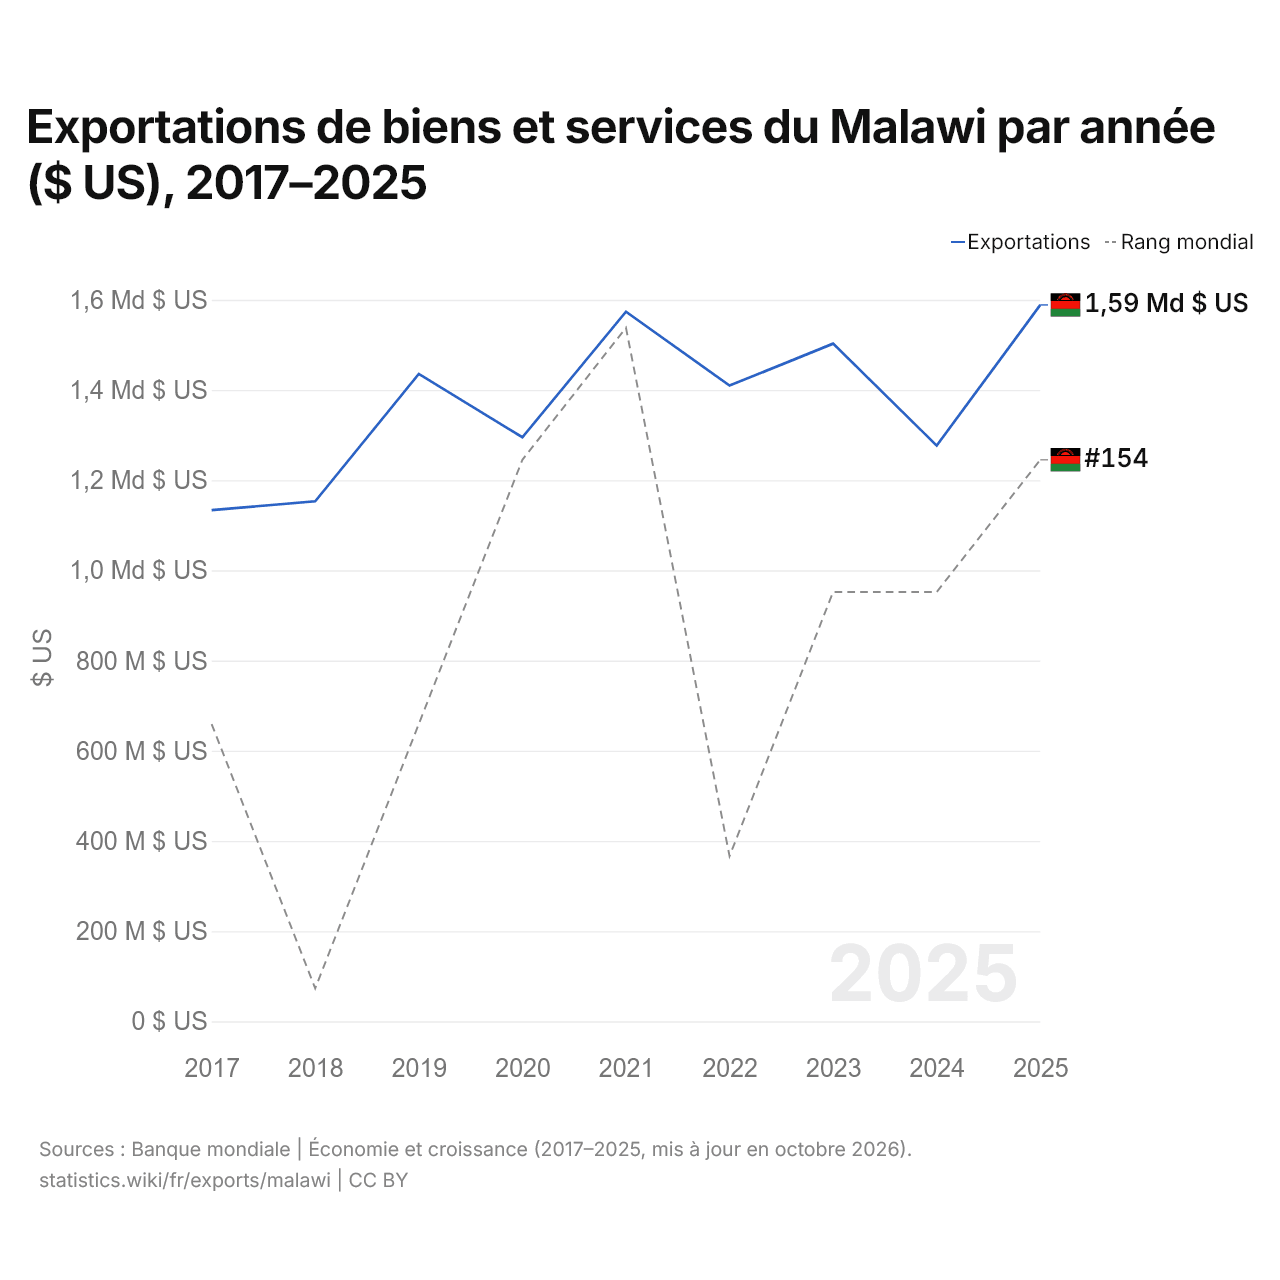
Exportations de biens et services du Malawi par année ($ US), 2017–2025
| Année | $ US | Rang mondial |
|---|---|---|
| Exportations | Rang mondial | |
| 2025 | 1 588 626 336 $ US | #154 |
| 2024 | 1 276 619 389 $ US | #155 |
| 2023 | 1 502 749 518 $ US | #155 |
| 2022 | 1 409 751 313 $ US | #157 |
| 2021 | 1 573 501 118 $ US | #153 |
| 2020 | 1 295 183 976 $ US | #154 |
| 2019 | 1 435 575 611 $ US | #156 |
| 2018 | 1 153 179 791 $ US | #158 |
| 2017 | 1 133 605 606 $ US | #156 |
En 2025, les exportations de biens et services du Malawi s'élevaient à 1,59 milliard de dollars, contre 1,13 milliard de dollars en 2017. Elles se classaient au 154e rang mondial, en hausse par rapport au 155e rang en 2024. Leur meilleur rang a été le 153e, occupé pour la dernière fois en 2021.
En 2025, les exportations de biens et services du Malawi étaient les 40es plus élevées de 50 pays situés en Afrique. Les importations de biens et services du Malawi s'élevaient à 4,29 milliards de dollars en 2025, au 143e rang mondial. En 2025, les importations du Malawi dépassaient ses exportations de 2,7 milliards de dollars, soit un déficit commercial.
Exportations de biens du Malawi par catégorie, 2025
Exportations de biens, 2025: 914 M $US
En 2025, la première catégorie des exportations de biens du Malawi était « aliments transformés, huiles, aliments pour animaux, boissons et tabac », avec 72,9 %, suivie de « cultures, plantes et fleurs (céréales, fruits, légumes, café, oléagineux) », avec 19,0 %.
Destinations des exportations de biens du Malawi : les 10 premières, 2025
| Rang | Pays | Exportations de biens | Part | |
|---|---|---|---|---|
| 1 |
 Belgique |
171 M $US | 18,7 % | |
| 2 |
 Chine |
63,3 M $US | 6,93 % | |
| 3 |
 Inde |
51,4 M $US | 5,62 % | |
| 4 |
 États-Unis |
42,5 M $US | 4,65 % | |
| 5 |
 Afrique du Sud |
39,9 M $US | 4,37 % | vs Afrique du Sud |
| 6 |
 Zimbabwe |
37,9 M $US | 4,15 % | vs Zimbabwe |
| 7 |
 Égypte |
35,8 M $US | 3,91 % | |
| 8 |
 Pologne |
33,4 M $US | 3,66 % | |
| 9 |
 Turquie |
32,5 M $US | 3,56 % | |
| 10 |
 Royaume-Uni |
26,2 M $US | 2,87 % | |
| Autres partenaires et non précisés | 380 M $US | 41,5 % |
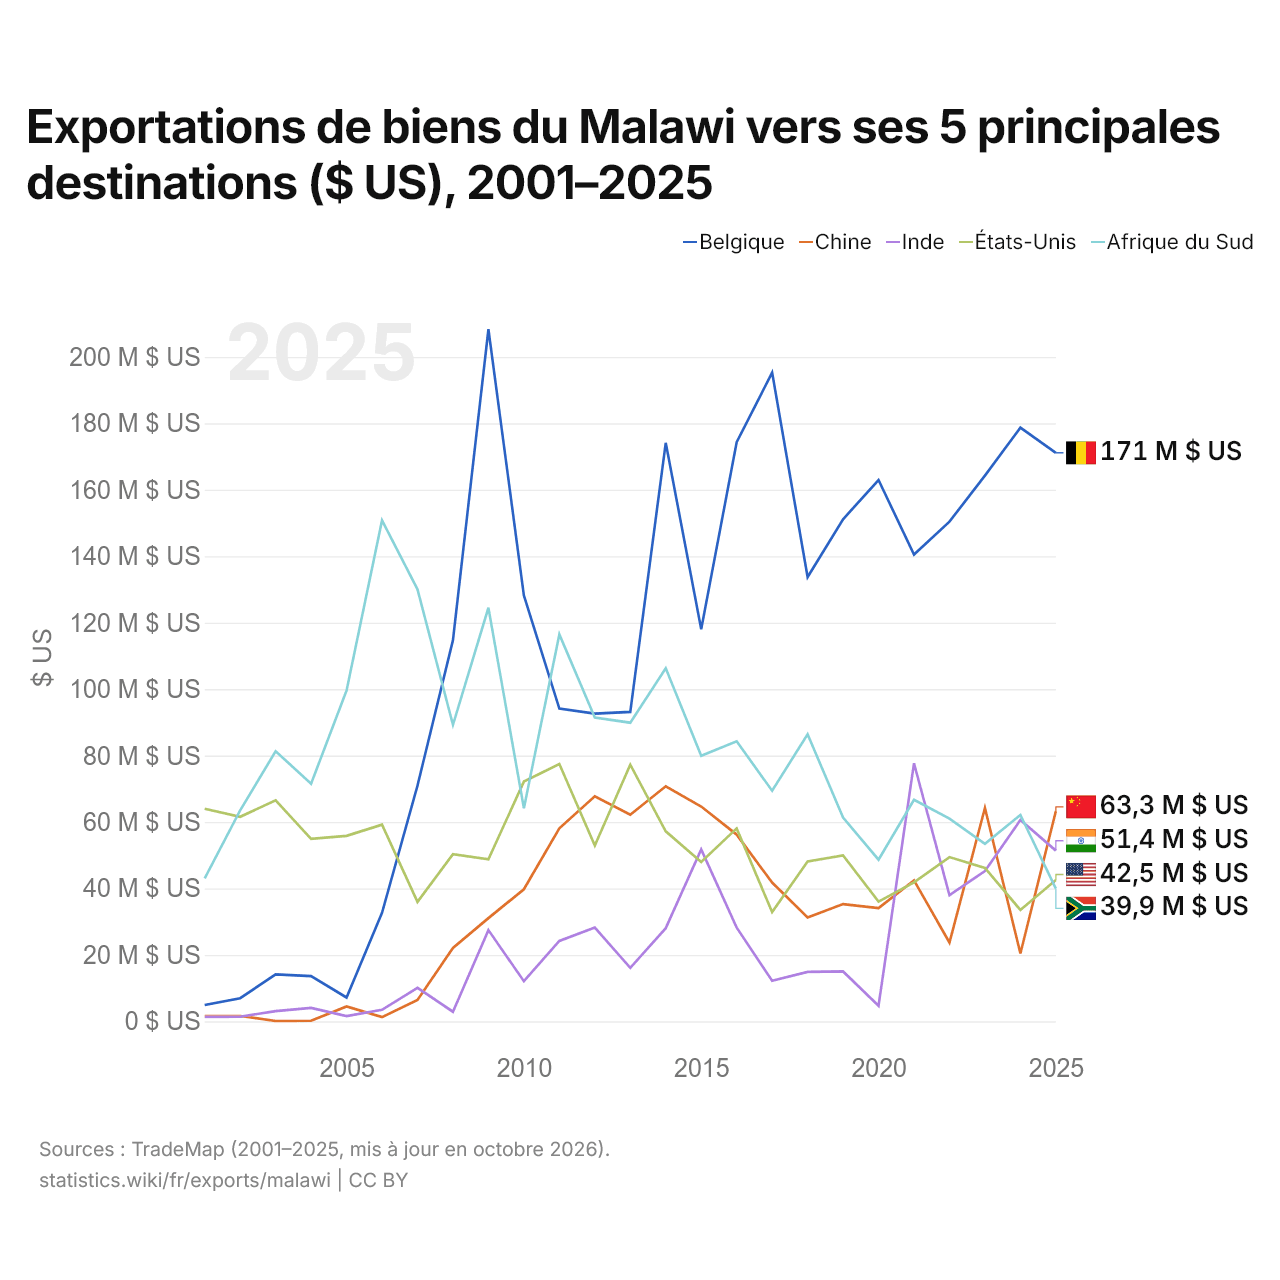
Exportations de biens du Malawi vers ses 5 principales destinations ($ US), 2001–2025
| Année | $ US | ||||
|---|---|---|---|---|---|
| Belgique | Chine | Inde | États-Unis | Afrique du Sud | |
| 2025 | 171 120 000 $ US | 63 282 000 $ US | 51 387 000 $ US | 42 529 000 $ US | 39 925 000 $ US |
| 2024 | 178 702 000 $ US | 20 429 000 $ US | 60 606 000 $ US | 33 527 000 $ US | 62 125 000 $ US |
| 2023 | 164 265 000 $ US | 64 235 000 $ US | 45 208 000 $ US | 46 163 000 $ US | 53 443 000 $ US |
| 2022 | 150 405 000 $ US | 23 726 000 $ US | 38 010 000 $ US | 49 438 000 $ US | 61 006 000 $ US |
| 2021 | 140 502 000 $ US | 42 409 000 $ US | 77 669 000 $ US | 41 819 000 $ US | 66 661 000 $ US |
| 2020 | 162 938 000 $ US | 34 092 000 $ US | 4 685 000 $ US | 36 022 000 $ US | 48 651 000 $ US |
| 2019 | 151 139 000 $ US | 35 293 000 $ US | 15 019 000 $ US | 49 912 000 $ US | 61 349 000 $ US |
| 2018 | 133 717 000 $ US | 31 228 000 $ US | 14 896 000 $ US | 48 135 000 $ US | 86 392 000 $ US |
| 2017 | 195 275 000 $ US | 41 761 000 $ US | 12 183 000 $ US | 32 864 000 $ US | 69 405 000 $ US |
| 2016 | 174 314 000 $ US | 56 216 000 $ US | 28 201 000 $ US | 58 079 000 $ US | 84 287 000 $ US |
| 2015 | 118 035 000 $ US | 64 650 000 $ US | 51 748 000 $ US | 47 986 000 $ US | 79 944 000 $ US |
| 2014 | 174 133 000 $ US | 70 748 000 $ US | 28 057 000 $ US | 57 203 000 $ US | 106 290 000 $ US |
| 2013 | 93 130 000 $ US | 62 168 000 $ US | 16 093 000 $ US | 77 240 000 $ US | 89 891 000 $ US |
| 2012 | 92 611 000 $ US | 67 750 000 $ US | 28 220 000 $ US | 52 939 000 $ US | 91 469 000 $ US |
| 2011 | 94 129 000 $ US | 58 097 000 $ US | 24 205 000 $ US | 77 477 000 $ US | 116 473 000 $ US |
| 2010 | 128 222 000 $ US | 39 757 000 $ US | 12 077 000 $ US | 72 166 000 $ US | 64 153 000 $ US |
| 2009 | 208 316 000 $ US | 31 062 000 $ US | 27 464 000 $ US | 48 768 000 $ US | 124 483 000 $ US |
| 2008 | 114 724 000 $ US | 22 080 000 $ US | 2 894 000 $ US | 50 322 000 $ US | 89 239 000 $ US |
| 2007 | 70 944 000 $ US | 6 433 000 $ US | 10 060 000 $ US | 35 941 000 $ US | 130 027 000 $ US |
| 2006 | 32 667 000 $ US | 1 273 000 $ US | 3 472 000 $ US | 59 211 000 $ US | 150 793 000 $ US |
| 2005 | 7 181 000 $ US | 4 494 000 $ US | 1 594 000 $ US | 55 834 000 $ US | 99 562 000 $ US |
| 2004 | 13 628 000 $ US | 164 000 $ US | 4 060 000 $ US | 54 909 000 $ US | 71 528 000 $ US |
| 2003 | 14 109 000 $ US | 103 000 $ US | 3 091 000 $ US | 66 502 000 $ US | 81 306 000 $ US |
| 2002 | 6 962 000 $ US | 1 615 000 $ US | 1 387 000 $ US | 61 563 000 $ US | 63 498 000 $ US |
| 2001 | 4 916 000 $ US | 1 601 000 $ US | 1 349 000 $ US | 63 976 000 $ US | 43 049 000 $ US |
En 2025, les exportations de biens s'élevaient à 171 millions de dollars vers la Belgique, 63,3 millions de dollars vers la Chine, 51,4 millions de dollars vers l'Inde, 42,5 millions de dollars vers les États-Unis et 39,9 millions de dollars vers l'Afrique du Sud. Le premier rang des cinq destinations du Malawi est occupé par la Belgique depuis 2012. Le changement le plus récent dans leur ordre remonte à 2025, quand les exportations du Malawi vers la Chine ont dépassé celles vers l'Inde.
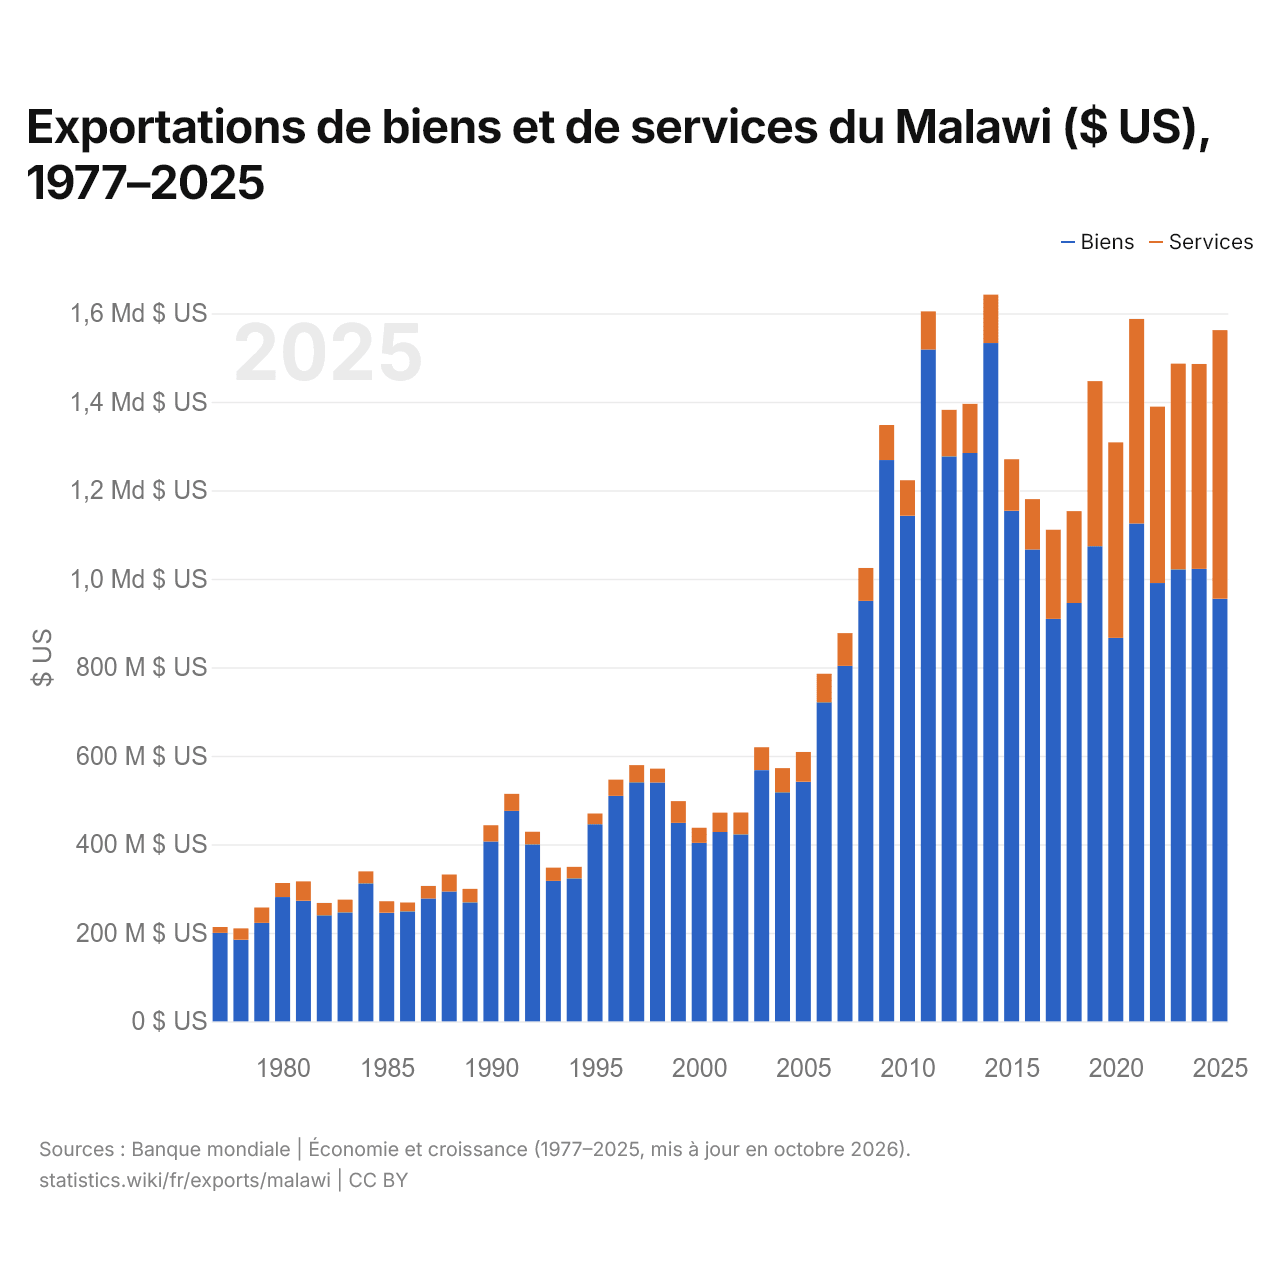
Exportations de biens et de services du Malawi ($ US), 1977–2025
| Année | $ US | |
|---|---|---|
| Biens | Services | |
| 2025 | 954 975 999 $ US | 607 101 345 $ US |
| 2024 | 1 022 582 528 $ US | 462 906 714 $ US |
| 2023 | 1 021 224 561 $ US | 465 050 471 $ US |
| 2022 | 990 361 184 $ US | 398 841 633 $ US |
| 2021 | 1 125 111 915 $ US | 462 146 310 $ US |
| 2020 | 866 622 699 $ US | 441 708 589 $ US |
| 2019 | 1 073 624 573 $ US | 373 056 610 $ US |
| 2018 | 945 381 811 $ US | 207 547 199 $ US |
| 2017 | 909 659 464 $ US | 201 294 772 $ US |
| 2016 | 1 066 202 435 $ US | 113 930 534 $ US |
| 2015 | 1 153 803 038 $ US | 116 294 028 $ US |
| 2014 | 1 532 695 812 $ US | 109 397 480 $ US |
| 2013 | 1 284 363 623 $ US | 111 025 313 $ US |
| 2012 | 1 276 630 885 $ US | 105 266 670 $ US |
| 2011 | 1 517 954 434 $ US | 86 309 155 $ US |
| 2010 | 1 142 537 954 $ US | 80 092 630 $ US |
| 2009 | 1 268 360 353 $ US | 79 091 250 $ US |
| 2008 | 950 132 335 $ US | 74 402 761 $ US |
| 2007 | 803 225 022 $ US | 74 014 040 $ US |
| 2006 | 721 030 301 $ US | 64 513 316 $ US |
| 2005 | 541 368 482 $ US | 67 320 472 $ US |
| 2004 | 517 522 318 $ US | 54 753 745 $ US |
| 2003 | 567 537 366 $ US | 51 918 250 $ US |
| 2002 | 422 446 556 $ US | 49 414 517 $ US |
| 2001 | 427 911 822 $ US | 43 641 683 $ US |
| 2000 | 403 128 765 $ US | 34 289 495 $ US |
| 1999 | 448 438 226 $ US | 49 237 381 $ US |
| 1998 | 539 555 137 $ US | 31 522 947 $ US |
| 1997 | 540 246 014 $ US | 38 811 920 $ US |
| 1996 | 509 633 340 $ US | 36 646 387 $ US |
| 1995 | 445 467 180 $ US | 24 162 931 $ US |
| 1994 | 323 050 500 $ US | 26 074 799 $ US |
| 1993 | 317 458 635 $ US | 29 958 356 $ US |
| 1992 | 399 913 921 $ US | 28 501 846 $ US |
| 1991 | 475 508 885 $ US | 38 525 851 $ US |
| 1990 | 406 430 229 $ US | 36 645 048 $ US |
| 1989 | 268 778 222 $ US | 30 512 507 $ US |
| 1988 | 293 483 682 $ US | 38 457 021 $ US |
| 1987 | 277 578 758 $ US | 28 387 193 $ US |
| 1986 | 248 405 042 $ US | 20 095 930 $ US |
| 1985 | 245 477 761 $ US | 25 943 858 $ US |
| 1984 | 311 805 742 $ US | 27 027 409 $ US |
| 1983 | 246 177 244 $ US | 28 771 753 $ US |
| 1982 | 239 694 764 $ US | 27 853 858 $ US |
| 1981 | 272 534 625 $ US | 43 672 557 $ US |
| 1980 | 280 755 100 $ US | 31 769 656 $ US |
| 1979 | 222 432 259 $ US | 34 766 517 $ US |
| 1978 | 184 534 409 $ US | 25 600 149 $ US |
| 1977 | 199 794 428 $ US | 13 400 846 $ US |
En 2025, les exportations de biens du Malawi s'élevaient à 955 millions de dollars et celles de services à 607 millions de dollars ; les services représentaient 38,9 % du total, contre 6,3 % en 1977.
Le Malawi dans le classement mondial des exportations, 2025
| Rang | Pays | Exportations | Part mondiale | |
|---|---|---|---|---|
| 151 |
 Seychelles |
1,90 Md $US | 0,005 % | |
| 152 |
 Belize |
1,77 Md $US (2024) | 0,005 % | |
| 153 |
 Syrie |
1,61 Md $US (2022) | 0,005 % | |
| 154 |
 Malawi |
1,59 Md $US | 0,005 % | |
| 155 |
 Sierra Leone |
1,56 Md $US | 0,004 % | |
| 156 |
 Cap-Vert |
1,28 Md $US | 0,004 % | |
| 157 |
 Lesotho |
1,27 Md $US | 0,004 % |
Exportations de biens et services du Malawi, % du PIB, 2017–2025
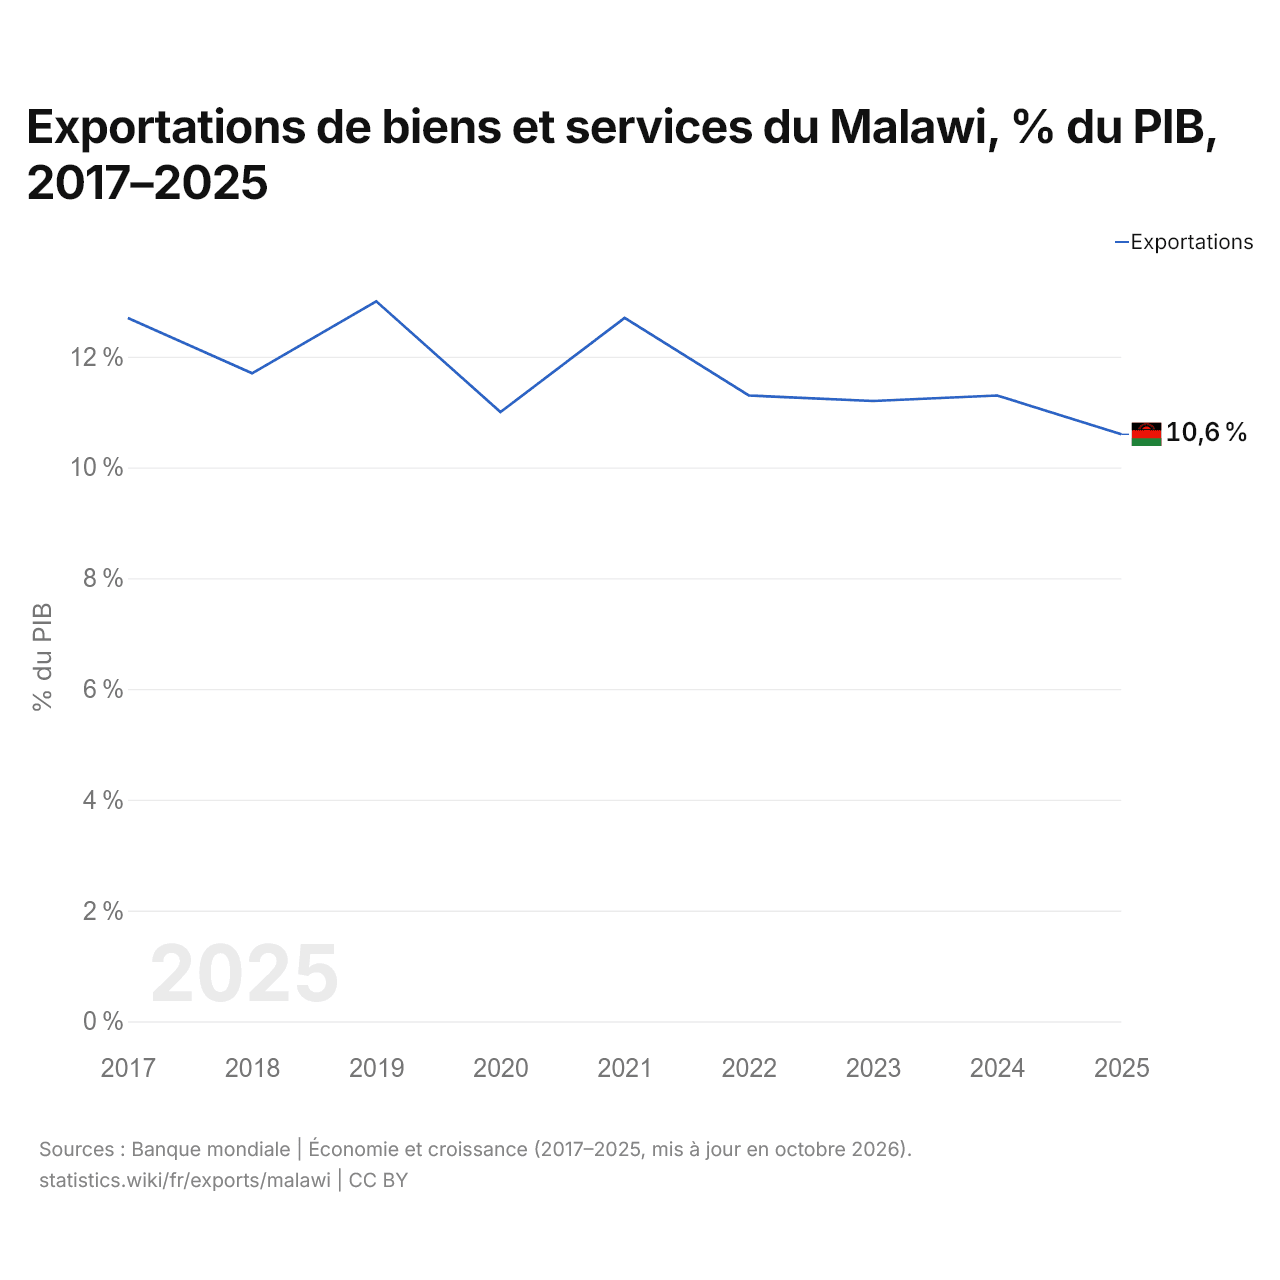
En 2025, les exportations de biens et services du Malawi équivalaient à 10,6 % de son PIB, contre 12,7 % en 2017. La part la plus élevée a été de 13,0 %, en 2019.
Comparer les exportations du Malawi avec celles d'autres pays
Sources :
- TradeMap (2001–2025, mis à jour en octobre 2026)
- Banque mondiale | Économie et croissance (1977–2025, mis à jour en octobre 2026)
Creative Commons Attribution (CC BY) : vous pouvez copier, partager, adapter et réutiliser ce contenu, y compris à des fins commerciales, à condition de citer statistics.wiki et d’indiquer les modifications apportées. Les sources citées ci-dessus peuvent avoir leurs propres conditions de licence.