
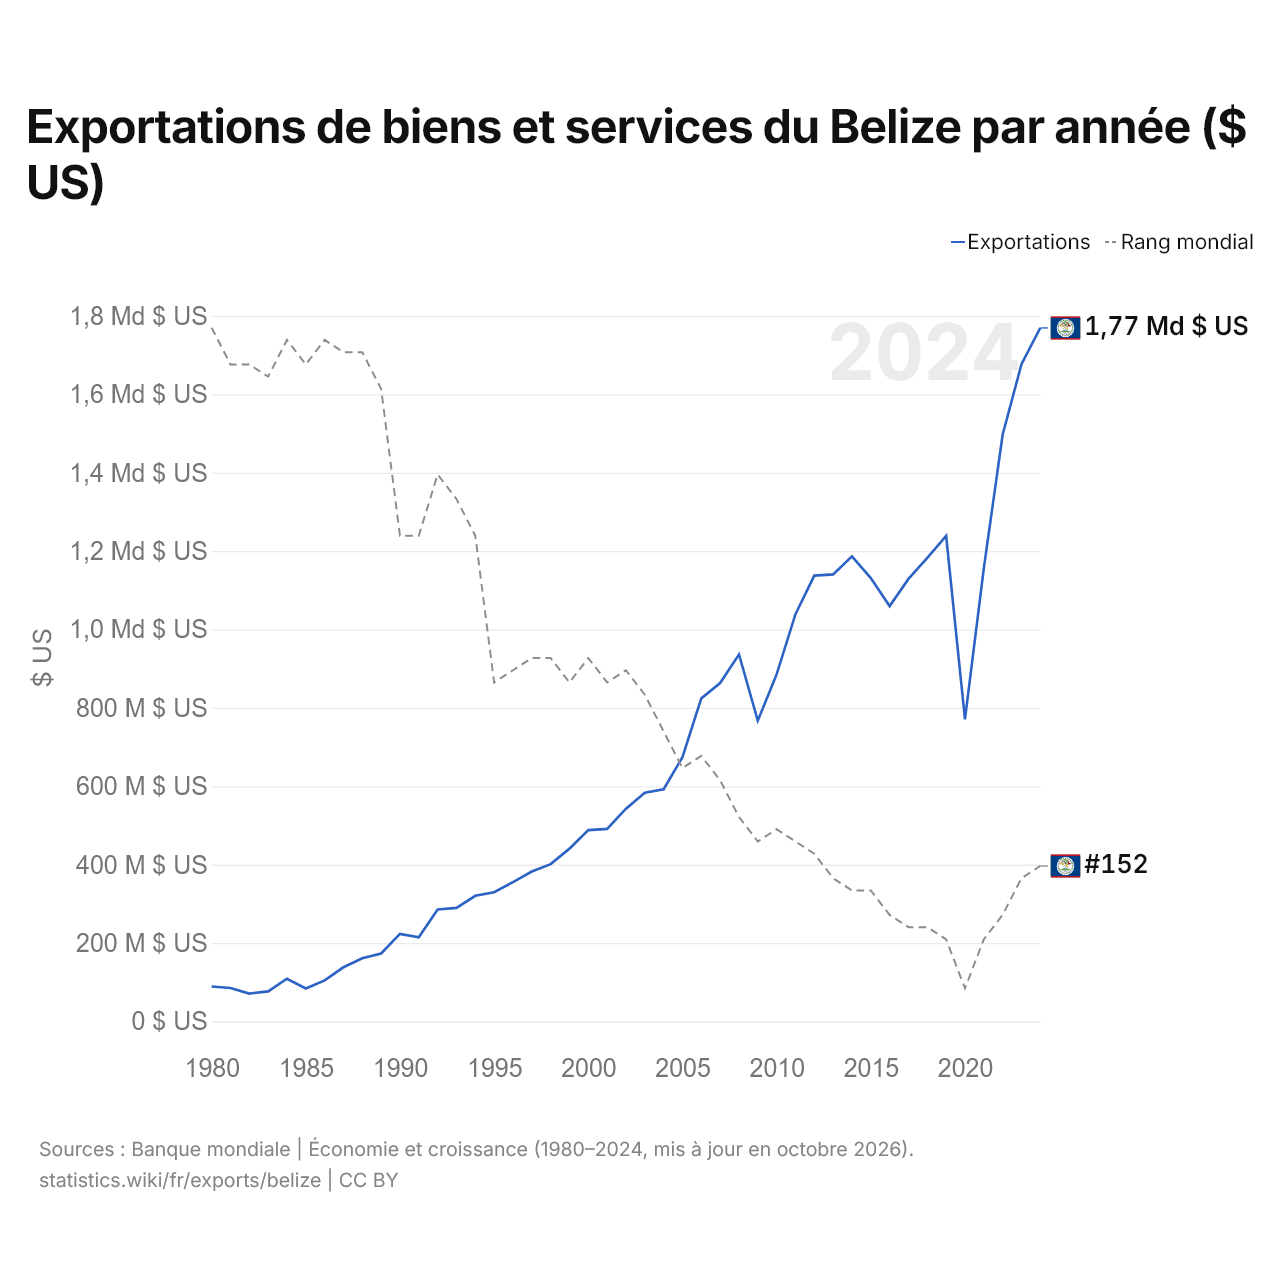
Exportations de biens et services du Belize par année ($ US)
| Année | $ US | Rang mondial |
|---|---|---|
| Exportations | Rang mondial | |
| 2024 | 1 769 154 200 $ US | #152 |
| 2023 | 1 676 688 500 $ US | #153 |
| 2022 | 1 496 710 050 $ US | #156 |
| 2021 | 1 155 566 850 $ US | #158 |
| 2020 | 770 543 100 $ US | #162 |
| 2019 | 1 238 668 200 $ US | #158 |
| 2018 | 1 182 621 350 $ US | #157 |
| 2017 | 1 128 699 550 $ US | #157 |
| 2016 | 1 059 495 900 $ US | #156 |
| 2015 | 1 130 908 300 $ US | #154 |
| 2014 | 1 186 559 050 $ US | #154 |
| 2013 | 1 140 192 650 $ US | #153 |
| 2012 | 1 137 338 150 $ US | #151 |
| 2011 | 1 038 907 850 $ US | #150 |
| 2010 | 885 429 200 $ US | #149 |
| 2009 | 767 106 000 $ US | #150 |
| 2008 | 935 978 400 $ US | #148 |
| 2007 | 862 991 350 $ US | #145 |
| 2006 | 823 898 200 $ US | #143 |
| 2005 | 674 186 100 $ US | #144 |
| 2004 | 592 076 950 $ US | #141 |
| 2003 | 583 088 150 $ US | #138 |
| 2002 | 542 614 750 $ US | #136 |
| 2001 | 490 927 800 $ US | #137 |
| 2000 | 487 924 600 $ US | #135 |
| 1999 | 440 616 500 $ US | #137 |
| 1998 | 401 042 650 $ US | #135 |
| 1997 | 382 290 400 $ US | #135 |
| 1996 | 355 026 750 $ US | #136 |
| 1995 | 329 246 950 $ US | #137 |
| 1994 | 320 424 050 $ US | #125 |
| 1993 | 289 533 650 $ US | #122 |
| 1992 | 285 422 200 $ US | #120 |
| 1991 | 214 670 100 $ US | #125 |
| 1990 | 223 301 496 $ US | #125 |
| 1989 | 172 915 000 $ US | #113 |
| 1988 | 161 076 592 $ US | #110 |
| 1987 | 137 936 011 $ US | #110 |
| 1986 | 104 359 482 $ US | #109 |
| 1985 | 83 652 581 $ US | #111 |
| 1984 | 108 649 358 $ US | #109 |
| 1983 | 76 516 537 $ US | #112 |
| 1982 | 70 947 948 $ US | #111 |
| 1981 | 84 972 543 $ US | #111 |
| 1980 | 88 973 677 $ US | #108 |
Les exportations de biens et services du Belize s'élèvent à 1,77 milliard de dollars (2024), contre 89 millions de dollars en 1980. Le minimum a été de 70,9 millions de dollars, en 1982. Elles se classent au 152e rang mondial, en hausse par rapport au 153e rang l'année précédente. Leur meilleur rang a été le 108e, occupé pour la dernière fois en 1980.
Les exportations de biens et services du Belize sont les 25es plus élevées de 27 pays situés en Amérique latine. Les importations de biens et services du Belize s'élevaient à 1,73 milliard de dollars en 2025, au 155e rang mondial. Les exportations du Belize dépassent ses importations de 47,2 millions de dollars, soit un excédent commercial (2024).
Exportations de biens du Belize par catégorie, 2025
Exportations de biens, 2025: 242 M $US
En 2025, la première catégorie des exportations de biens du Belize était « aliments transformés, huiles, aliments pour animaux, boissons et tabac », avec 46,1 %, suivie de « cultures, plantes et fleurs (céréales, fruits, légumes, café, oléagineux) », avec 22,8 %.
Destinations des exportations de biens du Belize : les 10 premières, 2025
| Rang | Pays | Exportations de biens | Part | |
|---|---|---|---|---|
| 1 |
 Royaume-Uni |
63,8 M $US | 26,3 % | |
| 2 |
 États-Unis |
62,7 M $US | 25,9 % | |
| 3 |
 Trinité-et-Tobago |
15,3 M $US | 6,3 % | |
| 4 |
 Irlande |
13,5 M $US | 5,57 % | |
| 5 |
 Jamaïque |
13,1 M $US | 5,41 % | |
| 6 |
 Honduras |
12,1 M $US | 5,01 % | |
| 7 |
 Mexique |
10,3 M $US | 4,23 % | |
| 8 |
 Guatemala |
9,33 M $US | 3,85 % | |
| 9 |
 Barbade |
4,11 M $US | 1,7 % | |
| 10 |
 Italie |
3,27 M $US | 1,35 % | |
| Autres partenaires et non précisés | 34,7 M $US | 14,3 % |
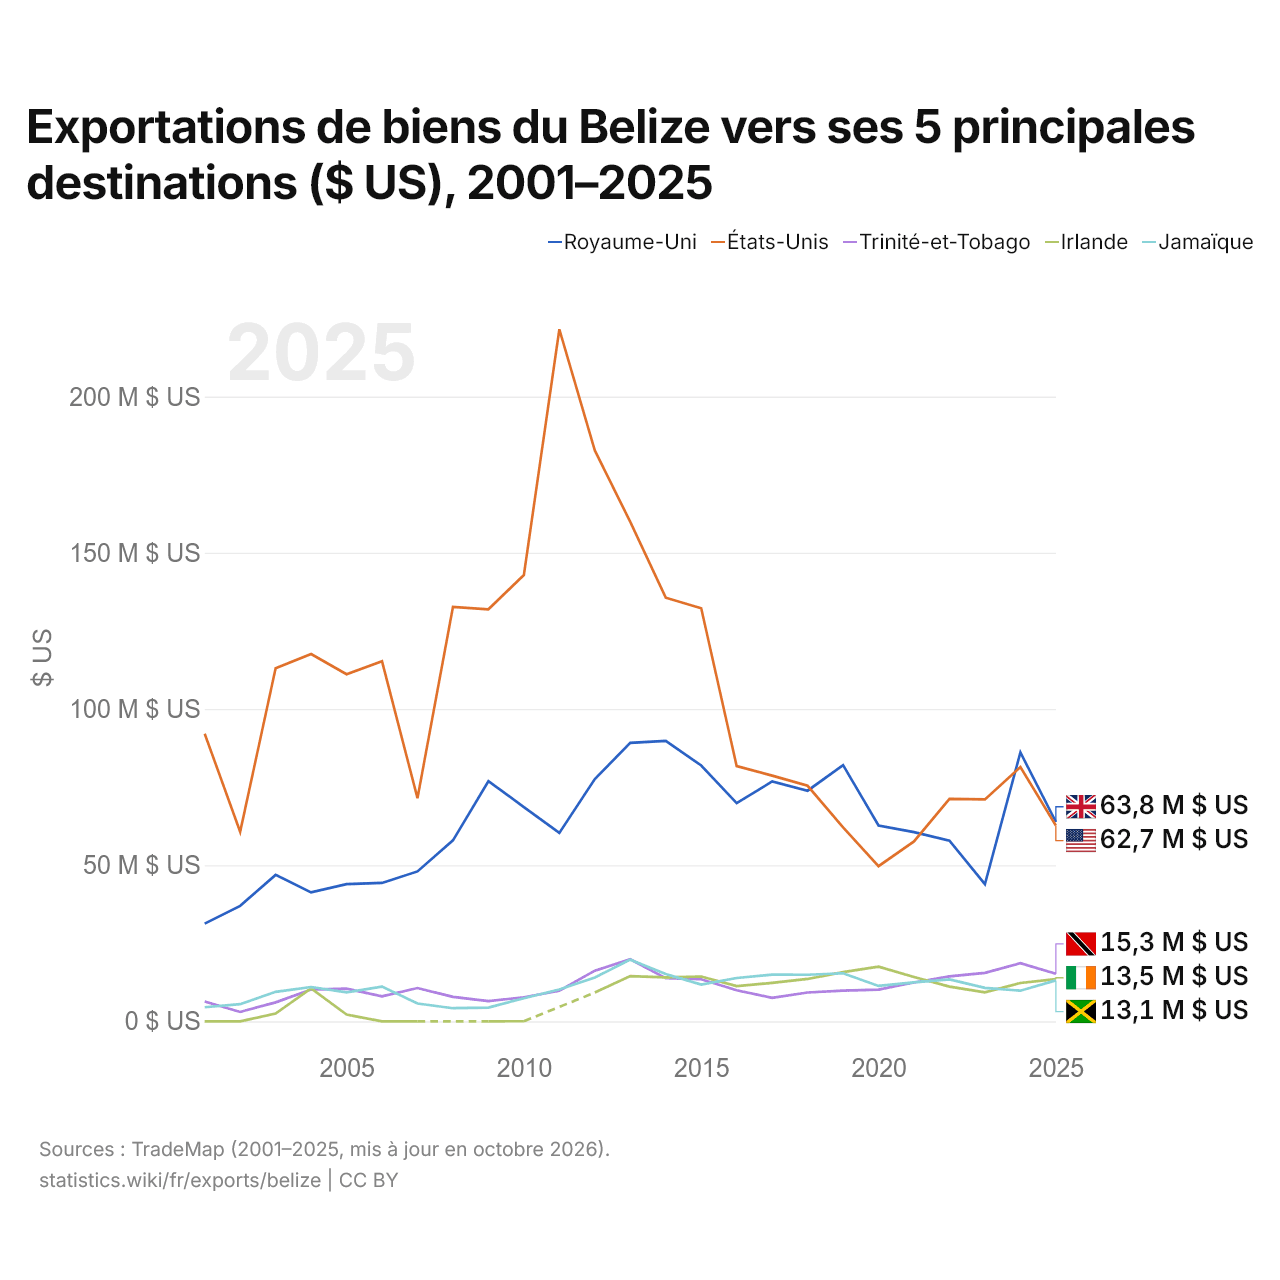
Exportations de biens du Belize vers ses 5 principales destinations ($ US), 2001–2025
| Année | $ US | ||||
|---|---|---|---|---|---|
| Royaume-Uni | États-Unis | Trinité-et-Tobago | Irlande | Jamaïque | |
| 2025 | 63 832 000 $ US | 62 716 000 $ US | 15 259 000 $ US | 13 492 000 $ US | 13 108 000 $ US |
| 2024 | 86 086 000 $ US | 81 424 000 $ US | 18 632 000 $ US | 12 260 000 $ US | 9 817 000 $ US |
| 2023 | 43 910 000 $ US | 71 050 000 $ US | 15 508 000 $ US | 9 260 000 $ US | 10 713 000 $ US |
| 2022 | 57 848 000 $ US | 71 196 000 $ US | 14 376 000 $ US | 11 106 000 $ US | 13 421 000 $ US |
| 2021 | 60 584 000 $ US | 57 574 000 $ US | 12 447 000 $ US | 14 212 000 $ US | 12 475 000 $ US |
| 2020 | 62 709 000 $ US | 49 674 000 $ US | 10 161 000 $ US | 17 497 000 $ US | 11 341 000 $ US |
| 2019 | 82 007 000 $ US | 62 094 000 $ US | 9 843 000 $ US | 15 764 000 $ US | 15 402 000 $ US |
| 2018 | 73 833 000 $ US | 75 407 000 $ US | 9 226 000 $ US | 13 568 000 $ US | 14 916 000 $ US |
| 2017 | 76 785 000 $ US | 78 650 000 $ US | 7 535 000 $ US | 12 293 000 $ US | 14 951 000 $ US |
| 2016 | 69 839 000 $ US | 81 701 000 $ US | 9 931 000 $ US | 11 281 000 $ US | 13 880 000 $ US |
| 2015 | 81 897 000 $ US | 132 244 000 $ US | 13 477 000 $ US | 14 332 000 $ US | 11 786 000 $ US |
| 2014 | 89 793 000 $ US | 135 623 000 $ US | 13 780 000 $ US | 14 071 000 $ US | 15 136 000 $ US |
| 2013 | 89 161 000 $ US | 159 881 000 $ US | 19 866 000 $ US | 14 485 000 $ US | 19 742 000 $ US |
| 2012 | 77 544 000 $ US | 182 738 000 $ US | 16 225 000 $ US | 9 212 000 $ US | 14 029 000 $ US |
| 2011 | 60 325 000 $ US | 221 540 000 $ US | 9 784 000 $ US | - | 10 177 000 $ US |
| 2010 | 68 581 000 $ US | 142 864 000 $ US | 7 705 000 $ US | 32 000 $ US | 7 382 000 $ US |
| 2009 | 76 876 000 $ US | 131 911 000 $ US | 6 473 000 $ US | 3 000 $ US | 4 410 000 $ US |
| 2008 | 57 927 000 $ US | 132 674 000 $ US | 7 818 000 $ US | - | 4 202 000 $ US |
| 2007 | 47 990 000 $ US | 71 435 000 $ US | 10 658 000 $ US | 7 000 $ US | 5 718 000 $ US |
| 2006 | 44 310 000 $ US | 115 252 000 $ US | 7 979 000 $ US | 4 000 $ US | 11 130 000 $ US |
| 2005 | 43 934 000 $ US | 111 104 000 $ US | 10 482 000 $ US | 2 152 000 $ US | 9 271 000 $ US |
| 2004 | 41 287 000 $ US | 117 564 000 $ US | 10 167 000 $ US | 10 514 000 $ US | 10 982 000 $ US |
| 2003 | 46 886 000 $ US | 113 057 000 $ US | 6 070 000 $ US | 2 505 000 $ US | 9 453 000 $ US |
| 2002 | 36 969 000 $ US | 60 665 000 $ US | 3 007 000 $ US | 2 000 $ US | 5 495 000 $ US |
| 2001 | 31 284 000 $ US | 92 090 000 $ US | 6 320 000 $ US | 1 000 $ US | 4 494 000 $ US |
En 2025, les exportations de biens s'élevaient à 63,8 millions de dollars vers le Royaume-Uni, 62,7 millions de dollars vers les États-Unis, 15,3 millions de dollars vers Trinité-et-Tobago, 13,5 millions de dollars vers l'Irlande et 13,1 millions de dollars vers la Jamaïque. Le premier rang des cinq destinations du Belize est occupé par le Royaume-Uni depuis 2024.
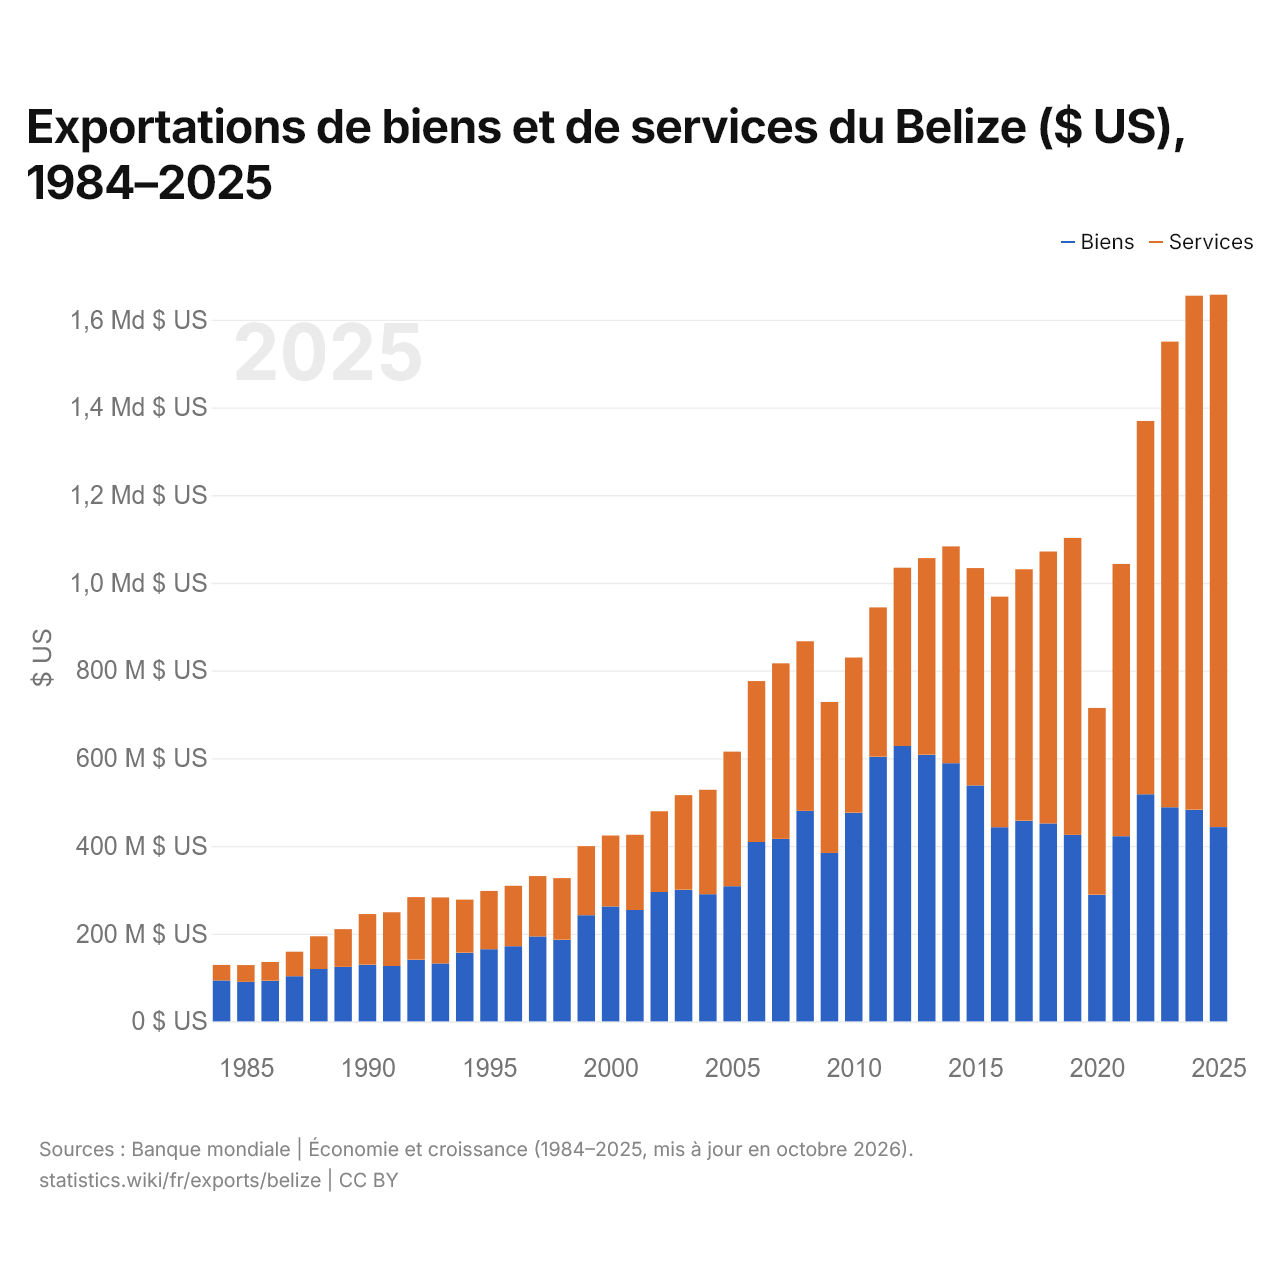
Exportations de biens et de services du Belize ($ US), 1984–2025
| Année | $ US | |
|---|---|---|
| Biens | Services | |
| 2025 | 442 910 790 $ US | 1 214 117 947 $ US |
| 2024 | 482 478 850 $ US | 1 172 277 547 $ US |
| 2023 | 488 061 500 $ US | 1 061 922 701 $ US |
| 2022 | 517 740 573 $ US | 851 316 441 $ US |
| 2021 | 422 123 245 $ US | 620 868 925 $ US |
| 2020 | 288 753 129 $ US | 425 870 424 $ US |
| 2019 | 425 276 780 $ US | 677 199 095 $ US |
| 2018 | 451 249 163 $ US | 620 049 388 $ US |
| 2017 | 457 436 755 $ US | 573 471 410 $ US |
| 2016 | 442 799 710 $ US | 525 727 234 $ US |
| 2015 | 537 911 605 $ US | 495 732 587 $ US |
| 2014 | 588 687 029 $ US | 494 314 252 $ US |
| 2013 | 608 074 014 $ US | 448 053 138 $ US |
| 2012 | 627 854 153 $ US | 406 560 306 $ US |
| 2011 | 603 581 171 $ US | 340 185 856 $ US |
| 2010 | 475 729 501 $ US | 353 846 432 $ US |
| 2009 | 383 955 785 $ US | 344 344 096 $ US |
| 2008 | 479 973 485 $ US | 386 592 313 $ US |
| 2007 | 416 264 480 $ US | 400 086 592 $ US |
| 2006 | 408 927 960 $ US | 367 036 154 $ US |
| 2005 | 308 048 780 $ US | 306 951 848 $ US |
| 2004 | 289 916 809 $ US | 238 140 222 $ US |
| 2003 | 300 201 565 $ US | 215 545 227 $ US |
| 2002 | 294 908 237 $ US | 184 242 661 $ US |
| 2001 | 253 941 945 $ US | 171 411 629 $ US |
| 2000 | 261 923 858 $ US | 161 778 912 $ US |
| 1999 | 241 914 012 $ US | 157 550 376 $ US |
| 1998 | 186 160 000 $ US | 140 450 000 $ US |
| 1997 | 193 400 000 $ US | 137 840 000 $ US |
| 1996 | 171 270 000 $ US | 137 875 000 $ US |
| 1995 | 164 552 000 $ US | 132 806 000 $ US |
| 1994 | 156 464 000 $ US | 121 147 000 $ US |
| 1993 | 132 000 000 $ US | 150 500 000 $ US |
| 1992 | 140 600 000 $ US | 142 600 000 $ US |
| 1991 | 126 100 000 $ US | 122 700 000 $ US |
| 1990 | 129 200 000 $ US | 115 350 000 $ US |
| 1989 | 124 400 000 $ US | 85 850 000 $ US |
| 1988 | 119 400 000 $ US | 74 450 000 $ US |
| 1987 | 102 850 000 $ US | 55 950 000 $ US |
| 1986 | 92 600 000 $ US | 42 800 000 $ US |
| 1985 | 90 150 000 $ US | 38 100 000 $ US |
| 1984 | 93 200 000 $ US | 35 400 000 $ US |
En 2025, les exportations de biens du Belize s'élevaient à 443 millions de dollars et celles de services à 1,21 milliard de dollars ; les services représentaient 73,3 % du total, contre 27,5 % en 1984.
Le Belize dans le classement mondial des exportations
| Rang | Pays | Exportations | Part mondiale | |
|---|---|---|---|---|
| 149 |
 Tadjikistan |
2,12 Md $US (2025) | 0,006 % | |
| 150 |
 Curaçao |
2,11 Md $US (2023) | 0,007 % | |
| 151 |
 Seychelles |
1,90 Md $US (2025) | 0,005 % | |
| 152 |
 Belize |
1,77 Md $US | 0,005 % | |
| 153 |
 Syrie |
1,61 Md $US (2022) | 0,005 % | |
| 154 |
 Malawi |
1,59 Md $US (2025) | 0,005 % | |
| 155 |
 Sierra Leone |
1,56 Md $US (2025) | 0,004 % |
Exportations de biens et services du Belize, % du PIB
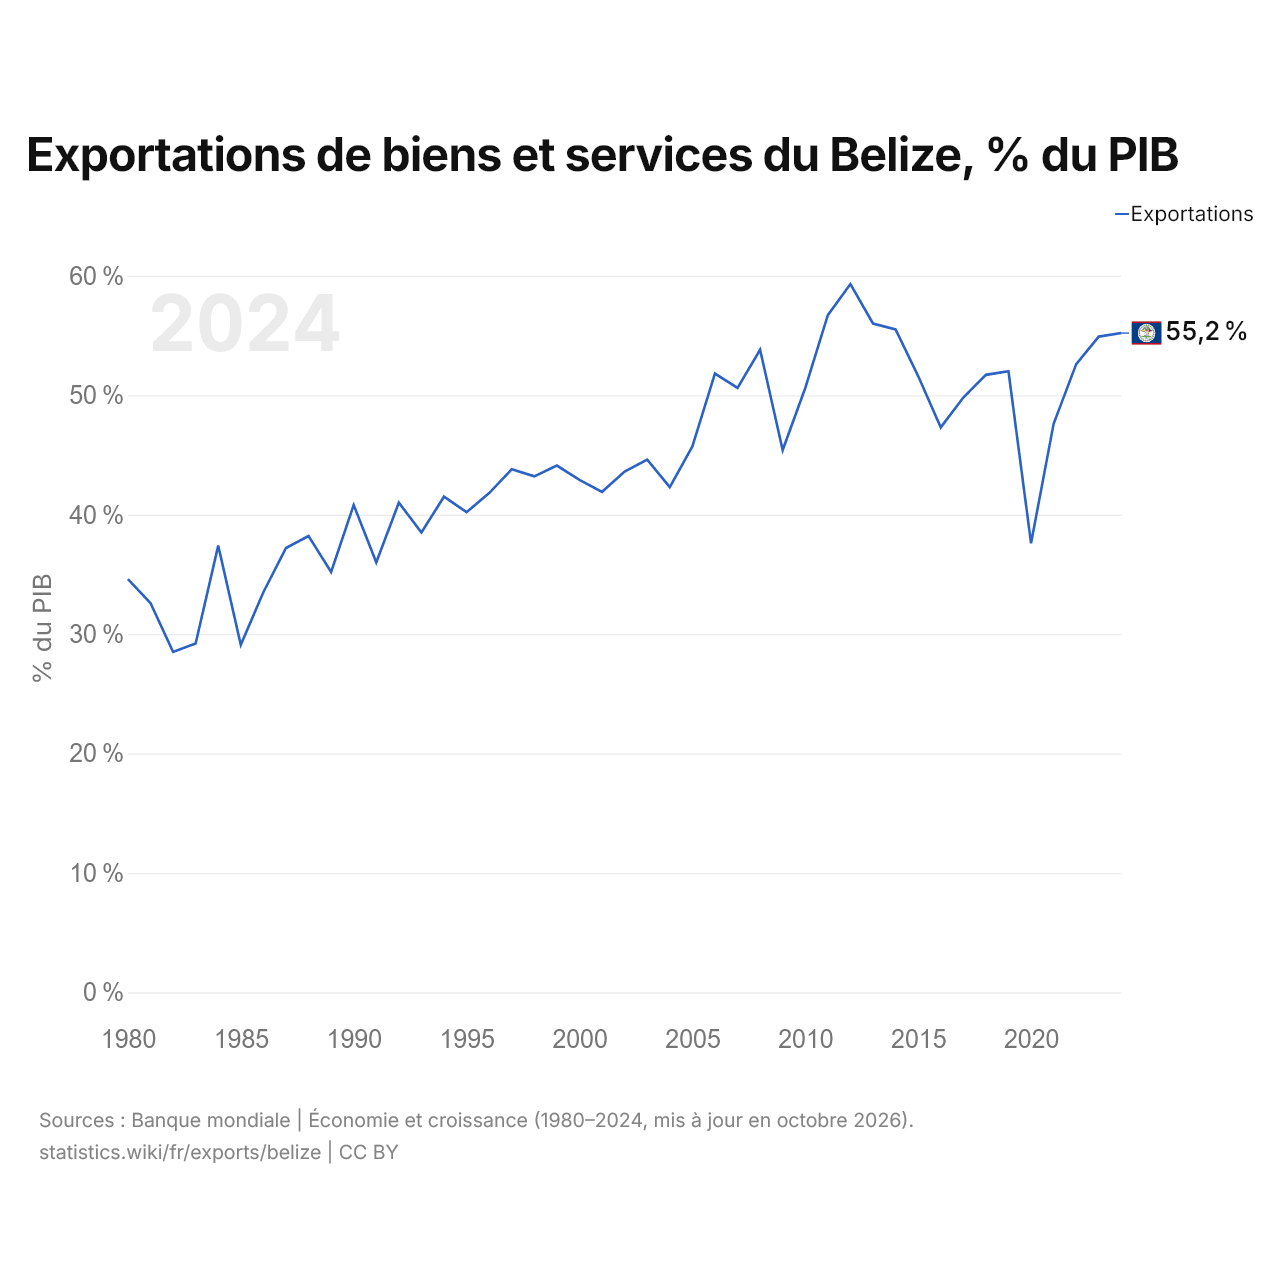
Les exportations de biens et services du Belize équivalent à 55,2 % de son PIB (2024), contre 34,6 % en 1980. La part la plus élevée a été de 59,3 %, en 2012.
Comparer les exportations du Belize avec celles d'autres pays
Sources :
- Banque mondiale | Économie et croissance (1980–2025, mis à jour en octobre 2026)
- TradeMap (2001–2025, mis à jour en octobre 2026)
Creative Commons Attribution (CC BY) : vous pouvez copier, partager, adapter et réutiliser ce contenu, y compris à des fins commerciales, à condition de citer statistics.wiki et d’indiquer les modifications apportées. Les sources citées ci-dessus peuvent avoir leurs propres conditions de licence.