
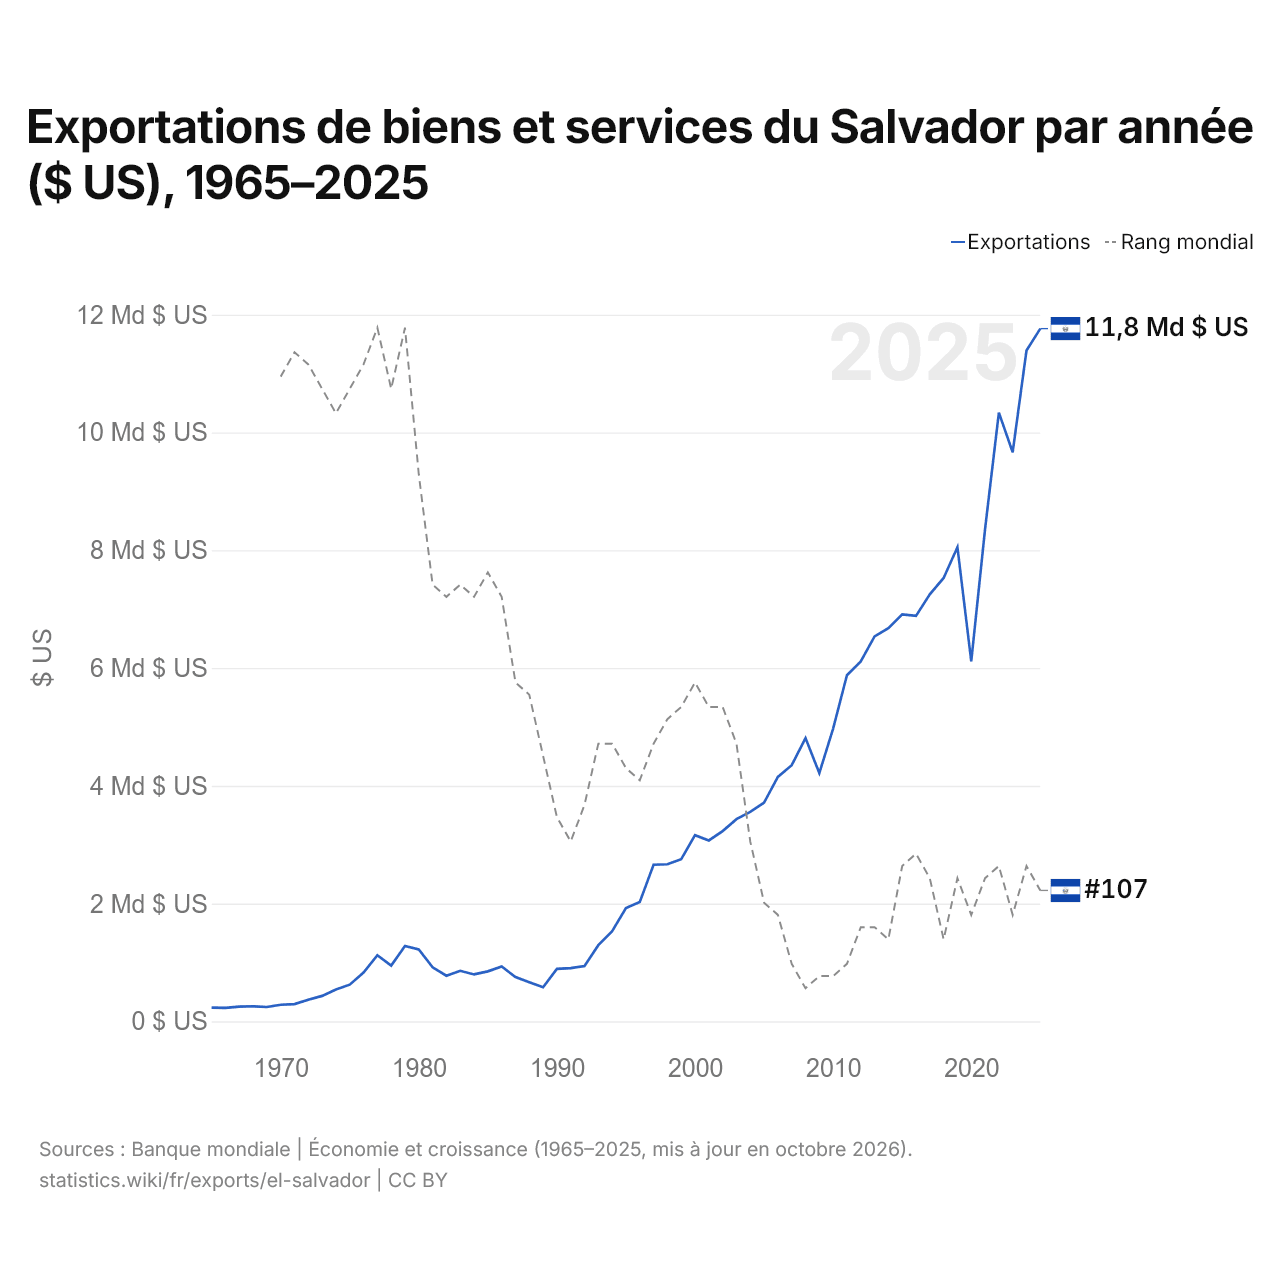
Exportations de biens et services du Salvador par année ($ US), 1965–2025
| Année | $ US | Rang mondial |
|---|---|---|
| Exportations | Rang mondial | |
| 2025 | 11 763 690 000 $ US | #107 |
| 2024 | 11 391 670 000 $ US | #105 |
| 2023 | 9 664 110 000 $ US | #109 |
| 2022 | 10 336 590 000 $ US | #105 |
| 2021 | 8 359 050 000 $ US | #106 |
| 2020 | 6 112 370 000 $ US | #109 |
| 2019 | 8 052 490 000 $ US | #106 |
| 2018 | 7 528 970 000 $ US | #111 |
| 2017 | 7 251 400 000 $ US | #106 |
| 2016 | 6 884 540 000 $ US | #104 |
| 2015 | 6 911 040 000 $ US | #105 |
| 2014 | 6 677 020 000 $ US | #111 |
| 2013 | 6 536 790 000 $ US | #110 |
| 2012 | 6 110 250 000 $ US | #110 |
| 2011 | 5 878 600 000 $ US | #113 |
| 2010 | 4 971 100 000 $ US | #114 |
| 2009 | 4 215 800 000 $ US | #114 |
| 2008 | 4 809 800 000 $ US | #115 |
| 2007 | 4 349 400 000 $ US | #113 |
| 2006 | 4 150 320 000 $ US | #109 |
| 2005 | 3 713 680 000 $ US | #108 |
| 2004 | 3 555 578 400 $ US | #103 |
| 2003 | 3 433 269 900 $ US | #95 |
| 2002 | 3 231 026 200 $ US | #92 |
| 2001 | 3 071 774 700 $ US | #92 |
| 2000 | 3 161 574 400 $ US | #90 |
| 1999 | 2 752 938 000 $ US | #92 |
| 1998 | 2 667 080 400 $ US | #93 |
| 1997 | 2 659 875 600 $ US | #95 |
| 1996 | 2 026 644 400 $ US | #98 |
| 1995 | 1 923 081 200 $ US | #97 |
| 1994 | 1 529 942 400 $ US | #95 |
| 1993 | 1 294 122 000 $ US | #95 |
| 1992 | 937 870 800 $ US | #100 |
| 1991 | 904 756 600 $ US | #103 |
| 1990 | 891 100 175 $ US | #101 |
| 1989 | 578 784 600 $ US | #96 |
| 1988 | 662 448 600 $ US | #91 |
| 1987 | 751 724 100 $ US | #90 |
| 1986 | 930 400 000 $ US | #83 |
| 1985 | 848 385 400 $ US | #81 |
| 1984 | 796 567 700 $ US | #83 |
| 1983 | 858 652 600 $ US | #82 |
| 1982 | 774 247 000 $ US | #83 |
| 1981 | 917 000 000 $ US | #82 |
| 1980 | 1 220 920 000 $ US | #73 |
| 1979 | 1 280 560 000 $ US | #61 |
| 1978 | 946 719 900 $ US | #66 |
| 1977 | 1 122 680 000 $ US | #61 |
| 1976 | 827 560 000 $ US | #64 |
| 1975 | 622 640 000 $ US | #66 |
| 1974 | 540 040 000 $ US | #68 |
| 1973 | 432 120 000 $ US | #66 |
| 1972 | 367 680 000 $ US | #64 |
| 1971 | 292 160 000 $ US | #63 |
| 1970 | 281 360 000 $ US | #65 |
| 1969 | 243 320 000 $ US | - |
| 1968 | 255 960 000 $ US | - |
| 1967 | 250 280 000 $ US | - |
| 1966 | 229 240 000 $ US | - |
| 1965 | 231 600 000 $ US | - |
En 2025, les exportations de biens et services du Salvador s'élevaient à 11,8 milliards de dollars, contre 232 millions de dollars en 1965. Le minimum a été de 229 millions de dollars, en 1966. Elles se classaient au 107e rang mondial, en baisse par rapport au 105e rang en 2024. Leur meilleur rang a été le 61e, occupé pour la dernière fois en 1979.
En 2025, les exportations de biens et services du Salvador étaient les 17es plus élevées de 27 pays situés en Amérique latine (à égalité avec la Bolivie). Les importations de biens et services du Salvador s'élevaient à 20,6 milliards de dollars en 2025, au 91e rang mondial. En 2025, les importations du Salvador dépassaient ses exportations de 8,83 milliards de dollars, soit un déficit commercial.
Exportations de biens du Salvador par catégorie, 2025
Exportations de biens, 2025: 6,43 Md $US
En 2025, la première catégorie des exportations de biens du Salvador était « textiles, vêtements, chaussures, meubles et jouets », avec 32,5 %, suivie de « aliments transformés, huiles, aliments pour animaux, boissons et tabac », avec 17,8 %.
Destinations des exportations de biens du Salvador : les 10 premières, 2025
| Rang | Pays | Exportations de biens | Part | |
|---|---|---|---|---|
| 1 |
 États-Unis |
2,11 Md $US | 32,8 % | |
| 2 |
 Guatemala |
1,26 Md $US | 19,6 % | vs Guatemala |
| 3 |
 Honduras |
1,08 Md $US | 16,7 % | vs Honduras |
| 4 |
 Nicaragua |
586 M $US | 9,12 % | |
| 5 |
 Costa Rica |
286 M $US | 4,45 % | vs Costa Rica |
| 6 |
 Mexique |
252 M $US | 3,92 % | vs Mexique |
| 7 |
 Panama |
123 M $US | 1,92 % | |
| 8 |
 Rép. dominicaine |
110 M $US | 1,71 % | |
| 9 |
 Espagne |
71,6 M $US | 1,11 % | |
| 10 |
 Belgique |
54,8 M $US | 0,85 % | |
| Autres partenaires et non précisés | 495 M $US | 7,69 % |
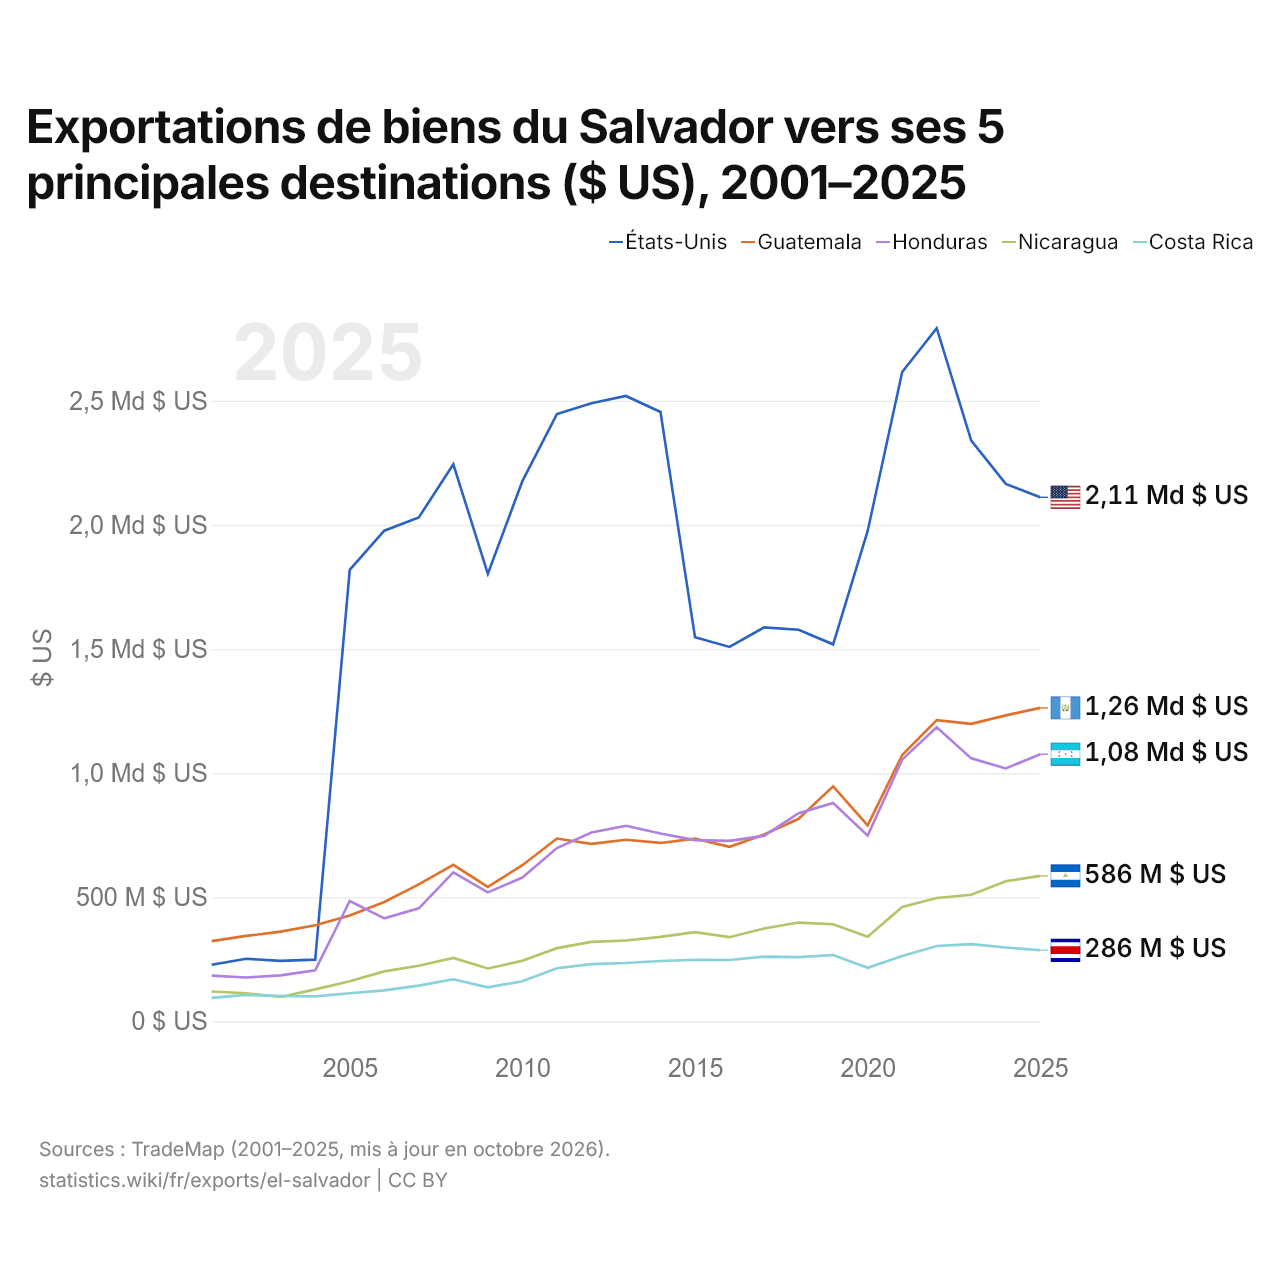
Exportations de biens du Salvador vers ses 5 principales destinations ($ US), 2001–2025
| Année | $ US | ||||
|---|---|---|---|---|---|
| États-Unis | Guatemala | Honduras | Nicaragua | Costa Rica | |
| 2025 | 2 110 912 000 $ US | 1 262 865 000 $ US | 1 076 168 000 $ US | 586 115 000 $ US | 286 265 000 $ US |
| 2024 | 2 164 674 000 $ US | 1 232 561 000 $ US | 1 018 837 000 $ US | 564 197 000 $ US | 297 400 000 $ US |
| 2023 | 2 339 327 000 $ US | 1 198 591 000 $ US | 1 059 187 000 $ US | 509 791 000 $ US | 311 233 000 $ US |
| 2022 | 2 792 348 000 $ US | 1 213 277 000 $ US | 1 184 754 000 $ US | 496 734 000 $ US | 303 491 000 $ US |
| 2021 | 2 615 698 000 $ US | 1 073 015 000 $ US | 1 054 593 000 $ US | 460 285 000 $ US | 263 023 000 $ US |
| 2020 | 1 975 114 000 $ US | 789 084 000 $ US | 747 928 000 $ US | 341 034 000 $ US | 215 713 000 $ US |
| 2019 | 1 518 575 000 $ US | 946 569 000 $ US | 879 510 000 $ US | 390 994 000 $ US | 267 126 000 $ US |
| 2018 | 1 577 645 000 $ US | 815 760 000 $ US | 838 522 000 $ US | 397 923 000 $ US | 258 566 000 $ US |
| 2017 | 1 586 761 000 $ US | 752 738 000 $ US | 747 182 000 $ US | 374 030 000 $ US | 260 712 000 $ US |
| 2016 | 1 508 198 000 $ US | 703 061 000 $ US | 727 084 000 $ US | 338 987 000 $ US | 247 044 000 $ US |
| 2015 | 1 547 227 000 $ US | 735 720 000 $ US | 729 957 000 $ US | 359 604 000 $ US | 248 049 000 $ US |
| 2014 | 2 454 638 000 $ US | 718 582 000 $ US | 756 818 000 $ US | 340 154 000 $ US | 243 000 000 $ US |
| 2013 | 2 519 229 000 $ US | 731 566 000 $ US | 787 886 000 $ US | 325 547 000 $ US | 234 887 000 $ US |
| 2012 | 2 489 724 000 $ US | 714 709 000 $ US | 760 987 000 $ US | 320 183 000 $ US | 230 480 000 $ US |
| 2011 | 2 446 464 000 $ US | 736 339 000 $ US | 698 129 000 $ US | 294 816 000 $ US | 213 636 000 $ US |
| 2010 | 2 176 017 000 $ US | 628 854 000 $ US | 579 376 000 $ US | 244 021 000 $ US | 161 369 000 $ US |
| 2009 | 1 802 683 000 $ US | 541 538 000 $ US | 519 518 000 $ US | 213 028 000 $ US | 137 126 000 $ US |
| 2008 | 2 243 991 000 $ US | 630 293 000 $ US | 600 197 000 $ US | 255 740 000 $ US | 169 489 000 $ US |
| 2007 | 2 029 800 000 $ US | 551 482 000 $ US | 455 079 000 $ US | 223 780 000 $ US | 143 719 000 $ US |
| 2006 | 1 976 637 000 $ US | 480 575 000 $ US | 414 779 000 $ US | 201 180 000 $ US | 124 729 000 $ US |
| 2005 | 1 818 393 000 $ US | 426 473 000 $ US | 484 876 000 $ US | 161 287 000 $ US | 113 212 000 $ US |
| 2004 | 248 371 000 $ US | 386 801 000 $ US | 205 520 000 $ US | 128 632 000 $ US | 100 387 000 $ US |
| 2003 | 243 828 000 $ US | 361 250 000 $ US | 184 891 000 $ US | 98 054 000 $ US | 102 028 000 $ US |
| 2002 | 252 055 000 $ US | 343 967 000 $ US | 176 611 000 $ US | 113 216 000 $ US | 106 628 000 $ US |
| 2001 | 227 794 000 $ US | 323 378 000 $ US | 184 456 000 $ US | 120 260 000 $ US | 94 617 000 $ US |
En 2025, les exportations de biens s'élevaient à 2,11 milliards de dollars vers les États-Unis, 1,26 milliard de dollars vers le Guatemala, 1,08 milliard de dollars vers le Honduras, 586 millions de dollars vers le Nicaragua et 286 millions de dollars vers le Costa Rica. Le premier rang des cinq destinations du Salvador est occupé par les États-Unis depuis 2005. Le changement le plus récent dans leur ordre remonte à 2019, quand les exportations du Salvador vers le Guatemala ont dépassé celles vers le Honduras.
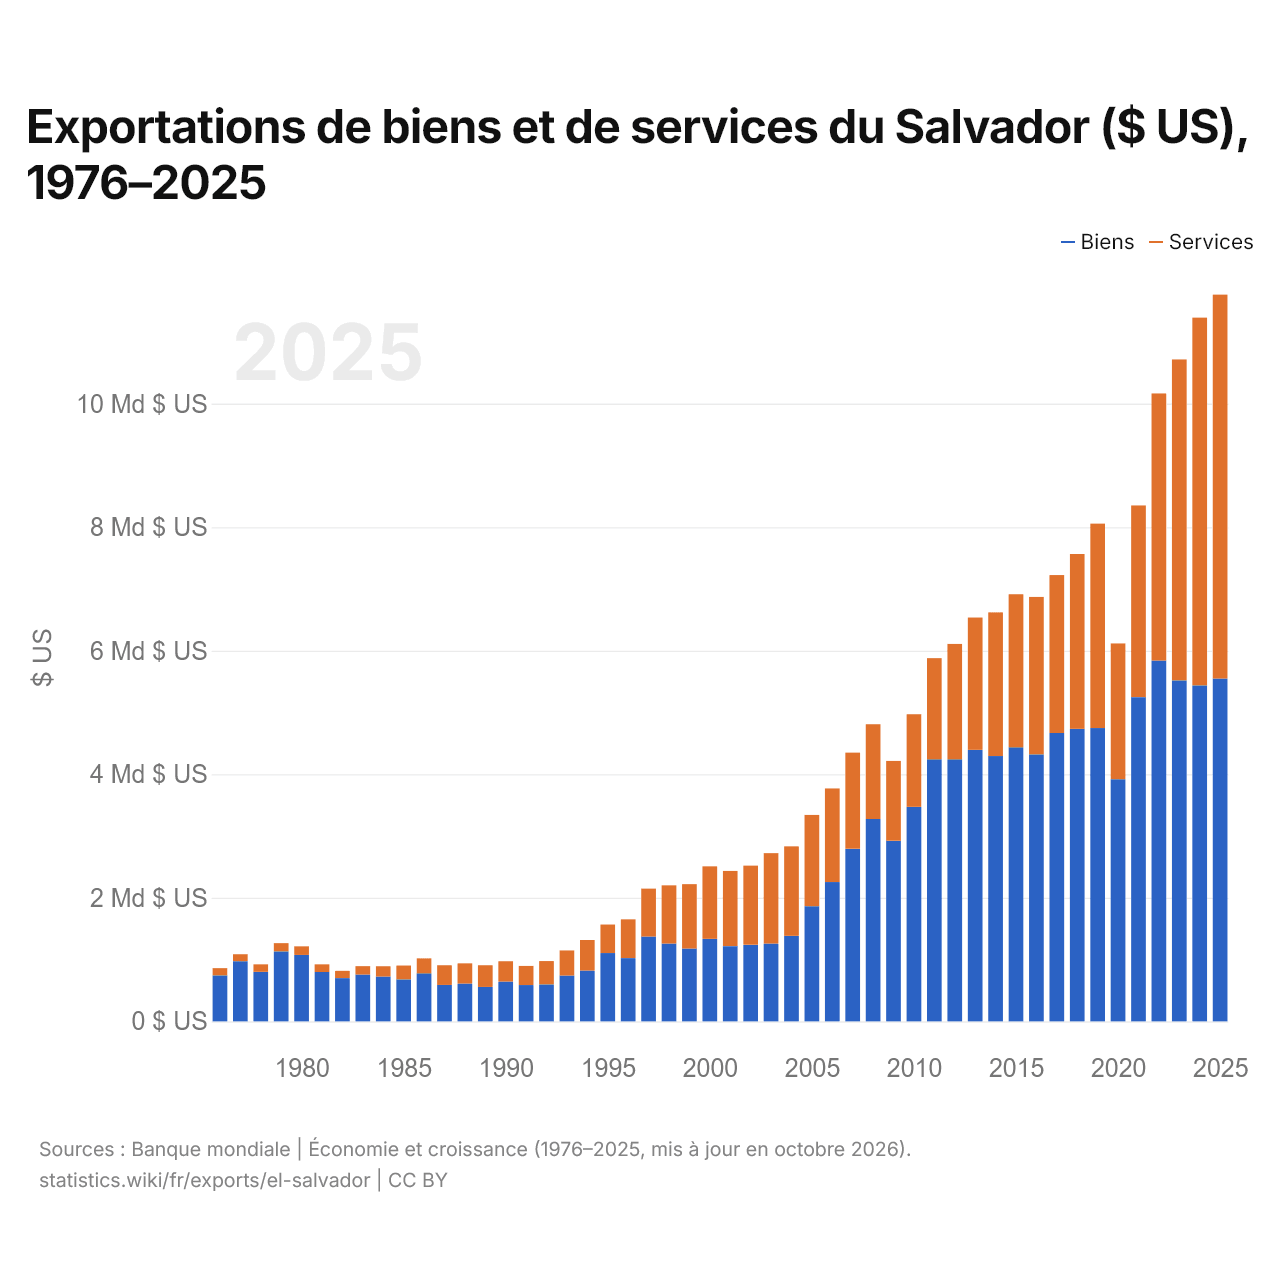
Exportations de biens et de services du Salvador ($ US), 1976–2025
| Année | $ US | |
|---|---|---|
| Biens | Services | |
| 2025 | 5 550 177 653 $ US | 6 213 512 532 $ US |
| 2024 | 5 439 082 475 $ US | 5 952 582 741 $ US |
| 2023 | 5 520 612 706 $ US | 5 195 000 071 $ US |
| 2022 | 5 841 639 356 $ US | 4 322 281 858 $ US |
| 2021 | 5 247 580 779 $ US | 3 103 810 004 $ US |
| 2020 | 3 919 625 501 $ US | 2 197 220 961 $ US |
| 2019 | 4 747 910 177 $ US | 3 308 799 499 $ US |
| 2018 | 4 735 593 478 $ US | 2 829 386 374 $ US |
| 2017 | 4 667 395 107 $ US | 2 557 317 347 $ US |
| 2016 | 4 322 313 880 $ US | 2 548 882 978 $ US |
| 2015 | 4 436 976 012 $ US | 2 477 082 456 $ US |
| 2014 | 4 294 427 682 $ US | 2 325 778 303 $ US |
| 2013 | 4 394 930 263 $ US | 2 141 858 536 $ US |
| 2012 | 4 242 229 301 $ US | 1 868 022 338 $ US |
| 2011 | 4 242 593 851 $ US | 1 635 961 955 $ US |
| 2010 | 3 473 156 739 $ US | 1 497 961 215 $ US |
| 2009 | 2 923 576 030 $ US | 1 292 215 503 $ US |
| 2008 | 3 275 500 000 $ US | 1 534 250 000 $ US |
| 2007 | 2 793 700 000 $ US | 1 555 560 000 $ US |
| 2006 | 2 254 700 000 $ US | 1 515 970 000 $ US |
| 2005 | 1 864 100 000 $ US | 1 478 030 000 $ US |
| 2004 | 1 384 481 000 $ US | 1 447 869 173 $ US |
| 2003 | 1 257 800 000 $ US | 1 463 991 937 $ US |
| 2002 | 1 240 600 000 $ US | 1 279 900 000 $ US |
| 2001 | 1 216 800 000 $ US | 1 217 800 000 $ US |
| 2000 | 1 334 900 000 $ US | 1 174 000 000 $ US |
| 1999 | 1 179 000 000 $ US | 1 041 000 000 $ US |
| 1998 | 1 259 280 411 $ US | 941 861 793 $ US |
| 1997 | 1 372 962 170 $ US | 776 017 131 $ US |
| 1996 | 1 022 958 310 $ US | 627 869 789 $ US |
| 1995 | 1 104 792 728 $ US | 462 157 917 $ US |
| 1994 | 820 850 637 $ US | 495 832 737 $ US |
| 1993 | 741 740 169 $ US | 405 630 178 $ US |
| 1992 | 598 146 118 $ US | 377 115 519 $ US |
| 1991 | 586 777 547 $ US | 310 914 761 $ US |
| 1990 | 643 879 289 $ US | 329 233 390 $ US |
| 1989 | 557 500 000 $ US | 351 020 000 $ US |
| 1988 | 610 640 000 $ US | 328 000 000 $ US |
| 1987 | 589 600 000 $ US | 318 140 000 $ US |
| 1986 | 777 923 189 $ US | 241 068 392 $ US |
| 1985 | 678 960 000 $ US | 223 920 000 $ US |
| 1984 | 725 920 000 $ US | 165 400 000 $ US |
| 1983 | 757 960 000 $ US | 135 840 000 $ US |
| 1982 | 699 560 000 $ US | 117 400 000 $ US |
| 1981 | 798 040 000 $ US | 124 680 000 $ US |
| 1980 | 1 075 320 000 $ US | 138 840 000 $ US |
| 1979 | 1 132 320 000 $ US | 133 000 000 $ US |
| 1978 | 801 640 000 $ US | 120 960 000 $ US |
| 1977 | 973 520 000 $ US | 112 960 000 $ US |
| 1976 | 744 640 000 $ US | 116 120 000 $ US |
En 2025, les exportations de biens du Salvador s'élevaient à 5,55 milliards de dollars et celles de services à 6,21 milliards de dollars ; les services représentaient 52,8 % du total, contre 13,5 % en 1976.
Le Salvador dans le classement mondial des exportations, 2025







Exportations de biens et services du Salvador, % du PIB, 1965–2025
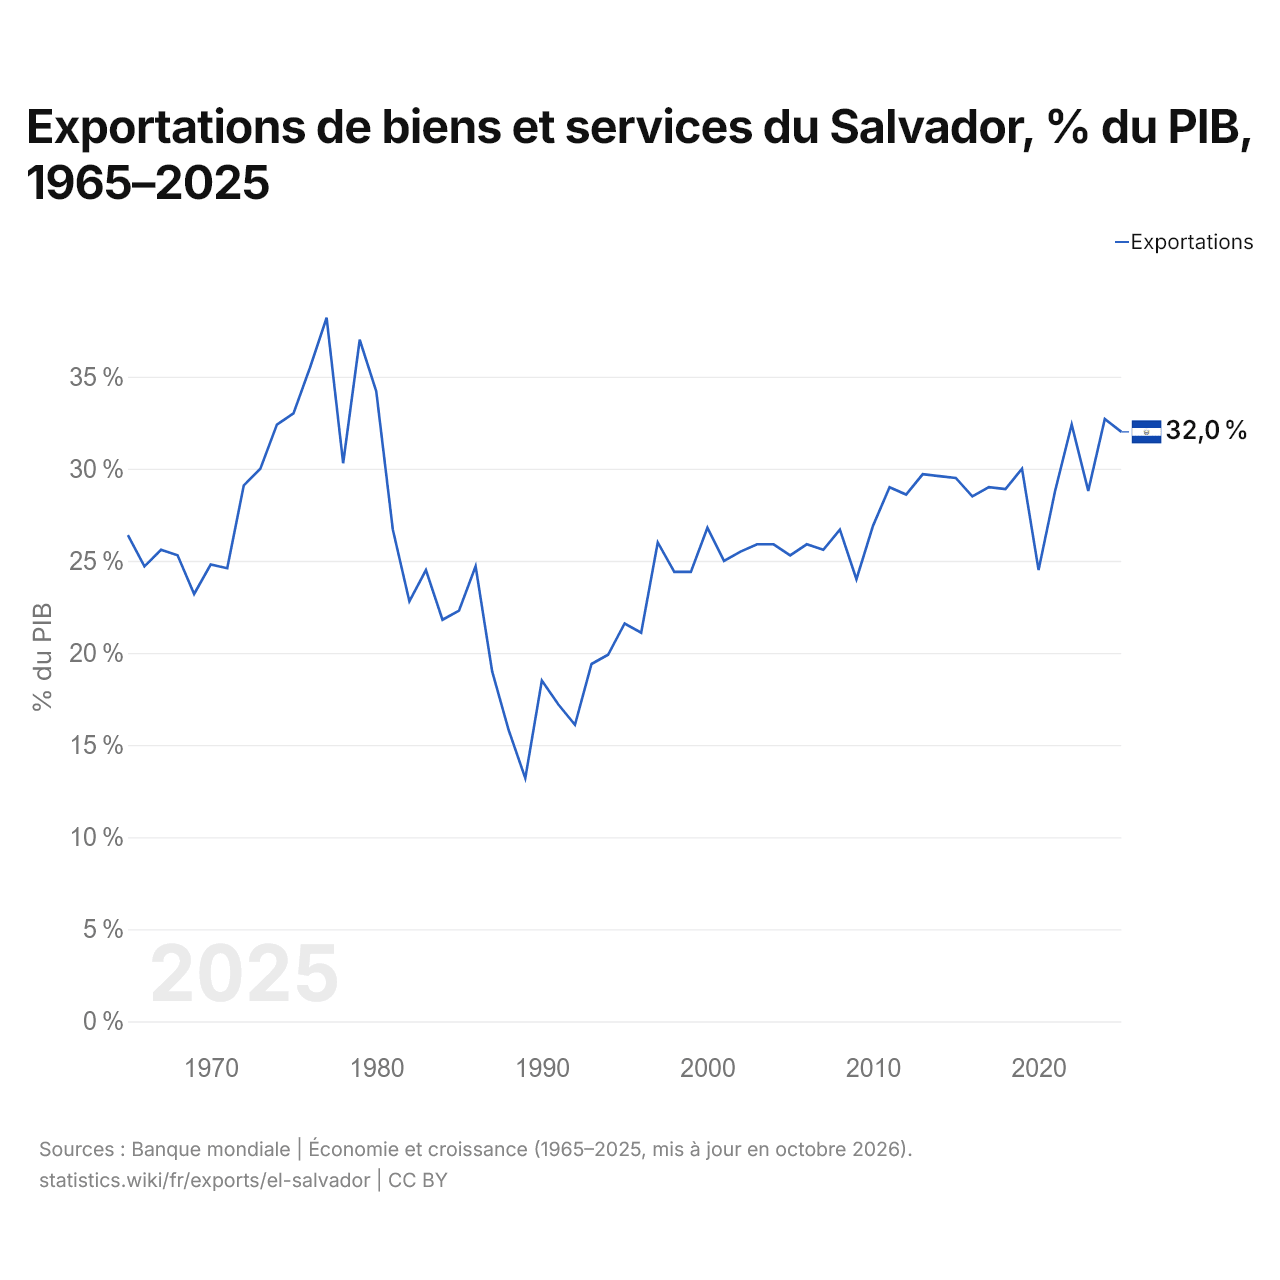
En 2025, les exportations de biens et services du Salvador équivalaient à 32,0 % de son PIB, contre 26,4 % en 1965. La part la plus élevée a été de 38,2 %, en 1977.
Comparer les exportations du Salvador avec celles d'autres pays
Sources :
- Banque mondiale | Économie et croissance (1965–2025, mis à jour en octobre 2026)
- TradeMap (2001–2025, mis à jour en octobre 2026)
Creative Commons Attribution (CC BY) : vous pouvez copier, partager, adapter et réutiliser ce contenu, y compris à des fins commerciales, à condition de citer statistics.wiki et d’indiquer les modifications apportées. Les sources citées ci-dessus peuvent avoir leurs propres conditions de licence.