
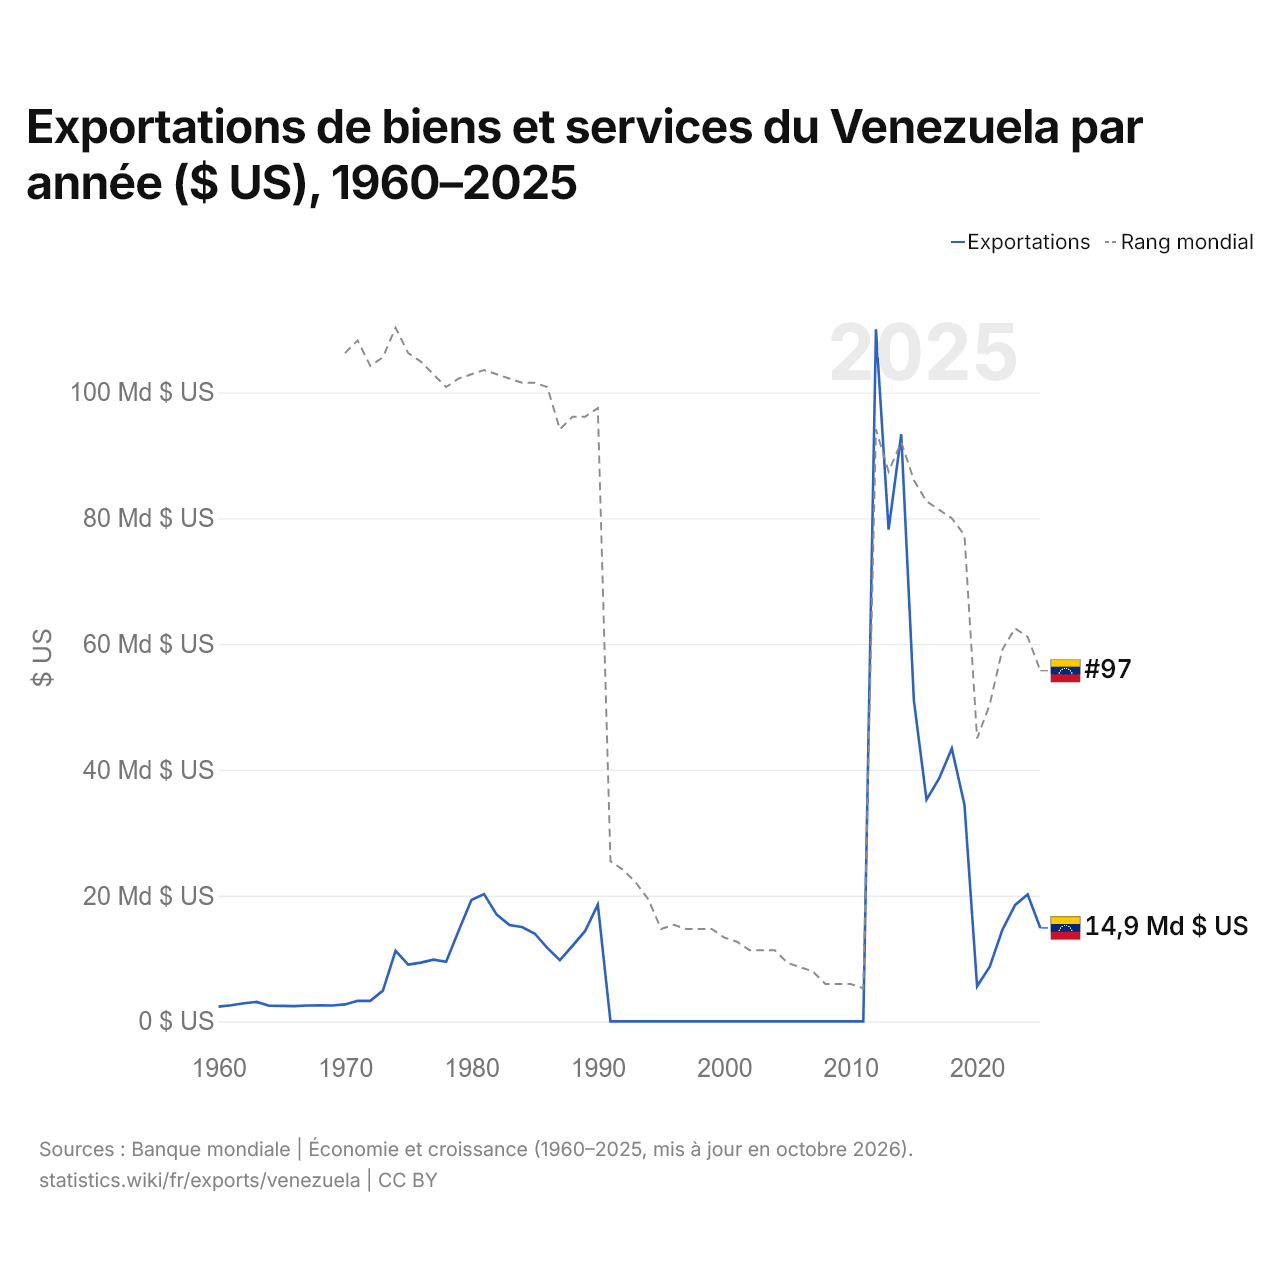
Exportations de biens et services du Venezuela par année ($ US), 1960–2025
| Année | $ US | Rang mondial |
|---|---|---|
| Exportations | Rang mondial | |
| 2025 | 14 852 682 003 $ US | #97 |
| 2024 | 20 176 779 559 $ US | #89 |
| 2023 | 18 495 894 770 $ US | #87 |
| 2022 | 14 552 860 356 $ US | #92 |
| 2021 | 8 690 436 504 $ US | #105 |
| 2020 | 5 571 267 854 $ US | #113 |
| 2019 | 34 459 561 493 $ US | #65 |
| 2018 | 43 392 568 659 $ US | #61 |
| 2017 | 38 630 825 248 $ US | #59 |
| 2016 | 35 237 270 127 $ US | #57 |
| 2015 | 51 045 259 321 $ US | #52 |
| 2014 | 93 349 895 633 $ US | #43 |
| 2013 | 78 189 405 110 $ US | #50 |
| 2012 | 110 049 401 395 $ US | #40 |
| 2011 | 0 $ US | #172 |
| 2010 | 0 $ US | #171 |
| 2009 | 0 $ US | #171 |
| 2008 | 0 $ US | #171 |
| 2007 | 0 $ US | #168 |
| 2006 | 0 $ US | #167 |
| 2005 | 0 $ US | #166 |
| 2004 | 0 $ US | #163 |
| 2003 | 0 $ US | #163 |
| 2002 | 0 $ US | #163 |
| 2001 | 0 $ US | #161 |
| 2000 | 0 $ US | #160 |
| 1999 | 0 $ US | #158 |
| 1998 | 0 $ US | #158 |
| 1997 | 0 $ US | #158 |
| 1996 | 0 $ US | #157 |
| 1995 | 0 $ US | #158 |
| 1994 | 0 $ US | #151 |
| 1993 | 0 $ US | #147 |
| 1992 | 0 $ US | #144 |
| 1991 | 0 $ US | #142 |
| 1990 | 18 555 857 828 $ US | #35 |
| 1989 | 14 376 184 482 $ US | #37 |
| 1988 | 12 017 951 724 $ US | #37 |
| 1987 | 9 720 924 138 $ US | #40 |
| 1986 | 11 675 344 330 $ US | #30 |
| 1985 | 13 973 026 667 $ US | #29 |
| 1984 | 15 003 121 140 $ US | #29 |
| 1983 | 15 325 488 372 $ US | #28 |
| 1982 | 16 968 302 326 $ US | #27 |
| 1981 | 20 231 441 860 $ US | #26 |
| 1980 | 19 286 255 814 $ US | #27 |
| 1979 | 14 447 813 953 $ US | #28 |
| 1978 | 9 474 348 837 $ US | #30 |
| 1977 | 9 811 906 977 $ US | #27 |
| 1976 | 9 339 325 581 $ US | #24 |
| 1975 | 9 024 255 814 $ US | #22 |
| 1974 | 11 207 186 047 $ US | #16 |
| 1973 | 4 883 441 860 $ US | #23 |
| 1972 | 3 254 954 545 $ US | #25 |
| 1971 | 3 276 954 545 $ US | #19 |
| 1970 | 2 688 022 222 $ US | #22 |
| 1969 | 2 516 000 000 $ US | - |
| 1968 | 2 537 488 889 $ US | - |
| 1967 | 2 516 000 000 $ US | - |
| 1966 | 2 429 977 778 $ US | - |
| 1965 | 2 451 466 667 $ US | - |
| 1964 | 2 471 908 046 $ US | - |
| 1963 | 3 078 813 813 $ US | - |
| 1962 | 2 880 107 474 $ US | - |
| 1961 | 2 558 575 054 $ US | - |
| 1960 | 2 332 409 504 $ US | - |
En 2025, les exportations de biens et services du Venezuela s'élevaient à 14,9 milliards de dollars, contre 2,33 milliards de dollars en 1960. Le maximum a été de 110 milliards de dollars, en 2012. Elles se classaient au 97e rang mondial, en baisse par rapport au 89e rang en 2024. Leur meilleur rang a été le 16e, occupé pour la dernière fois en 1974.
En 2025, les exportations de biens et services du Venezuela étaient les 14es plus élevées de 27 pays situés en Amérique latine. Les importations de biens et services du Venezuela s'élevaient à 10,1 milliards de dollars en 2025, au 118e rang mondial. En 2025, les exportations du Venezuela dépassaient ses importations de 4,78 milliards de dollars, soit un excédent commercial.
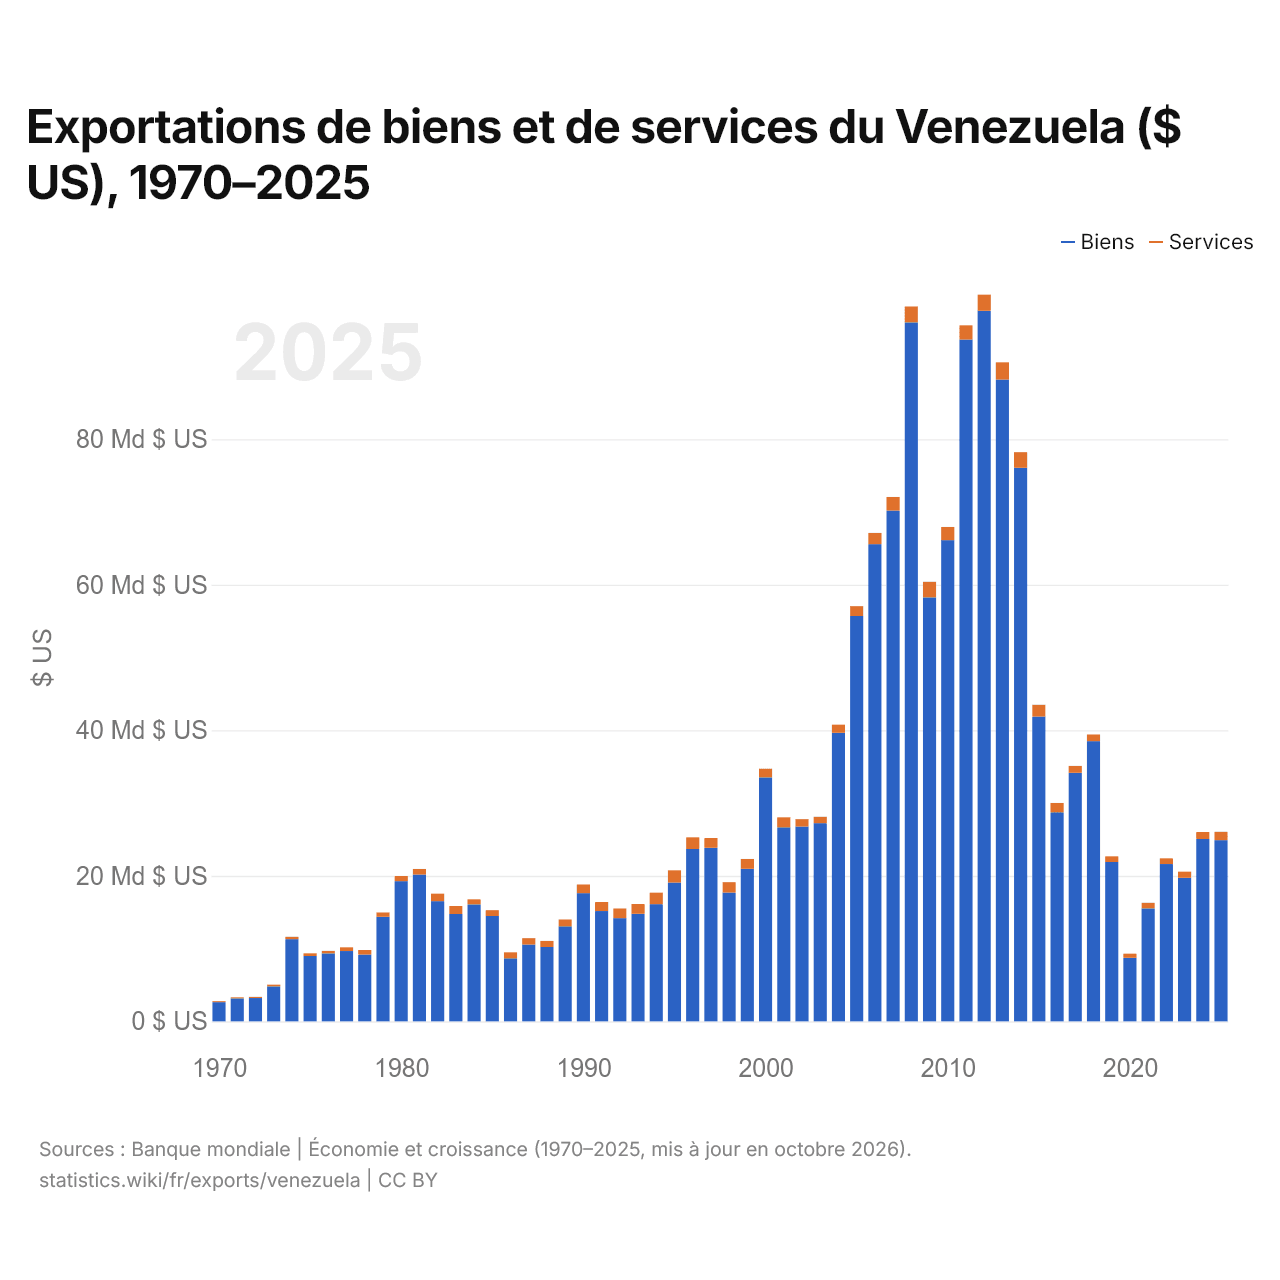
Exportations de biens et de services du Venezuela ($ US), 1970–2025
| Année | $ US | |
|---|---|---|
| Biens | Services | |
| 2025 | 24 907 000 000 $ US | 1 137 000 000 $ US |
| 2024 | 25 067 000 000 $ US | 945 000 000 $ US |
| 2023 | 19 727 000 000 $ US | 850 000 000 $ US |
| 2022 | 21 614 000 000 $ US | 784 000 000 $ US |
| 2021 | 15 523 000 000 $ US | 763 000 000 $ US |
| 2020 | 8 720 000 000 $ US | 571 000 000 $ US |
| 2019 | 21 901 000 000 $ US | 779 000 000 $ US |
| 2018 | 38 504 000 000 $ US | 921 000 000 $ US |
| 2017 | 34 146 000 000 $ US | 956 000 000 $ US |
| 2016 | 28 733 000 000 $ US | 1 279 000 000 $ US |
| 2015 | 41 879 000 000 $ US | 1 626 000 000 $ US |
| 2014 | 76 086 000 000 $ US | 2 130 000 000 $ US |
| 2013 | 88 194 000 000 $ US | 2 378 000 000 $ US |
| 2012 | 97 665 000 000 $ US | 2 201 000 000 $ US |
| 2011 | 93 691 000 000 $ US | 1 963 000 000 $ US |
| 2010 | 66 124 000 000 $ US | 1 814 000 000 $ US |
| 2009 | 58 261 000 000 $ US | 2 147 000 000 $ US |
| 2008 | 96 053 000 000 $ US | 2 187 000 000 $ US |
| 2007 | 70 193 000 000 $ US | 1 869 000 000 $ US |
| 2006 | 65 574 000 000 $ US | 1 548 000 000 $ US |
| 2005 | 55 712 000 000 $ US | 1 346 000 000 $ US |
| 2004 | 39 664 000 000 $ US | 1 118 000 000 $ US |
| 2003 | 27 226 000 000 $ US | 882 000 000 $ US |
| 2002 | 26 777 000 000 $ US | 1 017 000 000 $ US |
| 2001 | 26 663 000 000 $ US | 1 380 000 000 $ US |
| 2000 | 33 525 000 000 $ US | 1 186 000 000 $ US |
| 1999 | 20 959 000 000 $ US | 1 356 000 000 $ US |
| 1998 | 17 703 000 000 $ US | 1 427 000 000 $ US |
| 1997 | 23 867 000 000 $ US | 1 318 000 000 $ US |
| 1996 | 23 692 000 000 $ US | 1 588 000 000 $ US |
| 1995 | 19 068 000 000 $ US | 1 685 000 000 $ US |
| 1994 | 16 092 000 000 $ US | 1 589 000 000 $ US |
| 1993 | 14 765 000 000 $ US | 1 354 000 000 $ US |
| 1992 | 14 187 000 000 $ US | 1 327 000 000 $ US |
| 1991 | 15 155 000 000 $ US | 1 233 000 000 $ US |
| 1990 | 17 620 000 000 $ US | 1 186 000 000 $ US |
| 1989 | 13 056 000 000 $ US | 932 000 000 $ US |
| 1988 | 10 217 000 000 $ US | 835 000 000 $ US |
| 1987 | 10 564 000 000 $ US | 864 000 000 $ US |
| 1986 | 8 664 000 000 $ US | 828 000 000 $ US |
| 1985 | 14 478 000 000 $ US | 797 000 000 $ US |
| 1984 | 16 075 000 000 $ US | 688 000 000 $ US |
| 1983 | 14 759 000 000 $ US | 1 082 000 000 $ US |
| 1982 | 16 516 000 000 $ US | 1 041 000 000 $ US |
| 1981 | 20 181 000 000 $ US | 757 000 000 $ US |
| 1980 | 19 275 000 000 $ US | 693 000 000 $ US |
| 1979 | 14 360 000 000 $ US | 599 000 000 $ US |
| 1978 | 9 174 000 000 $ US | 629 000 000 $ US |
| 1977 | 9 661 000 000 $ US | 504 000 000 $ US |
| 1976 | 9 342 000 000 $ US | 341 000 000 $ US |
| 1975 | 8 982 000 000 $ US | 370 000 000 $ US |
| 1974 | 11 290 000 000 $ US | 325 000 000 $ US |
| 1973 | 4 803 000 000 $ US | 247 000 000 $ US |
| 1972 | 3 202 000 000 $ US | 159 000 000 $ US |
| 1971 | 3 152 000 000 $ US | 148 000 000 $ US |
| 1970 | 2 640 000 000 $ US | 139 000 000 $ US |
En 2025, les exportations de biens du Venezuela s'élevaient à 24,9 milliards de dollars et celles de services à 1,14 milliard de dollars ; les services représentaient 4,4 % du total, contre 5,0 % en 1970.
Le Venezuela dans le classement mondial des exportations, 2025







Exportations de biens et services du Venezuela, % du PIB, 1960–2025
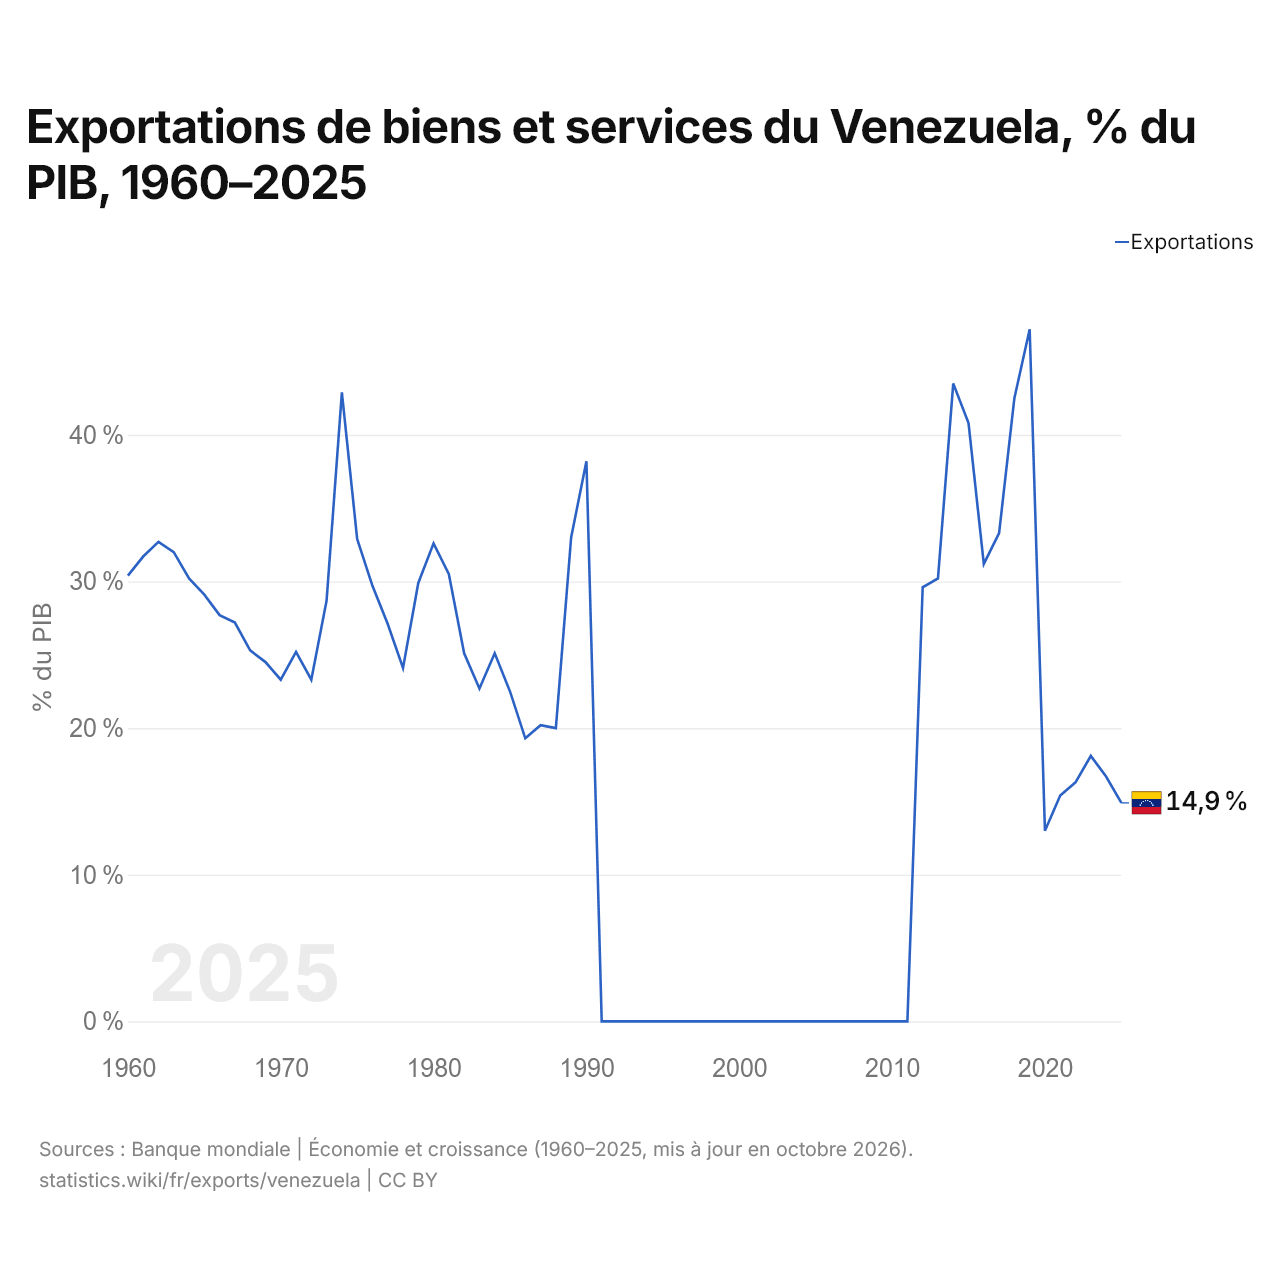
En 2025, les exportations de biens et services du Venezuela équivalaient à 14,9 % de son PIB, contre 30,4 % en 1960. La part la plus élevée a été de 47,2 %, en 2019.
Comparer les exportations du Venezuela avec celles d'autres pays
Sources :
- Banque mondiale | Économie et croissance (1960–2025, mis à jour en octobre 2026)
- TradeMap (2013, mis à jour en octobre 2026)
Creative Commons Attribution (CC BY) : vous pouvez copier, partager, adapter et réutiliser ce contenu, y compris à des fins commerciales, à condition de citer statistics.wiki et d’indiquer les modifications apportées. Les sources citées ci-dessus peuvent avoir leurs propres conditions de licence.