
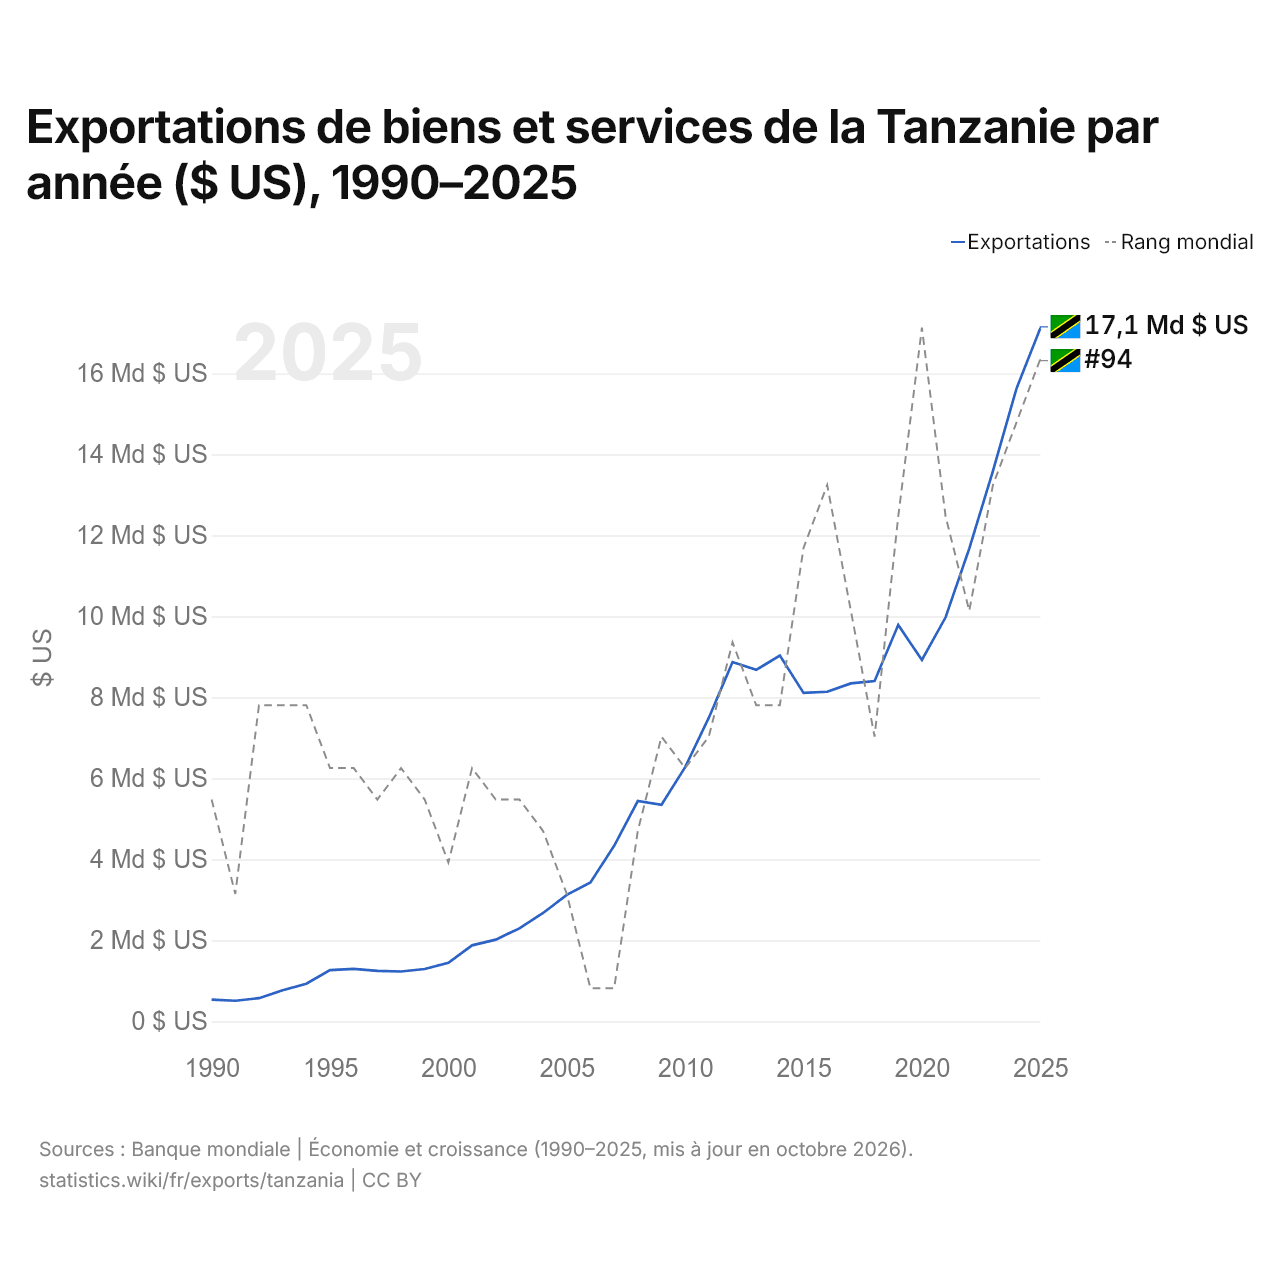
Exportations de biens et services de la Tanzanie par année ($ US), 1990–2025
| Année | $ US | Rang mondial |
|---|---|---|
| Exportations | Rang mondial | |
| 2025 | 17 113 455 948 $ US | #94 |
| 2024 | 15 635 226 302 $ US | #96 |
| 2023 | 13 589 709 118 $ US | #98 |
| 2022 | 11 675 750 363 $ US | #102 |
| 2021 | 9 976 590 469 $ US | #99 |
| 2020 | 8 921 839 002 $ US | #93 |
| 2019 | 9 786 702 082 $ US | #99 |
| 2018 | 8 401 858 983 $ US | #106 |
| 2017 | 8 344 707 045 $ US | #102 |
| 2016 | 8 138 103 521 $ US | #98 |
| 2015 | 8 110 109 049 $ US | #100 |
| 2014 | 9 032 206 214 $ US | #105 |
| 2013 | 8 679 120 270 $ US | #105 |
| 2012 | 8 870 630 510 $ US | #103 |
| 2011 | 7 497 823 535 $ US | #106 |
| 2010 | 6 276 937 179 $ US | #107 |
| 2009 | 5 349 218 508 $ US | #106 |
| 2008 | 5 439 934 817 $ US | #109 |
| 2007 | 4 335 060 982 $ US | #114 |
| 2006 | 3 428 845 589 $ US | #114 |
| 2005 | 3 124 155 526 $ US | #111 |
| 2004 | 2 675 290 129 $ US | #109 |
| 2003 | 2 295 888 514 $ US | #108 |
| 2002 | 2 017 946 247 $ US | #108 |
| 2001 | 1 876 854 721 $ US | #107 |
| 2000 | 1 445 863 126 $ US | #110 |
| 1999 | 1 291 630 219 $ US | #108 |
| 1998 | 1 230 116 907 $ US | #107 |
| 1997 | 1 246 175 398 $ US | #108 |
| 1996 | 1 295 157 276 $ US | #107 |
| 1995 | 1 265 179 894 $ US | #107 |
| 1994 | 929 865 170 $ US | #105 |
| 1993 | 765 667 146 $ US | #105 |
| 1992 | 572 500 411 $ US | #105 |
| 1991 | 508 648 083 $ US | #111 |
| 1990 | 537 502 279 $ US | #108 |
En 2025, les exportations de biens et services de la Tanzanie s'élevaient à 17,1 milliards de dollars, contre 538 millions de dollars en 1990. Le minimum a été de 509 millions de dollars, en 1991. Elles se classaient au 94e rang mondial, en hausse par rapport au 96e rang en 2024. Leur meilleur rang a été le 93e, occupé pour la dernière fois en 2020.
En 2025, les exportations de biens et services de la Tanzanie étaient les 12es plus élevées de 50 pays situés en Afrique. Les importations de biens et services de la Tanzanie s'élevaient à 18 milliards de dollars en 2025, au 95e rang mondial. En 2025, les importations de la Tanzanie dépassaient ses exportations de 903 millions de dollars, soit un déficit commercial.
Exportations de biens de la Tanzanie par catégorie, 2025
Exportations de biens, 2025: 10,1 Md $US
En 2025, la première catégorie des exportations de biens de la Tanzanie était « métaux précieux, pierres précieuses, bijoux, montres, instruments de musique et art », avec 49,2 %, suivie de « cultures, plantes et fleurs (céréales, fruits, légumes, café, oléagineux) », avec 18,3 %.
Destinations des exportations de biens de la Tanzanie : les 10 premières, 2025
| Rang | Pays | Exportations de biens | Part | |
|---|---|---|---|---|
| 1 |
 Afrique du Sud |
2,91 Md $US | 28,8 % | |
| 2 |
 EAU |
1,32 Md $US | 13,1 % | |
| 3 |
 Inde |
938 M $US | 9,31 % | |
| 4 |
 Chine |
513 M $US | 5,08 % | |
| 5 |
 Suisse |
433 M $US | 4,29 % | |
| 6 |
 Kenya |
419 M $US | 4,16 % | vs Kenya |
| 7 |
 Belgique |
356 M $US | 3,53 % | |
| 8 |
 Singapour |
328 M $US | 3,26 % | |
| 9 |
 RDC |
286 M $US | 2,84 % | vs RDC |
| 10 |
 Rwanda |
252 M $US | 2,5 % | vs Rwanda |
| Autres partenaires et non précisés | 2,32 Md $US | 23,1 % |
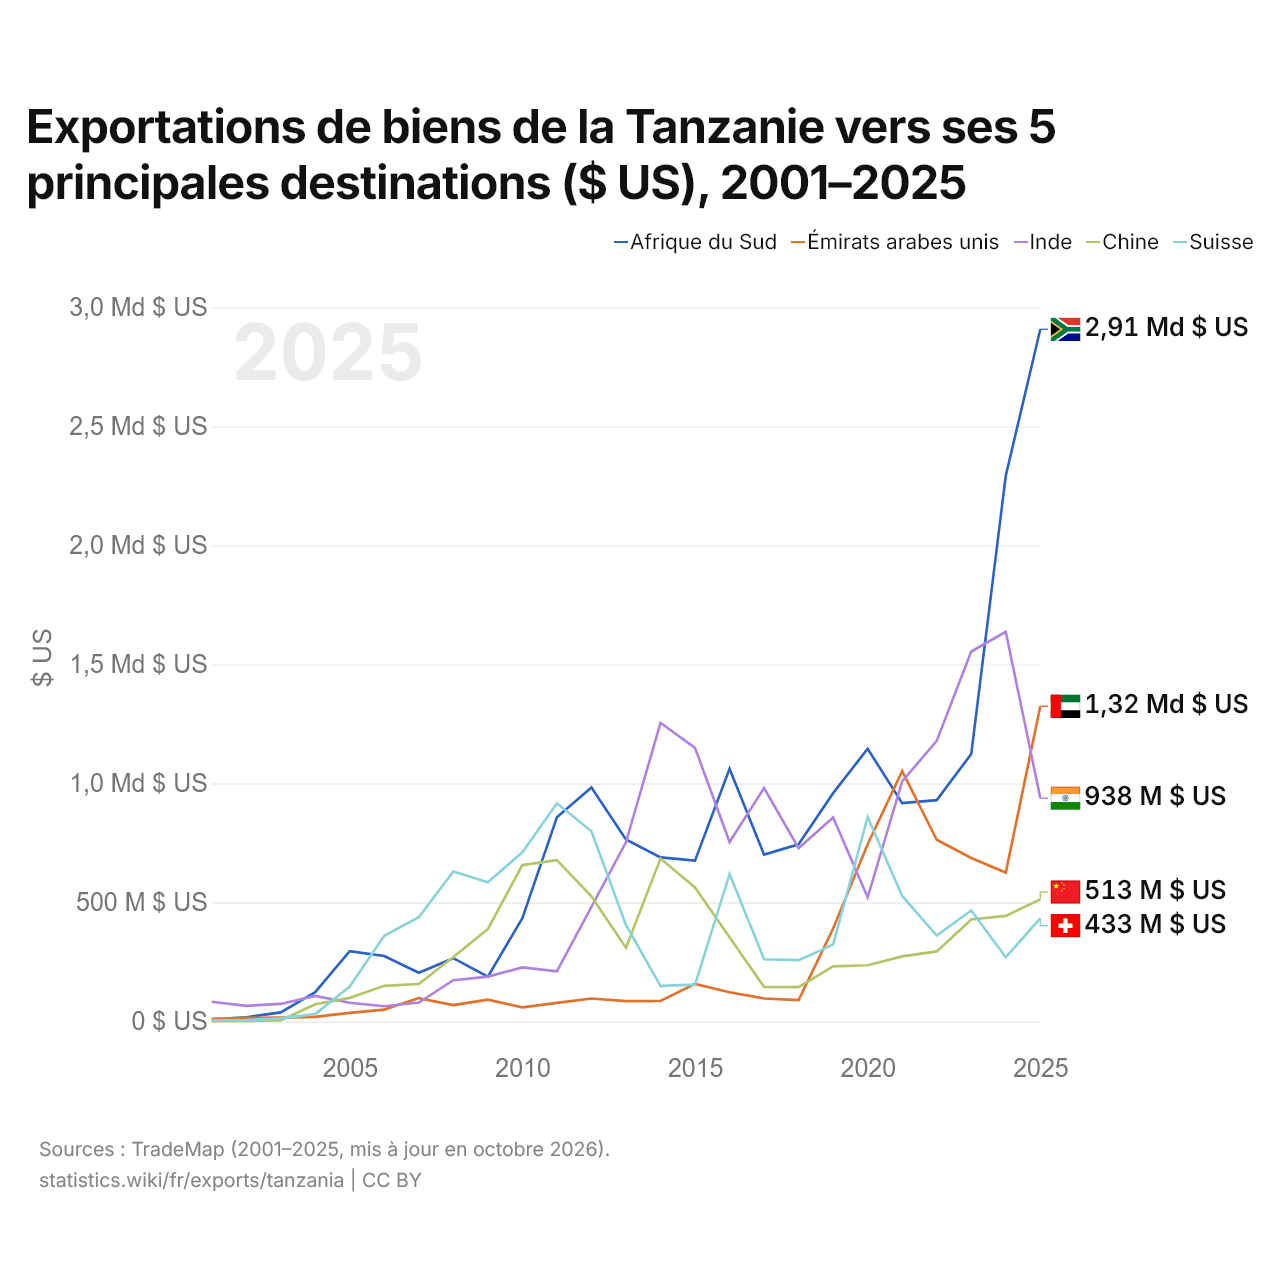
Exportations de biens de la Tanzanie vers ses 5 principales destinations ($ US), 2001–2025
| Année | $ US | ||||
|---|---|---|---|---|---|
| Afrique du Sud | Émirats arabes unis | Inde | Chine | Suisse | |
| 2025 | 2 908 260 000 $ US | 1 323 825 000 $ US | 938 031 000 $ US | 512 595 000 $ US | 432 661 000 $ US |
| 2024 | 2 292 707 000 $ US | 625 152 000 $ US | 1 637 028 000 $ US | 442 964 000 $ US | 269 528 000 $ US |
| 2023 | 1 123 455 000 $ US | 686 436 000 $ US | 1 553 952 000 $ US | 427 893 000 $ US | 465 880 000 $ US |
| 2022 | 929 576 000 $ US | 762 971 000 $ US | 1 178 557 000 $ US | 293 716 000 $ US | 360 403 000 $ US |
| 2021 | 916 675 000 $ US | 1 051 734 000 $ US | 1 008 694 000 $ US | 273 095 000 $ US | 526 945 000 $ US |
| 2020 | 1 145 458 000 $ US | 744 324 000 $ US | 521 021 000 $ US | 235 605 000 $ US | 858 701 000 $ US |
| 2019 | 958 868 000 $ US | 390 026 000 $ US | 856 478 000 $ US | 230 712 000 $ US | 322 291 000 $ US |
| 2018 | 743 929 000 $ US | 88 968 000 $ US | 727 673 000 $ US | 143 660 000 $ US | 257 046 000 $ US |
| 2017 | 700 451 000 $ US | 96 104 000 $ US | 980 493 000 $ US | 144 705 000 $ US | 260 994 000 $ US |
| 2016 | 1 061 581 000 $ US | 122 228 000 $ US | 753 456 000 $ US | 353 189 000 $ US | 618 789 000 $ US |
| 2015 | 675 380 000 $ US | 157 555 000 $ US | 1 149 437 000 $ US | 562 322 000 $ US | 153 933 000 $ US |
| 2014 | 689 170 000 $ US | 85 466 000 $ US | 1 254 632 000 $ US | 683 955 000 $ US | 148 968 000 $ US |
| 2013 | 764 576 000 $ US | 84 671 000 $ US | 752 174 000 $ US | 309 420 000 $ US | 404 709 000 $ US |
| 2012 | 982 828 000 $ US | 95 979 000 $ US | 480 637 000 $ US | 525 016 000 $ US | 798 581 000 $ US |
| 2011 | 857 601 000 $ US | 77 854 000 $ US | 210 175 000 $ US | 677 367 000 $ US | 916 321 000 $ US |
| 2010 | 433 689 000 $ US | 58 842 000 $ US | 226 500 000 $ US | 656 690 000 $ US | 710 367 000 $ US |
| 2009 | 187 859 000 $ US | 91 441 000 $ US | 187 834 000 $ US | 387 274 000 $ US | 584 690 000 $ US |
| 2008 | 265 526 000 $ US | 68 066 000 $ US | 172 967 000 $ US | 270 440 000 $ US | 629 962 000 $ US |
| 2007 | 204 031 000 $ US | 97 642 000 $ US | 79 043 000 $ US | 156 702 000 $ US | 437 982 000 $ US |
| 2006 | 274 647 000 $ US | 49 257 000 $ US | 63 333 000 $ US | 149 216 000 $ US | 359 812 000 $ US |
| 2005 | 294 755 000 $ US | 35 475 000 $ US | 78 114 000 $ US | 98 671 000 $ US | 145 938 000 $ US |
| 2004 | 122 245 000 $ US | 18 823 000 $ US | 107 088 000 $ US | 71 598 000 $ US | 30 195 000 $ US |
| 2003 | 37 757 000 $ US | 15 506 000 $ US | 73 147 000 $ US | 3 697 000 $ US | 12 705 000 $ US |
| 2002 | 16 712 000 $ US | 14 555 000 $ US | 64 940 000 $ US | 720 000 $ US | 5 671 000 $ US |
| 2001 | 8 718 000 $ US | 9 557 000 $ US | 82 219 000 $ US | 708 000 $ US | 4 247 000 $ US |
En 2025, les exportations de biens s'élevaient à 2,91 milliards de dollars vers l'Afrique du Sud, 1,32 milliard de dollars vers les Émirats arabes unis, 938 millions de dollars vers l'Inde, 513 millions de dollars vers la Chine et 433 millions de dollars vers la Suisse. Le premier rang des cinq destinations de la Tanzanie est occupé par l'Afrique du Sud depuis 2024. Le changement le plus récent dans leur ordre remonte à 2025, quand les exportations de la Tanzanie vers les Émirats arabes unis ont dépassé celles vers l'Inde.
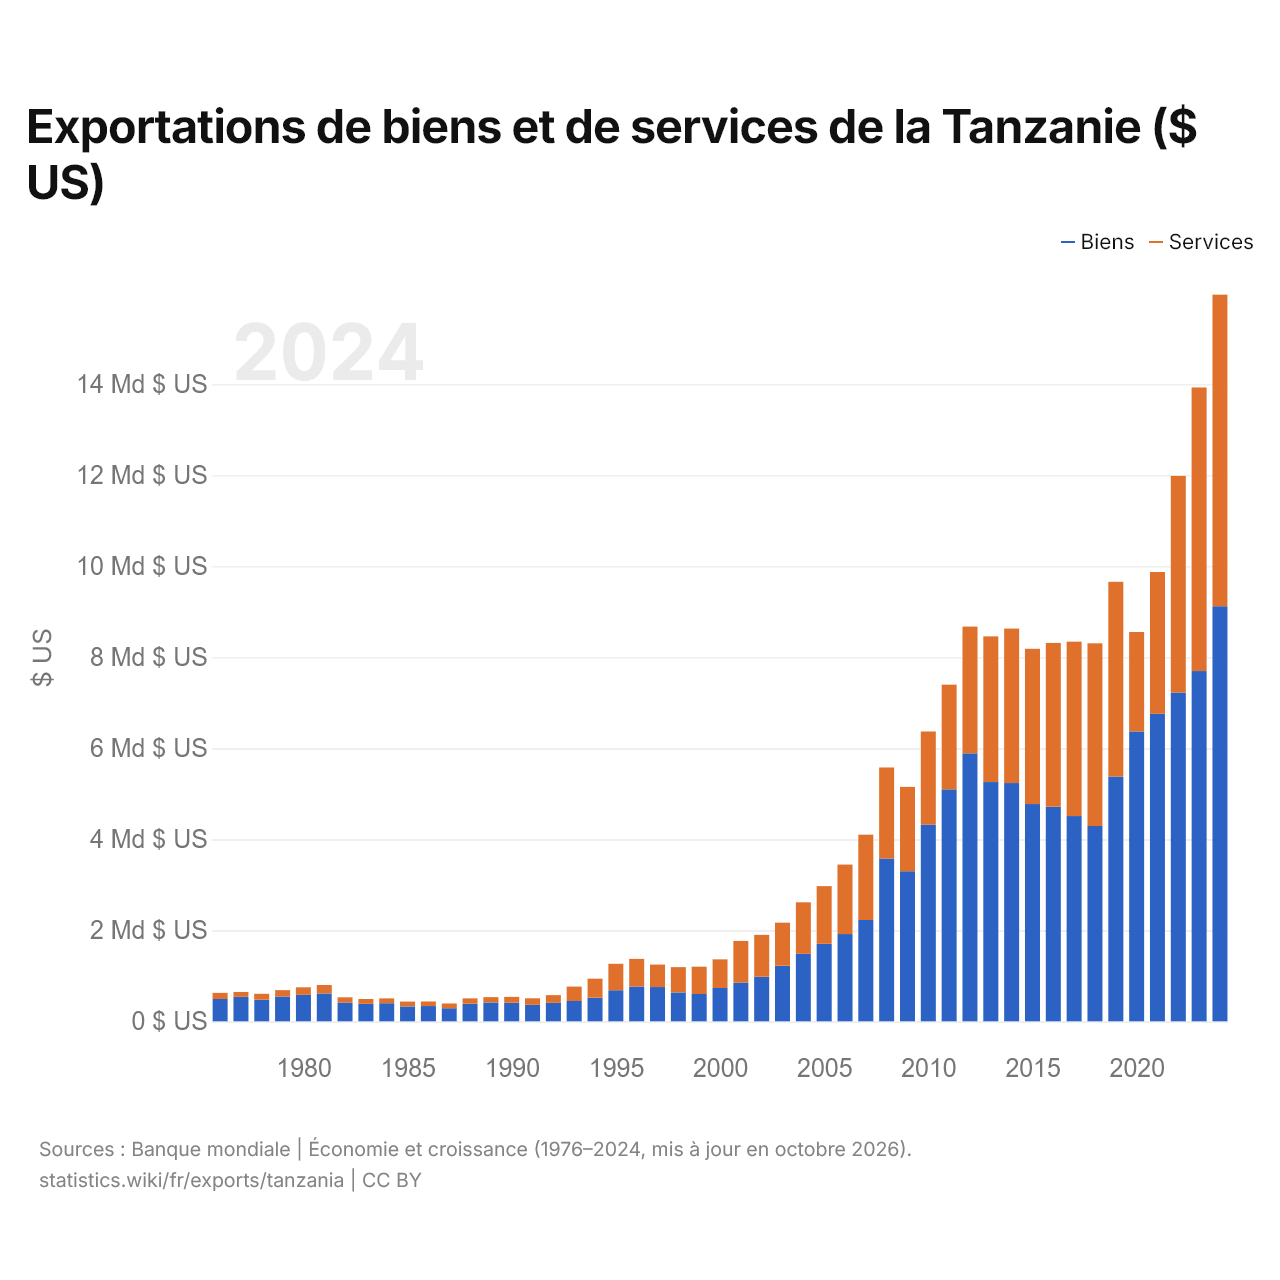
Exportations de biens et de services de la Tanzanie ($ US)
| Année | $ US | |
|---|---|---|
| Biens | Services | |
| 2024 | 9 121 647 353 $ US | 6 846 773 016 $ US |
| 2023 | 7 696 557 689 $ US | 6 231 704 888 $ US |
| 2022 | 7 223 821 879 $ US | 4 762 009 791 $ US |
| 2021 | 6 756 241 874 $ US | 3 117 744 074 $ US |
| 2020 | 6 371 715 784 $ US | 2 183 767 822 $ US |
| 2019 | 5 377 596 942 $ US | 4 280 979 747 $ US |
| 2018 | 4 292 715 646 $ US | 4 014 668 614 $ US |
| 2017 | 4 510 756 174 $ US | 3 831 872 391 $ US |
| 2016 | 4 715 980 440 $ US | 3 599 298 550 $ US |
| 2015 | 4 774 630 165 $ US | 3 412 382 776 $ US |
| 2014 | 5 235 787 308 $ US | 3 395 964 452 $ US |
| 2013 | 5 258 066 450 $ US | 3 201 655 315 $ US |
| 2012 | 5 889 215 553 $ US | 2 786 413 951 $ US |
| 2011 | 5 097 900 545 $ US | 2 300 335 000 $ US |
| 2010 | 4 324 280 328 $ US | 2 045 742 501 $ US |
| 2009 | 3 298 090 284 $ US | 1 854 644 153 $ US |
| 2008 | 3 578 801 421 $ US | 1 998 763 543 $ US |
| 2007 | 2 226 557 064 $ US | 1 875 737 681 $ US |
| 2006 | 1 917 618 836 $ US | 1 528 064 026 $ US |
| 2005 | 1 702 496 236 $ US | 1 269 160 584 $ US |
| 2004 | 1 481 636 702 $ US | 1 133 631 054 $ US |
| 2003 | 1 220 850 427 $ US | 947 758 670 $ US |
| 2002 | 979 565 662 $ US | 920 134 015 $ US |
| 2001 | 851 307 701 $ US | 915 397 039 $ US |
| 2000 | 733 600 209 $ US | 627 401 163 $ US |
| 1999 | 601 500 043 $ US | 600 300 746 $ US |
| 1998 | 636 100 000 $ US | 554 963 109 $ US |
| 1997 | 752 500 000 $ US | 494 138 020 $ US |
| 1996 | 764 092 808 $ US | 608 095 153 $ US |
| 1995 | 682 543 690 $ US | 582 606 628 $ US |
| 1994 | 519 403 382 $ US | 418 247 815 $ US |
| 1993 | 446 877 896 $ US | 317 905 897 $ US |
| 1992 | 406 351 076 $ US | 169 901 332 $ US |
| 1991 | 362 981 099 $ US | 142 308 668 $ US |
| 1990 | 407 806 138 $ US | 130 618 955 $ US |
| 1989 | 415 108 662 $ US | 117 264 343 $ US |
| 1988 | 386 485 901 $ US | 117 391 001 $ US |
| 1987 | 287 875 805 $ US | 105 337 117 $ US |
| 1986 | 335 861 349 $ US | 100 740 055 $ US |
| 1985 | 328 519 373 $ US | 105 595 513 $ US |
| 1984 | 398 502 509 $ US | 105 805 228 $ US |
| 1983 | 383 207 667 $ US | 106 346 858 $ US |
| 1982 | 412 923 474 $ US | 114 515 433 $ US |
| 1981 | 613 025 278 $ US | 184 825 069 $ US |
| 1980 | 582 681 216 $ US | 165 068 611 $ US |
| 1979 | 545 722 849 $ US | 139 960 142 $ US |
| 1978 | 476 008 325 $ US | 130 185 878 $ US |
| 1977 | 538 531 524 $ US | 106 765 322 $ US |
| 1976 | 490 403 526 $ US | 135 374 294 $ US |
Les exportations de biens de la Tanzanie s'élèvent à 9,12 milliards de dollars (2024) et celles de services à 6,85 milliards de dollars ; les services représentent 42,9 % du total, contre 21,6 % en 1976.
La Tanzanie dans le classement mondial des exportations, 2025







Exportations de biens et services de la Tanzanie, % du PIB, 1990–2025
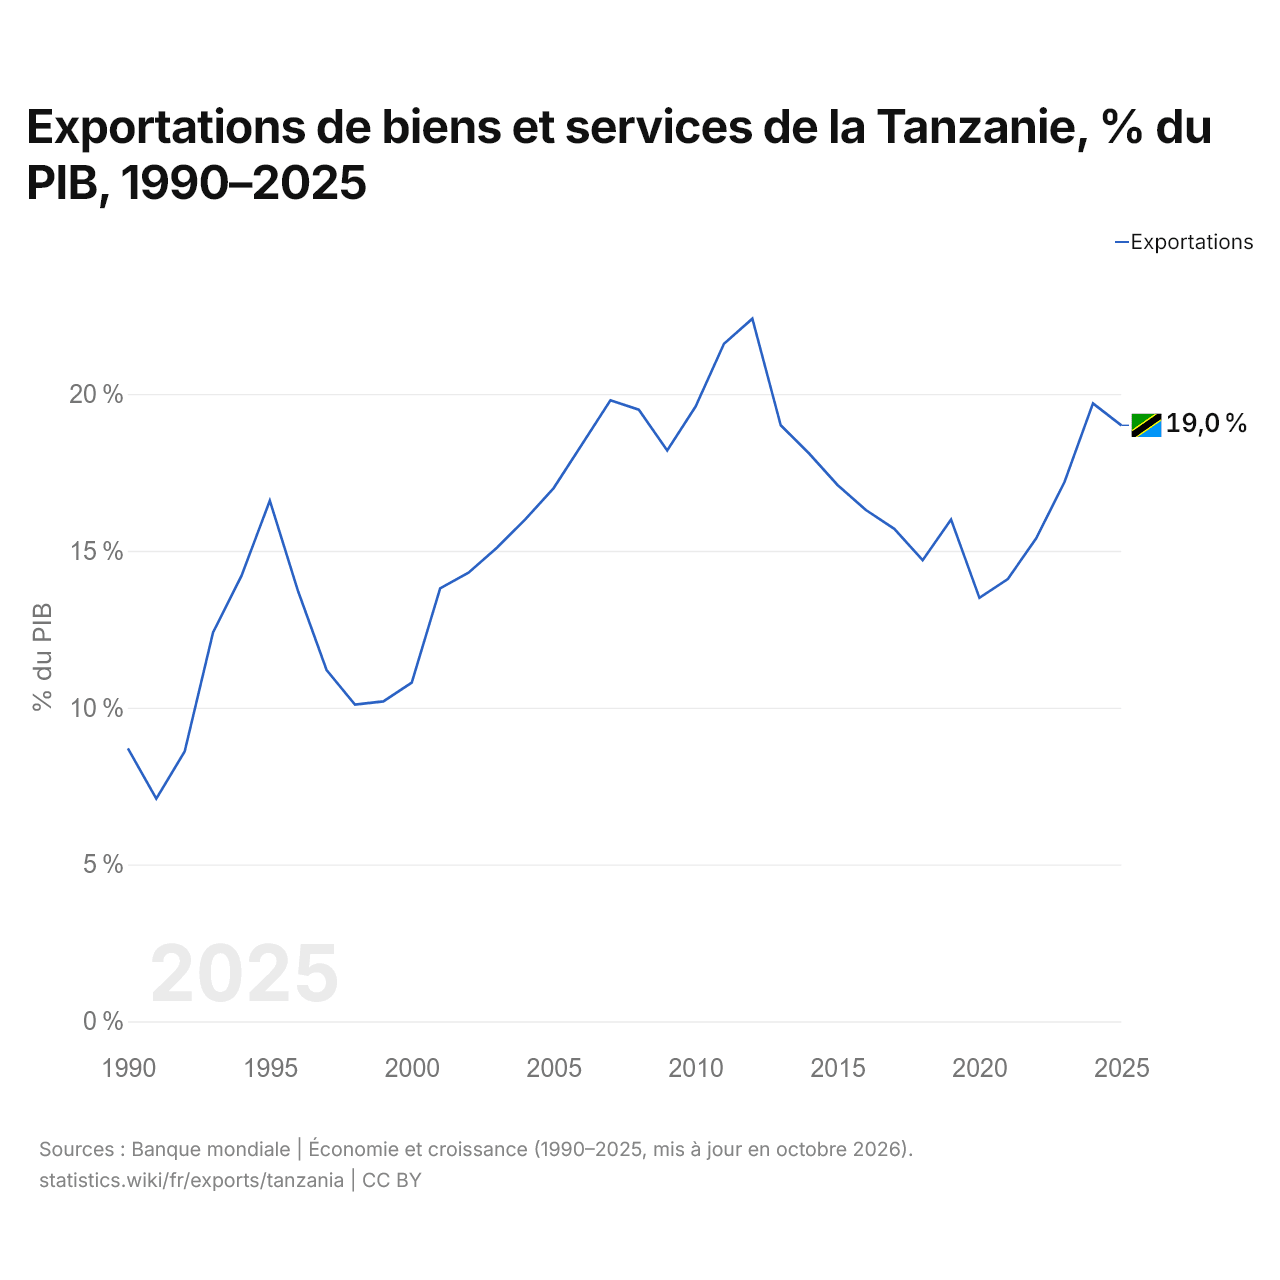
En 2025, les exportations de biens et services de la Tanzanie équivalaient à 19,0 % de son PIB, contre 8,7 % en 1990. La part la plus élevée a été de 22,4 %, en 2012.
Comparer les exportations de la Tanzanie avec celles d'autres pays
Sources :
- TradeMap (2001–2025, mis à jour en octobre 2026)
- Banque mondiale | Économie et croissance (1976–2025, mis à jour en octobre 2026)
Creative Commons Attribution (CC BY) : vous pouvez copier, partager, adapter et réutiliser ce contenu, y compris à des fins commerciales, à condition de citer statistics.wiki et d’indiquer les modifications apportées. Les sources citées ci-dessus peuvent avoir leurs propres conditions de licence.