
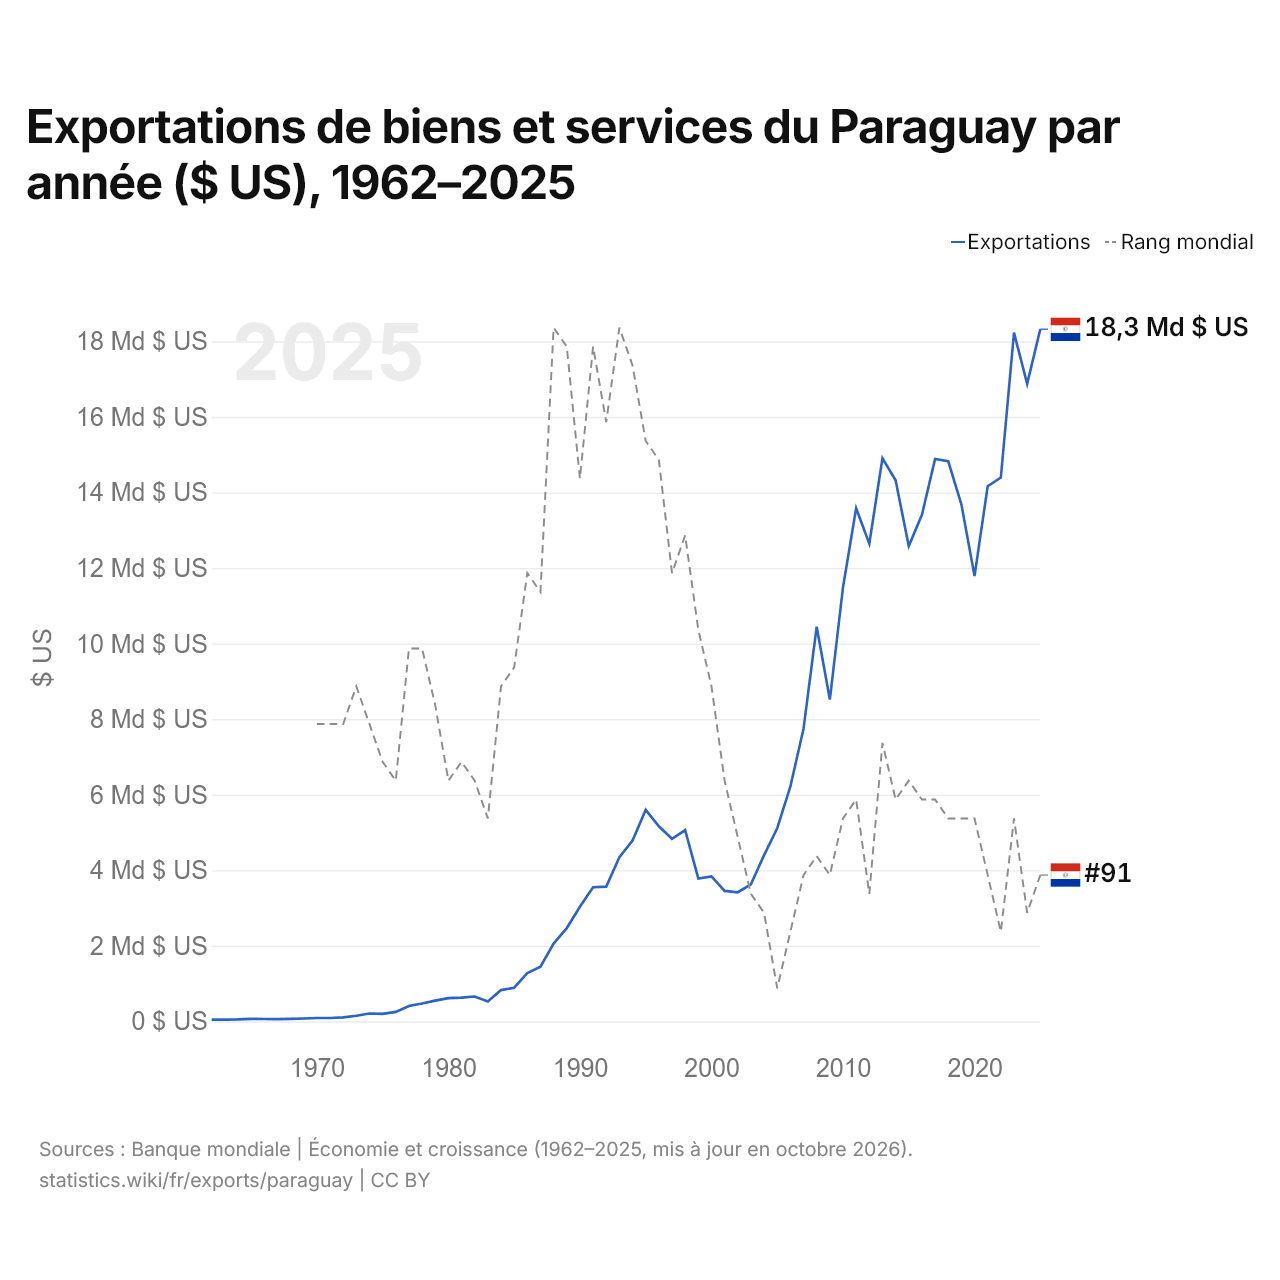
Exportations de biens et services du Paraguay par année ($ US), 1962–2025
| Année | $ US | Rang mondial |
|---|---|---|
| Exportations | Rang mondial | |
| 2025 | 18 320 665 710 $ US | #91 |
| 2024 | 16 872 593 925 $ US | #93 |
| 2023 | 18 230 152 446 $ US | #88 |
| 2022 | 14 393 374 838 $ US | #94 |
| 2021 | 14 163 870 137 $ US | #91 |
| 2020 | 11 788 507 798 $ US | #88 |
| 2019 | 13 686 227 184 $ US | #88 |
| 2018 | 14 824 374 396 $ US | #88 |
| 2017 | 14 884 925 311 $ US | #87 |
| 2016 | 13 404 881 409 $ US | #87 |
| 2015 | 12 577 922 818 $ US | #86 |
| 2014 | 14 319 795 162 $ US | #87 |
| 2013 | 14 905 195 671 $ US | #84 |
| 2012 | 12 641 839 183 $ US | #92 |
| 2011 | 13 583 125 547 $ US | #87 |
| 2010 | 11 487 694 357 $ US | #88 |
| 2009 | 8 516 698 731 $ US | #91 |
| 2008 | 10 446 318 050 $ US | #90 |
| 2007 | 7 745 197 916 $ US | #91 |
| 2006 | 6 216 897 492 $ US | #94 |
| 2005 | 5 110 362 043 $ US | #97 |
| 2004 | 4 397 197 655 $ US | #93 |
| 2003 | 3 626 068 859 $ US | #92 |
| 2002 | 3 416 430 255 $ US | #89 |
| 2001 | 3 452 915 687 $ US | #86 |
| 2000 | 3 837 259 043 $ US | #81 |
| 1999 | 3 781 642 164 $ US | #78 |
| 1998 | 5 059 911 870 $ US | #73 |
| 1997 | 4 830 120 259 $ US | #75 |
| 1996 | 5 162 446 922 $ US | #69 |
| 1995 | 5 598 134 199 $ US | #68 |
| 1994 | 4 787 159 383 $ US | #64 |
| 1993 | 4 343 942 839 $ US | #62 |
| 1992 | 3 566 831 493 $ US | #67 |
| 1991 | 3 550 997 047 $ US | #63 |
| 1990 | 3 035 291 402 $ US | #70 |
| 1989 | 2 468 316 706 $ US | #63 |
| 1988 | 2 059 098 946 $ US | #62 |
| 1987 | 1 444 433 946 $ US | #76 |
| 1986 | 1 276 819 838 $ US | #75 |
| 1985 | 888 944 749 $ US | #80 |
| 1984 | 827 269 915 $ US | #81 |
| 1983 | 525 092 105 $ US | #88 |
| 1982 | 657 801 471 $ US | #86 |
| 1981 | 627 833 333 $ US | #85 |
| 1980 | 615 865 079 $ US | #86 |
| 1979 | 548 674 603 $ US | #82 |
| 1978 | 471 531 746 $ US | #79 |
| 1977 | 407 007 937 $ US | #79 |
| 1976 | 249 071 429 $ US | #86 |
| 1975 | 199 642 857 $ US | #85 |
| 1974 | 206 802 695 $ US | #83 |
| 1973 | 148 968 254 $ US | #81 |
| 1972 | 105 873 016 $ US | #83 |
| 1971 | 88 888 889 $ US | #83 |
| 1970 | 88 698 413 $ US | #83 |
| 1969 | 75 531 746 $ US | - |
| 1968 | 63 952 381 $ US | - |
| 1967 | 60 198 413 $ US | - |
| 1966 | 61 714 286 $ US | - |
| 1965 | 66 349 206 $ US | - |
| 1964 | 50 047 619 $ US | - |
| 1963 | 44 380 952 $ US | - |
| 1962 | 45 555 556 $ US | - |
En 2025, les exportations de biens et services du Paraguay s'élevaient à 18,3 milliards de dollars, contre 45,6 millions de dollars en 1962. Le minimum a été de 44,4 millions de dollars, en 1963. Elles se classaient au 91e rang mondial, en hausse par rapport au 93e rang en 2024. Leur meilleur rang a été le 62e, occupé pour la dernière fois en 1993.
En 2025, les exportations de biens et services du Paraguay étaient les 13es plus élevées de 27 pays situés en Amérique latine. Les importations de biens et services du Paraguay s'élevaient à 19,4 milliards de dollars en 2025, au 93e rang mondial. En 2025, les importations du Paraguay dépassaient ses exportations de 1,05 milliard de dollars, soit un déficit commercial.
Exportations de biens du Paraguay par catégorie, 2025
Exportations de biens, 2025: 12,3 Md $US
En 2025, la première catégorie des exportations de biens du Paraguay était « cultures, plantes et fleurs (céréales, fruits, légumes, café, oléagineux) », avec 31,2 %, suivie de « pétrole, gaz, minerais et autres matières premières », avec 20,0 %.
Destinations des exportations de biens du Paraguay : les 10 premières, 2025
| Rang | Pays | Exportations de biens | Part | |
|---|---|---|---|---|
| 1 |
 Brésil |
4,32 Md $US | 35,1 % | |
| 2 |
 Argentine |
3,61 Md $US | 29,4 % | |
| 3 |
 Chili |
983 M $US | 7,99 % | |
| 4 |
 États-Unis |
593 M $US | 4,82 % | |
| 5 |
 Israël |
254 M $US | 2,07 % | |
| 6 |
 Uruguay |
195 M $US | 1,59 % | vs Uruguay |
| 7 |
 Russie |
165 M $US | 1,34 % | |
| 8 |
 Pays-Bas |
143 M $US | 1,17 % | |
| 9 |
 Inde |
129 M $US | 1,05 % | |
| 10 |
 Bolivie |
120 M $US | 0,98 % | |
| Autres partenaires et non précisés | 1,78 Md $US | 14,5 % |
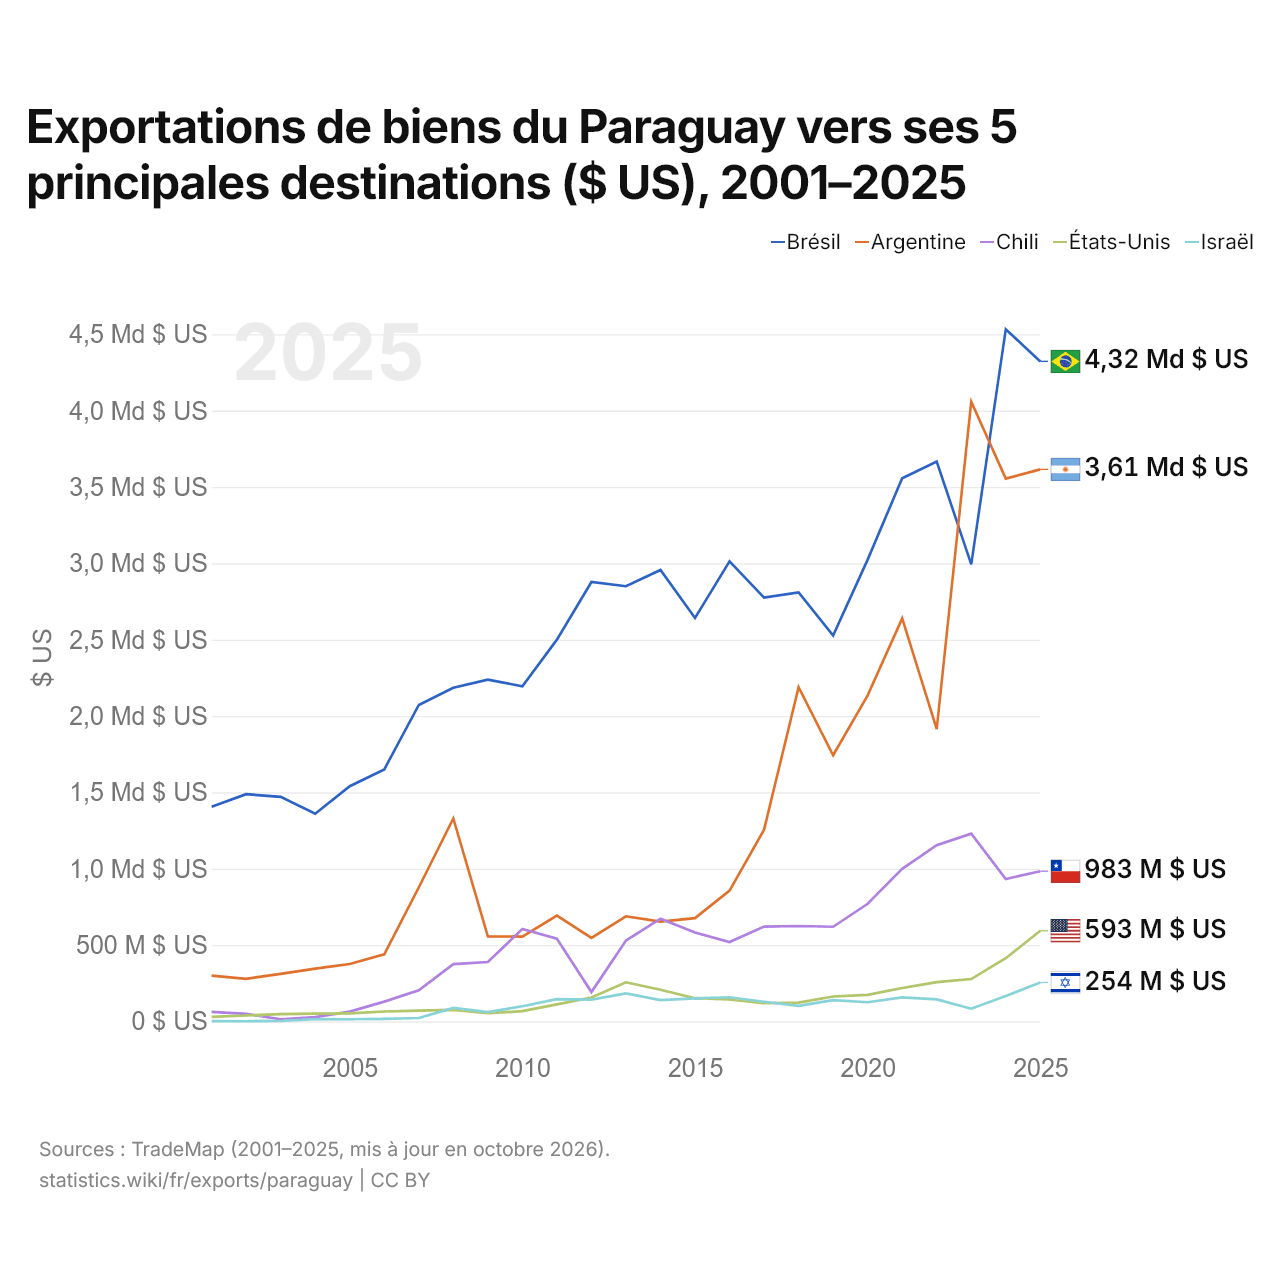
Exportations de biens du Paraguay vers ses 5 principales destinations ($ US), 2001–2025
| Année | $ US | ||||
|---|---|---|---|---|---|
| Brésil | Argentine | Chili | États-Unis | Israël | |
| 2025 | 4 322 435 000 $ US | 3 614 935 000 $ US | 983 226 000 $ US | 593 424 000 $ US | 254 289 000 $ US |
| 2024 | 4 532 818 000 $ US | 3 554 972 000 $ US | 932 071 000 $ US | 413 504 000 $ US | 165 718 000 $ US |
| 2023 | 2 993 030 000 $ US | 4 058 296 000 $ US | 1 229 550 000 $ US | 276 910 000 $ US | 82 636 000 $ US |
| 2022 | 3 666 630 000 $ US | 1 914 137 000 $ US | 1 153 527 000 $ US | 256 812 000 $ US | 143 585 000 $ US |
| 2021 | 3 557 458 000 $ US | 2 639 550 000 $ US | 998 491 000 $ US | 218 130 000 $ US | 157 115 000 $ US |
| 2020 | 3 023 937 000 $ US | 2 135 104 000 $ US | 769 693 000 $ US | 173 058 000 $ US | 125 189 000 $ US |
| 2019 | 2 527 205 000 $ US | 1 742 462 000 $ US | 619 338 000 $ US | 162 779 000 $ US | 139 299 000 $ US |
| 2018 | 2 808 904 000 $ US | 2 188 460 000 $ US | 624 621 000 $ US | 122 234 000 $ US | 101 625 000 $ US |
| 2017 | 2 775 246 000 $ US | 1 255 192 000 $ US | 620 635 000 $ US | 118 513 000 $ US | 128 111 000 $ US |
| 2016 | 3 012 560 000 $ US | 855 873 000 $ US | 519 223 000 $ US | 143 327 000 $ US | 157 555 000 $ US |
| 2015 | 2 641 834 000 $ US | 675 955 000 $ US | 582 367 000 $ US | 151 519 000 $ US | 150 643 000 $ US |
| 2014 | 2 956 269 000 $ US | 653 613 000 $ US | 672 570 000 $ US | 207 213 000 $ US | 139 319 000 $ US |
| 2013 | 2 849 963 000 $ US | 688 065 000 $ US | 529 217 000 $ US | 255 778 000 $ US | 182 740 000 $ US |
| 2012 | 2 877 205 000 $ US | 545 980 000 $ US | 191 623 000 $ US | 155 849 000 $ US | 142 236 000 $ US |
| 2011 | 2 500 103 000 $ US | 692 131 000 $ US | 541 429 000 $ US | 111 284 000 $ US | 145 799 000 $ US |
| 2010 | 2 194 777 000 $ US | 555 287 000 $ US | 604 224 000 $ US | 66 543 000 $ US | 98 997 000 $ US |
| 2009 | 2 238 117 000 $ US | 556 208 000 $ US | 388 253 000 $ US | 52 908 000 $ US | 60 041 000 $ US |
| 2008 | 2 184 916 000 $ US | 1 329 234 000 $ US | 374 545 000 $ US | 74 724 000 $ US | 87 493 000 $ US |
| 2007 | 2 072 298 000 $ US | 877 315 000 $ US | 202 953 000 $ US | 70 046 000 $ US | 21 648 000 $ US |
| 2006 | 1 650 066 000 $ US | 438 718 000 $ US | 128 993 000 $ US | 64 572 000 $ US | 16 236 000 $ US |
| 2005 | 1 540 255 000 $ US | 375 397 000 $ US | 63 821 000 $ US | 52 184 000 $ US | 13 674 000 $ US |
| 2004 | 1 359 430 000 $ US | 345 132 000 $ US | 27 784 000 $ US | 50 121 000 $ US | 14 155 000 $ US |
| 2003 | 1 470 596 000 $ US | 311 290 000 $ US | 13 678 000 $ US | 47 477 000 $ US | 2 259 000 $ US |
| 2002 | 1 487 598 000 $ US | 278 294 000 $ US | 49 140 000 $ US | 38 036 000 $ US | 398 000 $ US |
| 2001 | 1 405 926 000 $ US | 299 105 000 $ US | 61 464 000 $ US | 29 327 000 $ US | 1 494 000 $ US |
En 2025, les exportations de biens s'élevaient à 4,32 milliards de dollars vers le Brésil, 3,61 milliards de dollars vers l'Argentine, 983 millions de dollars vers le Chili, 593 millions de dollars vers les États-Unis et 254 millions de dollars vers Israël. Le premier rang des cinq destinations du Paraguay est occupé par le Brésil depuis 2024.
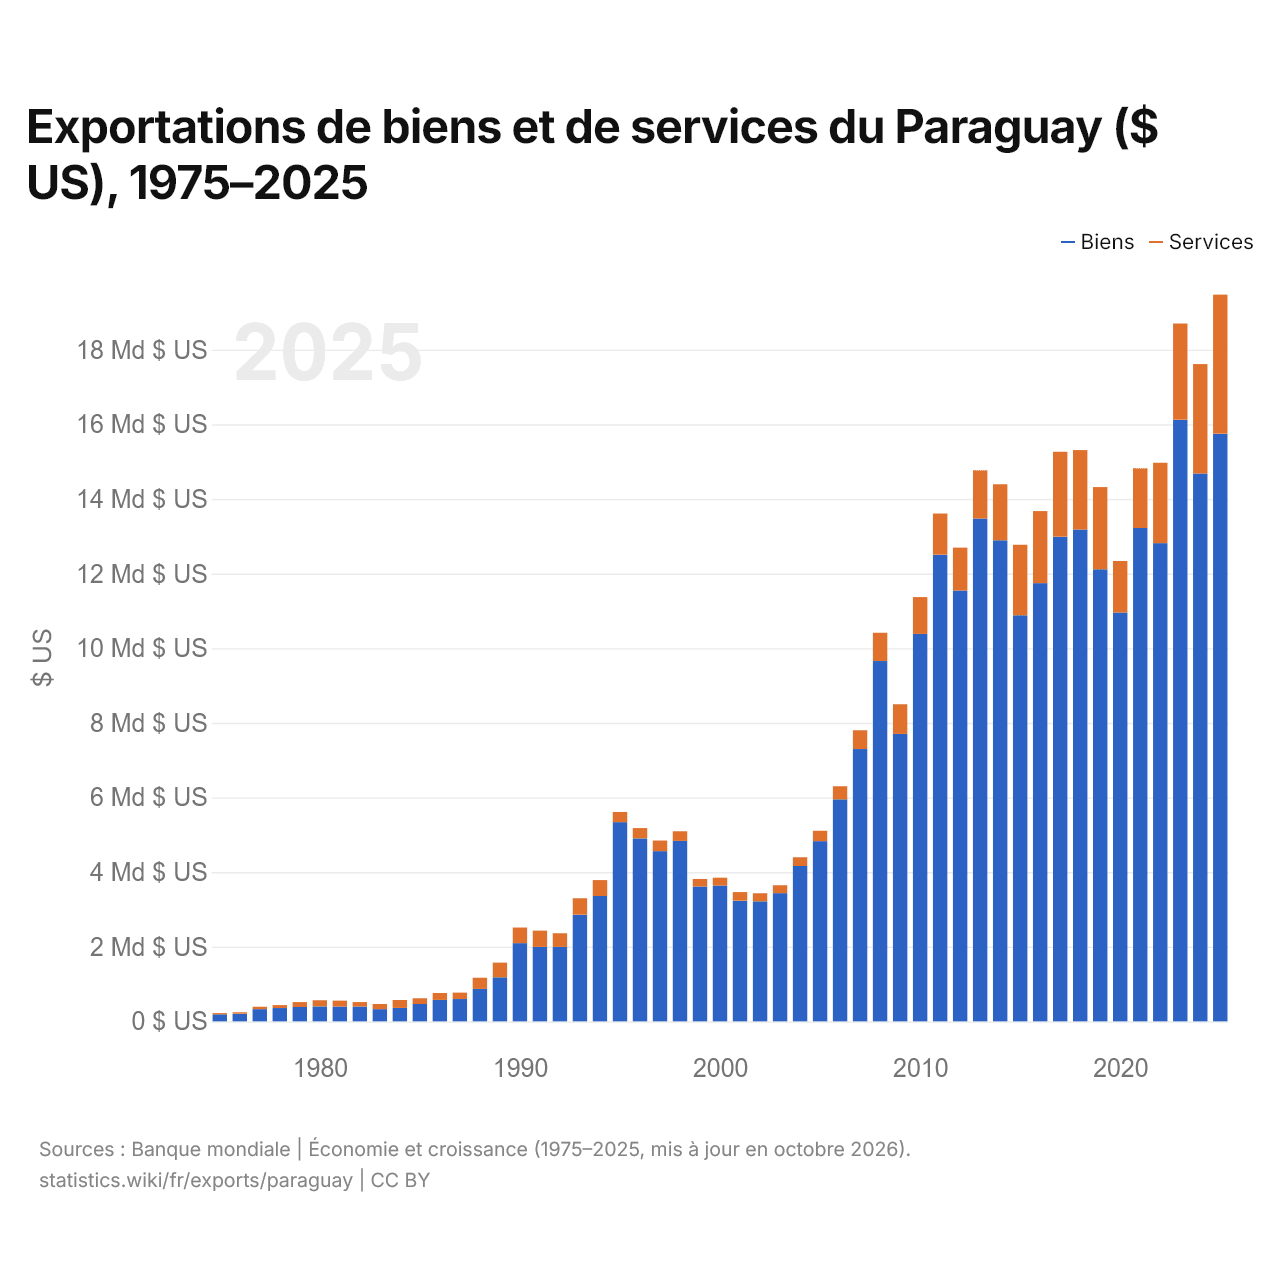
Exportations de biens et de services du Paraguay ($ US), 1975–2025
| Année | $ US | |
|---|---|---|
| Biens | Services | |
| 2025 | 15 747 304 743 $ US | 3 728 187 141 $ US |
| 2024 | 14 681 865 250 $ US | 2 932 529 029 $ US |
| 2023 | 16 125 478 963 $ US | 2 578 242 379 $ US |
| 2022 | 12 815 465 199 $ US | 2 155 372 904 $ US |
| 2021 | 13 223 047 998 $ US | 1 597 677 911 $ US |
| 2020 | 10 954 940 596 $ US | 1 383 891 318 $ US |
| 2019 | 12 116 295 371 $ US | 2 202 616 311 $ US |
| 2018 | 13 181 644 590 $ US | 2 125 773 198 $ US |
| 2017 | 12 987 248 556 $ US | 2 276 001 705 $ US |
| 2016 | 11 744 114 811 $ US | 1 929 922 954 $ US |
| 2015 | 10 883 307 511 $ US | 1 887 688 642 $ US |
| 2014 | 12 893 256 334 $ US | 1 501 989 062 $ US |
| 2013 | 13 477 281 420 $ US | 1 288 859 296 $ US |
| 2012 | 11 544 874 552 $ US | 1 149 741 456 $ US |
| 2011 | 12 505 920 107 $ US | 1 105 378 990 $ US |
| 2010 | 10 382 534 285 $ US | 988 078 284 $ US |
| 2009 | 7 702 445 664 $ US | 795 677 421 $ US |
| 2008 | 9 655 701 353 $ US | 758 829 224 $ US |
| 2007 | 7 297 377 181 $ US | 504 201 524 $ US |
| 2006 | 5 949 914 687 $ US | 349 143 560 $ US |
| 2005 | 4 827 685 701 $ US | 281 375 103 $ US |
| 2004 | 4 163 682 289 $ US | 232 960 000 $ US |
| 2003 | 3 436 617 283 $ US | 211 727 024 $ US |
| 2002 | 3 216 127 163 $ US | 215 712 729 $ US |
| 2001 | 3 233 830 232 $ US | 230 530 000 $ US |
| 2000 | 3 640 111 489 $ US | 209 830 000 $ US |
| 1999 | 3 612 822 161 $ US | 202 900 000 $ US |
| 1998 | 4 836 136 122 $ US | 258 200 000 $ US |
| 1997 | 4 561 456 547 $ US | 284 400 000 $ US |
| 1996 | 4 903 672 021 $ US | 273 500 000 $ US |
| 1995 | 5 337 184 199 $ US | 274 600 000 $ US |
| 1994 | 3 360 100 000 $ US | 426 200 000 $ US |
| 1993 | 2 859 000 000 $ US | 438 600 000 $ US |
| 1992 | 1 997 100 000 $ US | 364 600 000 $ US |
| 1991 | 1 997 100 000 $ US | 433 300 000 $ US |
| 1990 | 2 096 200 000 $ US | 418 200 000 $ US |
| 1989 | 1 180 000 000 $ US | 394 900 000 $ US |
| 1988 | 871 000 000 $ US | 295 900 000 $ US |
| 1987 | 597 400 000 $ US | 172 100 000 $ US |
| 1986 | 575 800 000 $ US | 183 800 000 $ US |
| 1985 | 465 600 000 $ US | 152 700 000 $ US |
| 1984 | 361 300 000 $ US | 210 800 000 $ US |
| 1983 | 326 000 000 $ US | 138 000 000 $ US |
| 1982 | 396 200 000 $ US | 120 400 000 $ US |
| 1981 | 398 500 000 $ US | 156 200 000 $ US |
| 1980 | 400 300 000 $ US | 164 000 000 $ US |
| 1979 | 384 500 000 $ US | 129 100 000 $ US |
| 1978 | 356 100 000 $ US | 78 200 000 $ US |
| 1977 | 327 100 000 $ US | 62 900 000 $ US |
| 1976 | 202 100 000 $ US | 39 900 000 $ US |
| 1975 | 188 000 000 $ US | 34 100 000 $ US |
En 2025, les exportations de biens du Paraguay s'élevaient à 15,7 milliards de dollars et celles de services à 3,73 milliards de dollars ; les services représentaient 19,1 % du total, contre 15,4 % en 1975.
Le Paraguay dans le classement mondial des exportations, 2025







Exportations de biens et services du Paraguay, % du PIB, 1962–2025
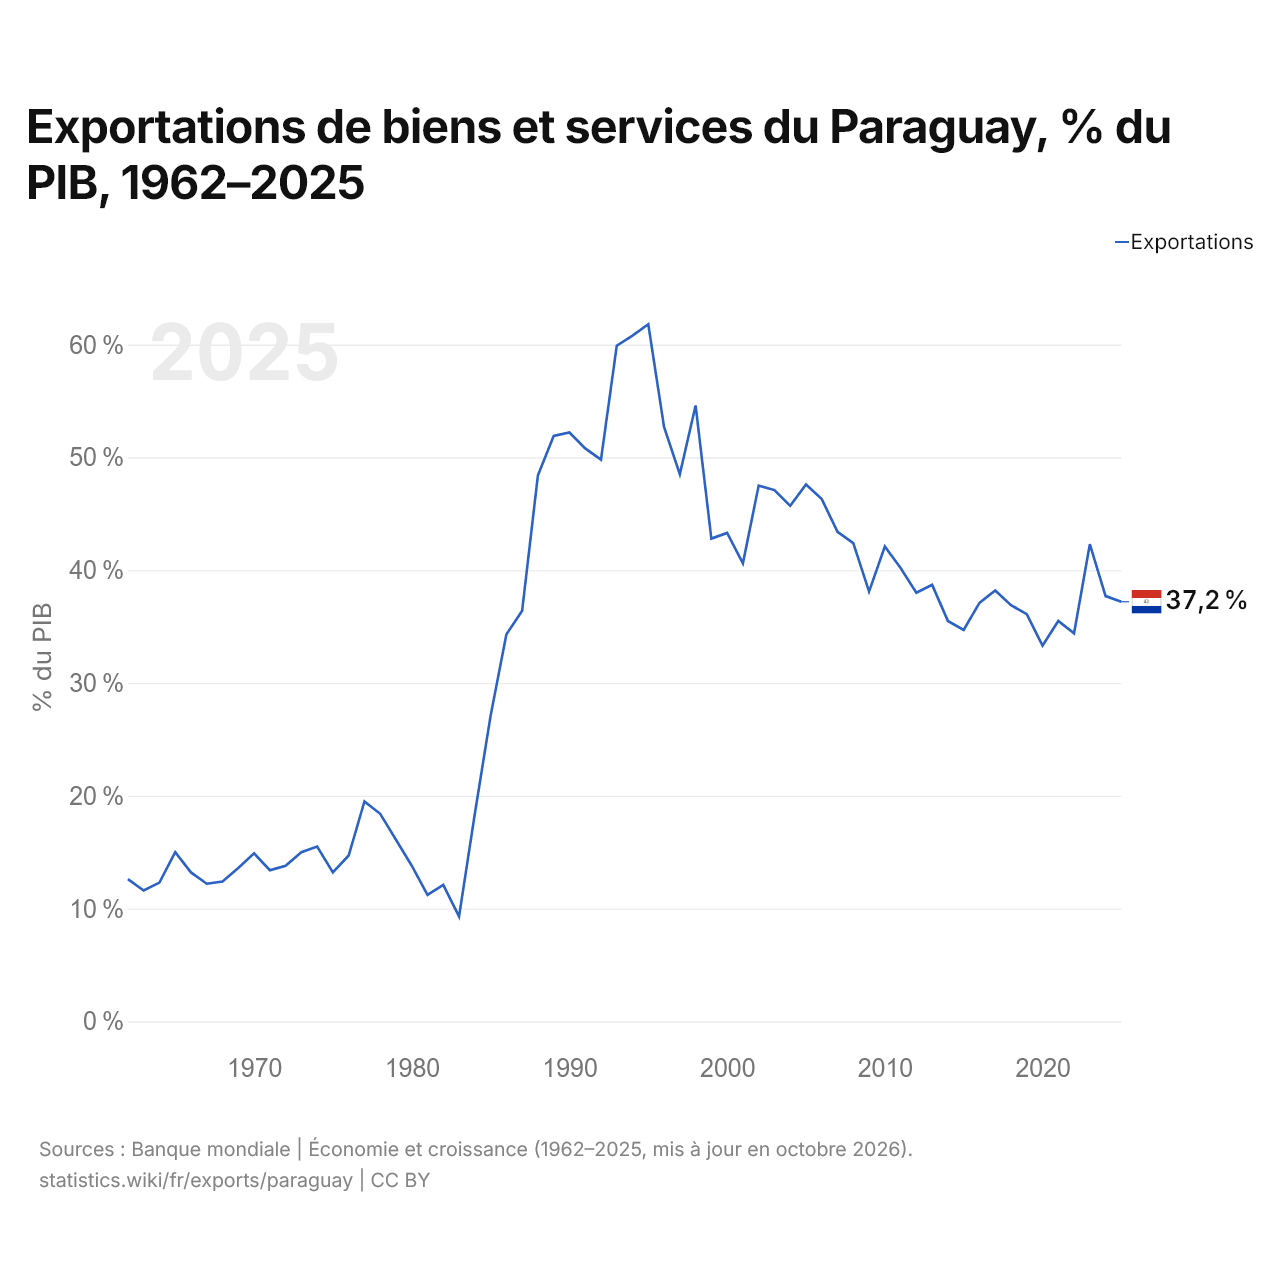
En 2025, les exportations de biens et services du Paraguay équivalaient à 37,2 % de son PIB, contre 12,6 % en 1962. La part la plus élevée a été de 61,8 %, en 1995.
Comparer les exportations du Paraguay avec celles d'autres pays
Sources :
- Banque mondiale | Économie et croissance (1962–2025, mis à jour en octobre 2026)
- TradeMap (2001–2025, mis à jour en octobre 2026)
Creative Commons Attribution (CC BY) : vous pouvez copier, partager, adapter et réutiliser ce contenu, y compris à des fins commerciales, à condition de citer statistics.wiki et d’indiquer les modifications apportées. Les sources citées ci-dessus peuvent avoir leurs propres conditions de licence.