
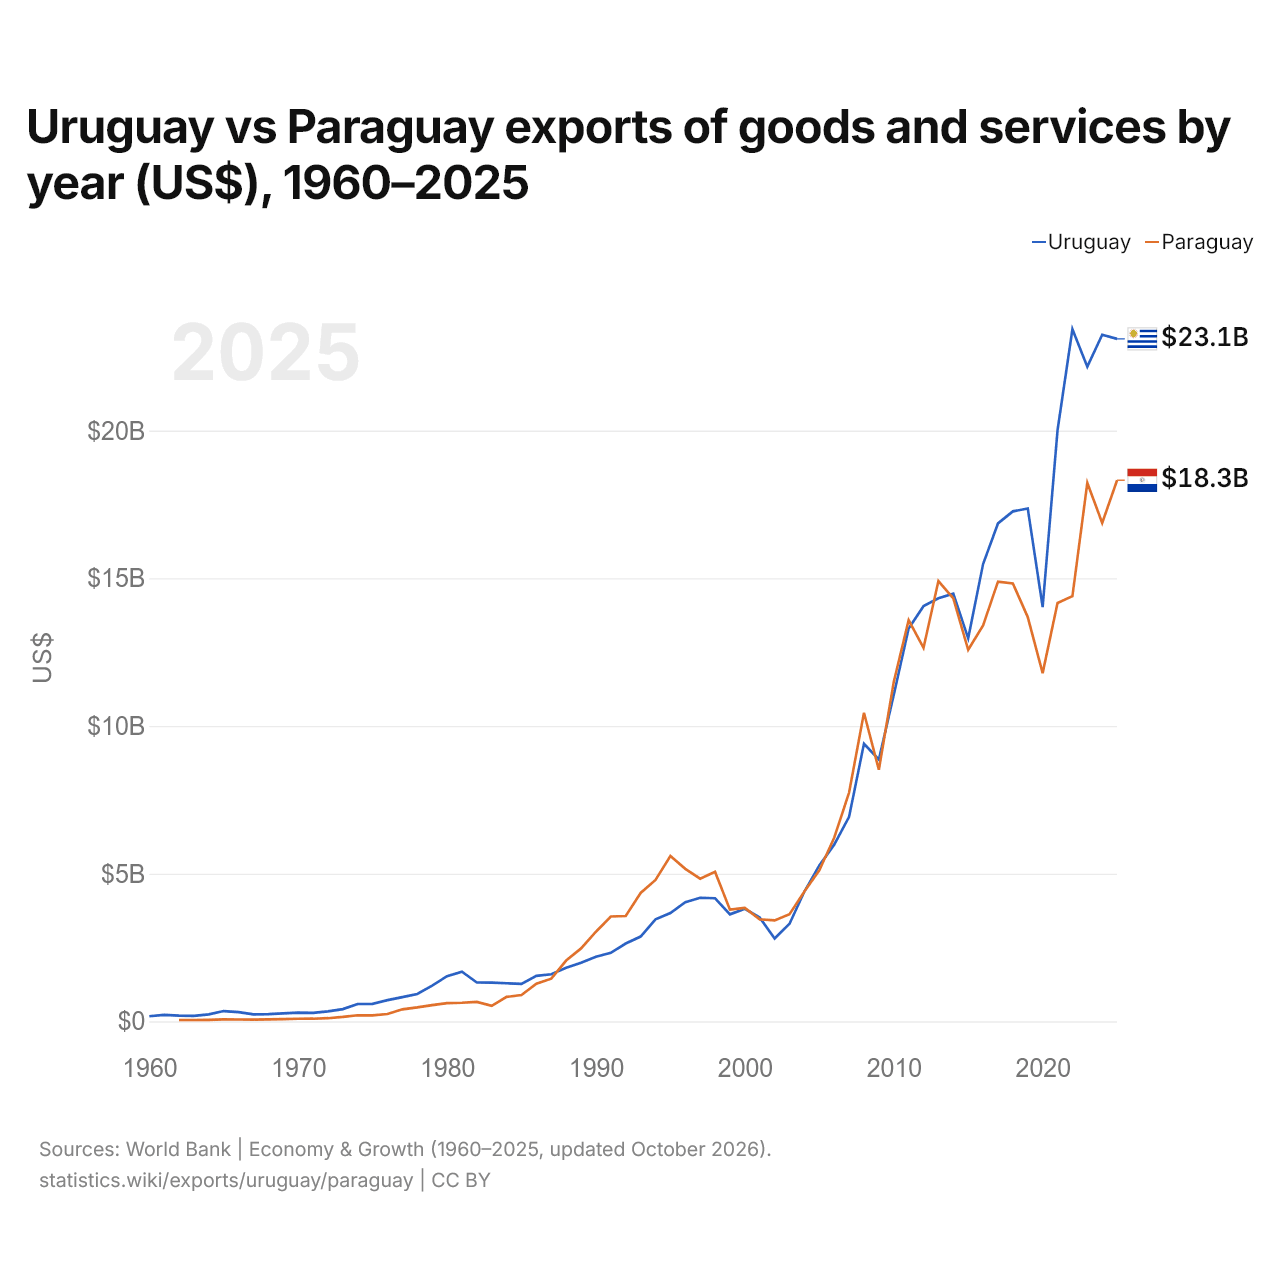
Uruguay vs Paraguay : exportations de biens et services par année ($ US), 1960–2025
| Année | $ US | |
|---|---|---|
 Uruguay |
 Paraguay |
|
| 2025 | 23 104 847 903 $ US | 18 320 665 710 $ US |
| 2024 | 23 243 778 154 $ US | 16 872 593 925 $ US |
| 2023 | 22 163 590 552 $ US | 18 230 152 446 $ US |
| 2022 | 23 432 009 306 $ US | 14 393 374 838 $ US |
| 2021 | 20 010 242 322 $ US | 14 163 870 137 $ US |
| 2020 | 14 026 258 642 $ US | 11 788 507 798 $ US |
| 2019 | 17 363 375 088 $ US | 13 686 227 184 $ US |
| 2018 | 17 265 078 783 $ US | 14 824 374 396 $ US |
| 2017 | 16 856 823 032 $ US | 14 884 925 311 $ US |
| 2016 | 15 480 542 128 $ US | 13 404 881 409 $ US |
| 2015 | 12 965 298 329 $ US | 12 577 922 818 $ US |
| 2014 | 14 477 839 205 $ US | 14 319 795 162 $ US |
| 2013 | 14 324 258 530 $ US | 14 905 195 671 $ US |
| 2012 | 14 056 802 469 $ US | 12 641 839 183 $ US |
| 2011 | 13 301 545 753 $ US | 13 583 125 547 $ US |
| 2010 | 11 050 981 364 $ US | 11 487 694 357 $ US |
| 2009 | 8 863 697 957 $ US | 8 516 698 731 $ US |
| 2008 | 9 399 061 015 $ US | 10 446 318 050 $ US |
| 2007 | 6 922 888 127 $ US | 7 745 197 916 $ US |
| 2006 | 5 981 157 818 $ US | 6 216 897 492 $ US |
| 2005 | 5 279 006 692 $ US | 5 110 362 043 $ US |
| 2004 | 4 394 994 712 $ US | 4 397 197 655 $ US |
| 2003 | 3 304 410 121 $ US | 3 626 068 859 $ US |
| 2002 | 2 805 891 109 $ US | 3 416 430 255 $ US |
| 2001 | 3 511 965 703 $ US | 3 452 915 687 $ US |
| 2000 | 3 811 052 356 $ US | 3 837 259 043 $ US |
| 1999 | 3 621 012 840 $ US | 3 781 642 164 $ US |
| 1998 | 4 168 339 942 $ US | 5 059 911 870 $ US |
| 1997 | 4 184 600 575 $ US | 4 830 120 259 $ US |
| 1996 | 4 035 386 466 $ US | 5 162 446 922 $ US |
| 1995 | 3 665 940 936 $ US | 5 598 134 199 $ US |
| 1994 | 3 454 168 853 $ US | 4 787 159 383 $ US |
| 1993 | 2 869 311 094 $ US | 4 343 942 839 $ US |
| 1992 | 2 633 269 109 $ US | 3 566 831 493 $ US |
| 1991 | 2 318 969 025 $ US | 3 550 997 047 $ US |
| 1990 | 2 188 206 936 $ US | 3 035 291 402 $ US |
| 1989 | 1 982 636 217 $ US | 2 468 316 706 $ US |
| 1988 | 1 811 733 104 $ US | 2 059 098 946 $ US |
| 1987 | 1 594 966 345 $ US | 1 444 433 946 $ US |
| 1986 | 1 541 476 815 $ US | 1 276 819 838 $ US |
| 1985 | 1 266 123 611 $ US | 888 944 749 $ US |
| 1984 | 1 289 223 521 $ US | 827 269 915 $ US |
| 1983 | 1 310 717 316 $ US | 525 092 105 $ US |
| 1982 | 1 314 939 846 $ US | 657 801 471 $ US |
| 1981 | 1 679 796 170 $ US | 627 833 333 $ US |
| 1980 | 1 527 803 803 $ US | 615 865 079 $ US |
| 1979 | 1 208 815 650 $ US | 548 674 603 $ US |
| 1978 | 925 434 422 $ US | 471 531 746 $ US |
| 1977 | 818 672 884 $ US | 407 007 937 $ US |
| 1976 | 717 274 792 $ US | 249 071 429 $ US |
| 1975 | 593 738 353 $ US | 199 642 857 $ US |
| 1974 | 588 256 717 $ US | 206 802 695 $ US |
| 1973 | 412 996 157 $ US | 148 968 254 $ US |
| 1972 | 337 963 959 $ US | 105 873 016 $ US |
| 1971 | 288 709 677 $ US | 88 888 889 $ US |
| 1970 | 296 774 194 $ US | 88 698 413 $ US |
| 1969 | 268 548 387 $ US | 75 531 746 $ US |
| 1968 | 241 962 440 $ US | 63 952 381 $ US |
| 1967 | 233 416 696 $ US | 60 198 413 $ US |
| 1966 | 309 880 934 $ US | 61 714 286 $ US |
| 1965 | 347 846 052 $ US | 66 349 206 $ US |
| 1964 | 235 904 695 $ US | 50 047 619 $ US |
| 1963 | 185 026 102 $ US | 44 380 952 $ US |
| 1962 | 193 918 026 $ US | 45 555 556 $ US |
| 1961 | 219 799 543 $ US | - |
| 1960 | 171 350 240 $ US | - |
En 2025, les exportations de biens et services de l'Uruguay s'élevaient à 23,1 milliards de dollars et celles du Paraguay à 18,3 milliards de dollars : celles de l'Uruguay étaient supérieures de 26 %. En 1962, les exportations de l'Uruguay étaient 4,3 fois plus élevées : 194 millions de dollars pour l'Uruguay et 45,6 millions de dollars pour le Paraguay.
Les exportations de biens et services de l'Uruguay sont supérieures à celles du Paraguay chaque année depuis 2014.
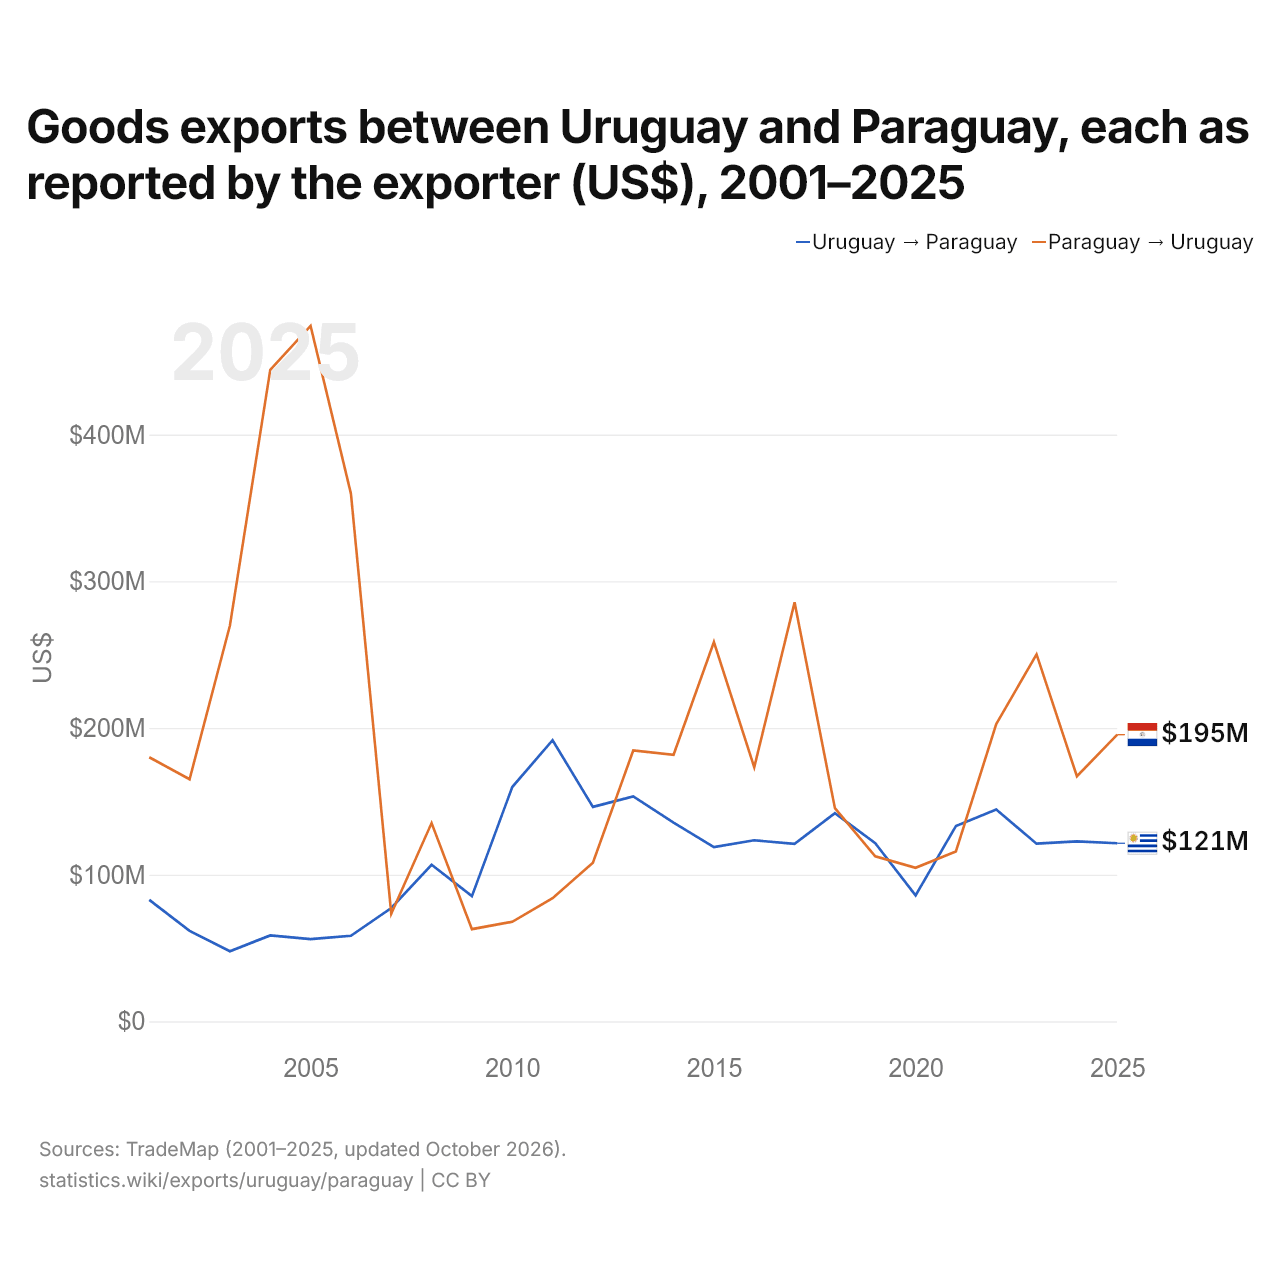
Exportations de biens entre l'Uruguay et le Paraguay, selon chaque exportateur ($ US), 2001–2025
| Année | $ US | |
|---|---|---|
| Uruguay → Paraguay | Paraguay → Uruguay | |
| 2025 | 121 393 000 $ US | 195 432 000 $ US |
| 2024 | 122 726 000 $ US | 167 048 000 $ US |
| 2023 | 121 108 000 $ US | 250 199 000 $ US |
| 2022 | 144 456 000 $ US | 202 600 000 $ US |
| 2021 | 133 186 000 $ US | 115 820 000 $ US |
| 2020 | 85 899 000 $ US | 104 704 000 $ US |
| 2019 | 121 490 000 $ US | 112 515 000 $ US |
| 2018 | 141 896 000 $ US | 145 274 000 $ US |
| 2017 | 120 969 000 $ US | 285 670 000 $ US |
| 2016 | 123 430 000 $ US | 173 184 000 $ US |
| 2015 | 118 743 000 $ US | 258 617 000 $ US |
| 2014 | 135 415 000 $ US | 181 696 000 $ US |
| 2013 | 153 299 000 $ US | 184 670 000 $ US |
| 2012 | 146 207 000 $ US | 108 131 000 $ US |
| 2011 | 191 655 000 $ US | 83 950 000 $ US |
| 2010 | 159 750 000 $ US | 67 856 000 $ US |
| 2009 | 85 342 000 $ US | 62 845 000 $ US |
| 2008 | 106 745 000 $ US | 135 195 000 $ US |
| 2007 | 77 256 000 $ US | 73 353 000 $ US |
| 2006 | 58 347 000 $ US | 359 804 000 $ US |
| 2005 | 56 020 000 $ US | 474 081 000 $ US |
| 2004 | 58 558 000 $ US | 444 142 000 $ US |
| 2003 | 47 804 000 $ US | 269 803 000 $ US |
| 2002 | 61 685 000 $ US | 165 052 000 $ US |
| 2001 | 82 805 000 $ US | 180 017 000 $ US |
En 2025, les exportations de biens de l'Uruguay vers le Paraguay, selon l'Uruguay, s'élevaient à 121 millions de dollars, et celles du Paraguay vers l'Uruguay, selon le Paraguay, à 195 millions de dollars : 1,6 fois plus pour celles du Paraguay. En 2001, elles s'élevaient à 82,8 millions de dollars pour l'Uruguay et à 180 millions de dollars pour le Paraguay.
Uruguay vs Paraguay : chiffres des exportations
|
Uruguay
|
Paraguay
|
|
|---|---|---|
| Exportations | 23,1 Md $US (2025) | 18,3 Md $US (2025) |
| Rang mondial | 87/176 | 91/176 |
| Part mondiale | 0,07 % | 0,05 % |
| % du PIB | 27,1 % | 37,2 % |
| Première catégorie de biens | Animaux, viande, poisson, produits laitiers, cuirs et peaux (40,5 %, 2025) | Cultures, plantes et fleurs (céréales, fruits, légumes, café, oléagineux) (31,2 %, 2025) |
| Première destination des biens | Chine (16 %, 2025) | Brésil (35,1 %, 2025) |
Comparer les exportations de 2 pays au choix
Sources :
- Banque mondiale | Économie et croissance (1960–2025, mis à jour en octobre 2026)
- TradeMap (2001–2025, mis à jour en octobre 2026)
Creative Commons Attribution (CC BY) : vous pouvez copier, partager, adapter et réutiliser ce contenu, y compris à des fins commerciales, à condition de citer statistics.wiki et d’indiquer les modifications apportées. Les sources citées ci-dessus peuvent avoir leurs propres conditions de licence.