
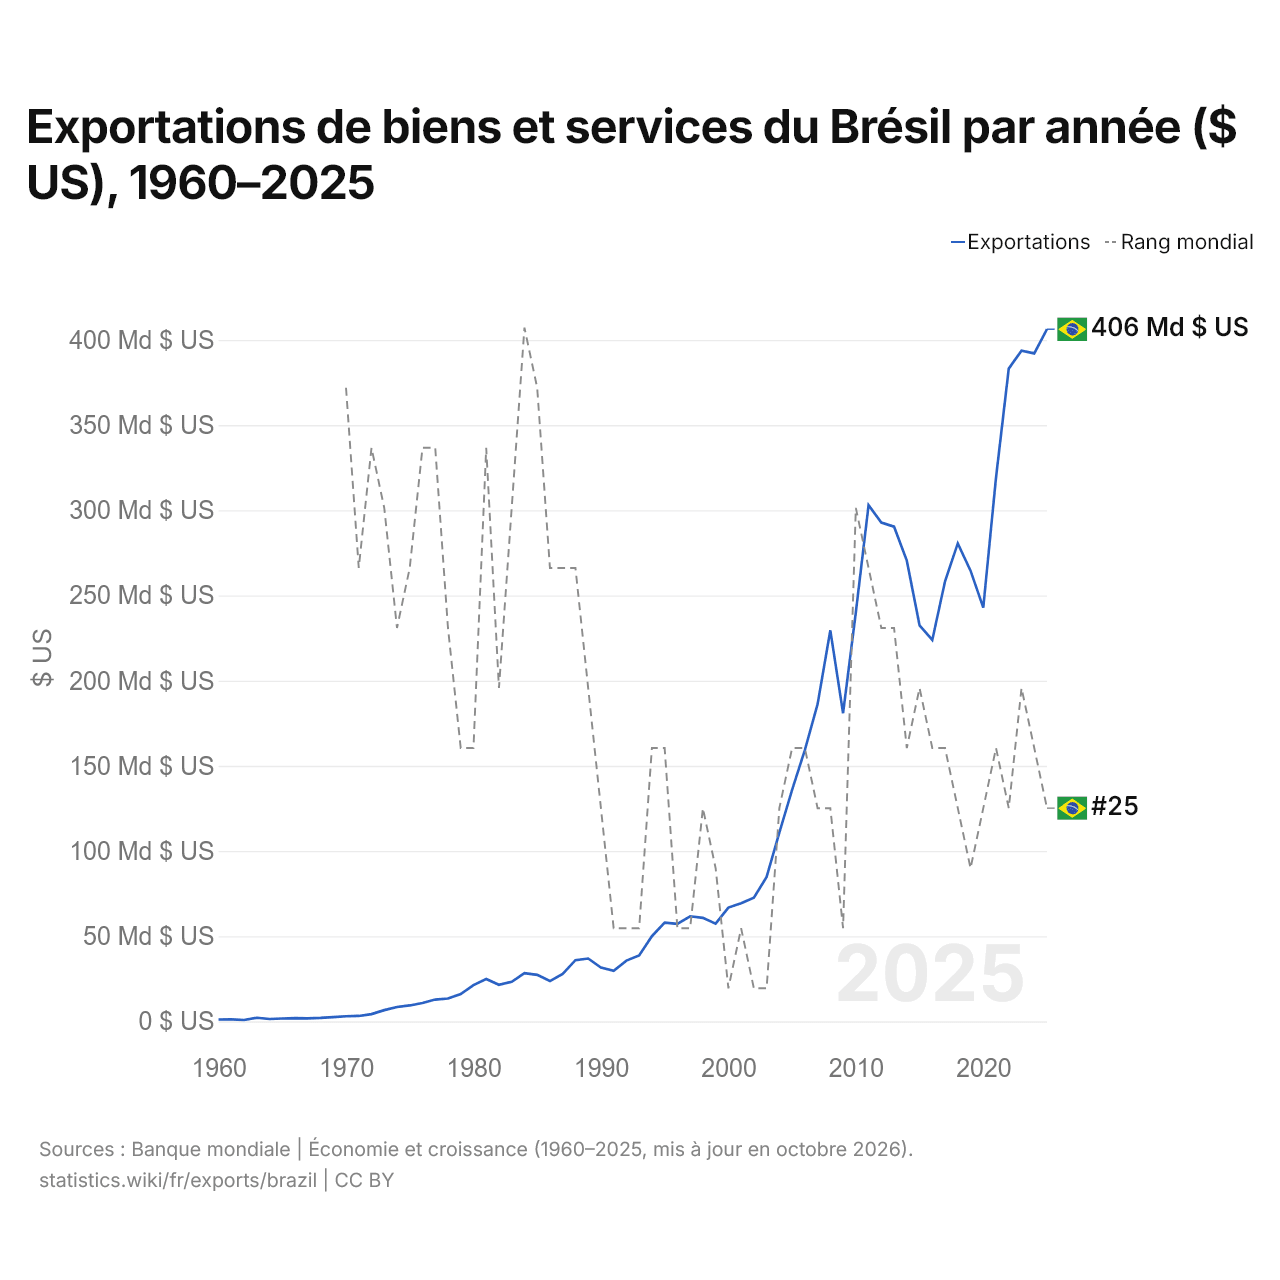
Exportations de biens et services du Brésil par année ($ US), 1960–2025
| Année | $ US | Rang mondial |
|---|---|---|
| Exportations | Rang mondial | |
| 2025 | 406 298 241 937 $ US | #25 |
| 2024 | 392 105 346 047 $ US | #24 |
| 2023 | 393 731 572 888 $ US | #23 |
| 2022 | 383 177 602 116 $ US | #25 |
| 2021 | 319 251 201 403 $ US | #24 |
| 2020 | 242 872 071 018 $ US | #25 |
| 2019 | 264 562 979 421 $ US | #26 |
| 2018 | 280 543 266 303 $ US | #25 |
| 2017 | 258 330 777 007 $ US | #24 |
| 2016 | 223 863 343 103 $ US | #24 |
| 2015 | 232 488 824 445 $ US | #23 |
| 2014 | 270 458 130 850 $ US | #24 |
| 2013 | 290 364 173 325 $ US | #22 |
| 2012 | 292 808 395 454 $ US | #22 |
| 2011 | 303 016 626 326 $ US | #21 |
| 2010 | 240 003 137 742 $ US | #20 |
| 2009 | 180 891 970 354 $ US | #27 |
| 2008 | 229 517 035 698 $ US | #25 |
| 2007 | 186 202 879 575 $ US | #25 |
| 2006 | 159 213 742 532 $ US | #24 |
| 2005 | 135 919 140 236 $ US | #24 |
| 2004 | 110 739 032 053 $ US | #25 |
| 2003 | 84 744 257 516 $ US | #28 |
| 2002 | 72 546 876 638 $ US | #28 |
| 2001 | 69 279 555 096 $ US | #27 |
| 2000 | 66 777 380 518 $ US | #28 |
| 1999 | 57 355 149 556 $ US | #26 |
| 1998 | 60 723 187 855 $ US | #25 |
| 1997 | 61 680 024 620 $ US | #27 |
| 1996 | 57 235 482 141 $ US | #27 |
| 1995 | 57 922 124 038 $ US | #24 |
| 1994 | 49 978 798 948 $ US | #24 |
| 1993 | 38 682 712 856 $ US | #27 |
| 1992 | 35 668 919 611 $ US | #27 |
| 1991 | 29 723 863 636 $ US | #27 |
| 1990 | 31 556 066 667 $ US | #25 |
| 1989 | 36 878 468 232 $ US | #23 |
| 1988 | 35 921 688 764 $ US | #21 |
| 1987 | 27 820 190 341 $ US | #21 |
| 1986 | 23 640 555 933 $ US | #21 |
| 1985 | 27 305 943 481 $ US | #18 |
| 1984 | 28 317 692 073 $ US | #17 |
| 1983 | 23 221 079 049 $ US | #20 |
| 1982 | 21 435 129 573 $ US | #23 |
| 1981 | 24 828 388 399 $ US | #19 |
| 1980 | 21 276 141 968 $ US | #24 |
| 1979 | 16 026 612 550 $ US | #24 |
| 1978 | 13 404 621 905 $ US | #22 |
| 1977 | 12 776 590 679 $ US | #19 |
| 1976 | 10 741 988 183 $ US | #19 |
| 1975 | 9 325 921 437 $ US | #21 |
| 1974 | 8 424 673 828 $ US | #22 |
| 1973 | 6 557 708 238 $ US | #20 |
| 1972 | 4 249 449 496 $ US | #19 |
| 1971 | 3 155 632 739 $ US | #21 |
| 1970 | 2 975 391 707 $ US | #18 |
| 1969 | 2 479 930 322 $ US | - |
| 1968 | 2 032 731 103 $ US | - |
| 1967 | 1 764 834 055 $ US | - |
| 1966 | 1 846 958 712 $ US | - |
| 1965 | 1 685 625 122 $ US | - |
| 1964 | 1 354 466 135 $ US | - |
| 1963 | 2 080 325 262 $ US | - |
| 1962 | 770 900 520 $ US | - |
| 1961 | 1 109 152 823 $ US | - |
| 1960 | 1 069 822 094 $ US | - |
En 2025, les exportations de biens et services du Brésil s'élevaient à 406 milliards de dollars, contre 1,07 milliard de dollars en 1960. Le minimum a été de 771 millions de dollars, en 1962. Elles se classaient au 25e rang mondial, en baisse par rapport au 24e rang en 2024. Leur meilleur rang a été le 17e, occupé pour la dernière fois en 1984.
En 2025, les exportations de biens et services du Brésil étaient les 2es plus élevées de 27 pays situés en Amérique latine, après celles du Mexique. Les importations de biens et services du Brésil s'élevaient à 398 milliards de dollars en 2025, au 24e rang mondial. En 2025, les exportations du Brésil dépassaient ses importations de 7,98 milliards de dollars, soit un excédent commercial.
Exportations de biens du Brésil par catégorie, 2025
Exportations de biens, 2025: 349 Md $US
En 2025, la première catégorie des exportations de biens du Brésil était « pétrole, gaz, minerais et autres matières premières », avec 28,9 %, suivie de « cultures, plantes et fleurs (céréales, fruits, légumes, café, oléagineux) », avec 20,7 %.
Destinations des exportations de biens du Brésil : les 10 premières, 2025
| Rang | Pays | Exportations de biens | Part | |
|---|---|---|---|---|
| 1 |
 Chine |
100 Md $US | 28,7 % | vs Chine |
| 2 |
 États-Unis |
38,0 Md $US | 10,9 % | vs USA |
| 3 |
 Argentine |
18,1 Md $US | 5,19 % | vs Argentine |
| 4 |
 Pays-Bas |
11,7 Md $US | 3,37 % | |
| 5 |
 Espagne |
8,79 Md $US | 2,52 % | vs Espagne |
| 6 |
 Mexique |
7,73 Md $US | 2,22 % | vs Mexique |
| 7 |
 Singapour |
7,43 Md $US | 2,13 % | |
| 8 |
 Canada |
7,25 Md $US | 2,08 % | vs Canada |
| 9 |
 Chili |
7,21 Md $US | 2,07 % | vs Chili |
| 10 |
 Inde |
6,86 Md $US | 1,97 % | vs Inde |
| Autres partenaires et non précisés | 135 Md $US | 38,9 % |
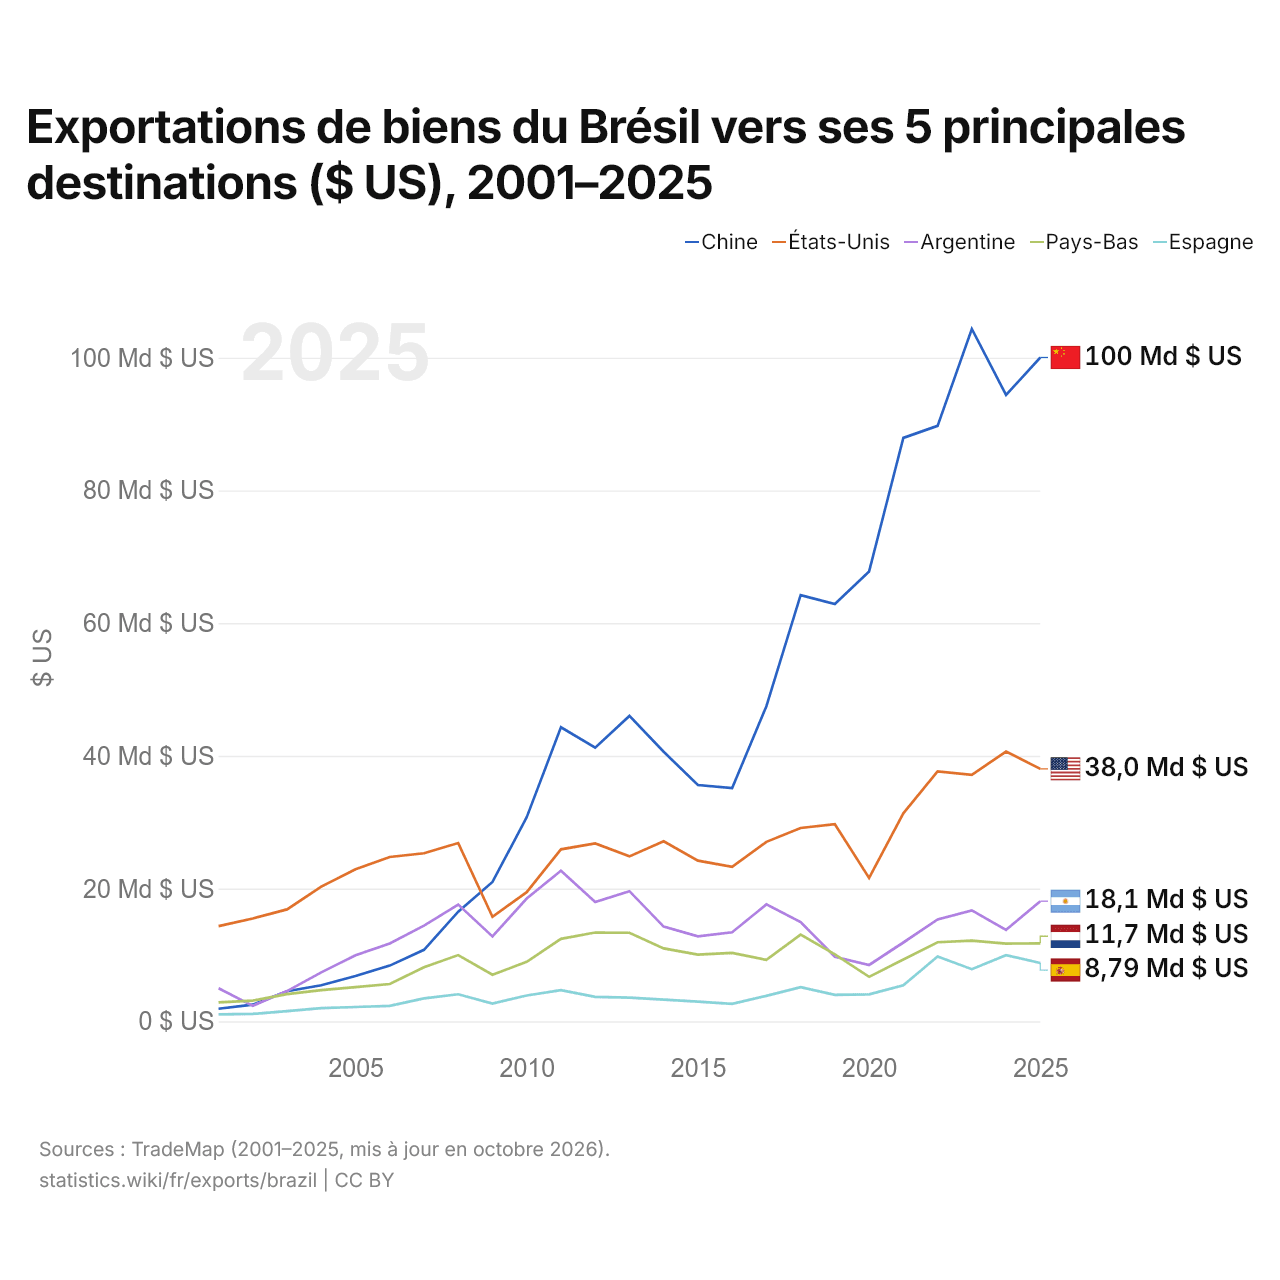
Exportations de biens du Brésil vers ses 5 principales destinations ($ US), 2001–2025
| Année | $ US | ||||
|---|---|---|---|---|---|
| Chine | États-Unis | Argentine | Pays-Bas | Espagne | |
| 2025 | 100 021 441 000 $ US | 38 036 022 000 $ US | 18 105 529 000 $ US | 11 746 416 000 $ US | 8 794 178 000 $ US |
| 2024 | 94 372 037 000 $ US | 40 647 549 000 $ US | 13 777 621 000 $ US | 11 720 075 000 $ US | 9 969 844 000 $ US |
| 2023 | 104 324 812 000 $ US | 37 149 119 000 $ US | 16 712 209 000 $ US | 12 148 382 000 $ US | 7 858 770 000 $ US |
| 2022 | 89 718 899 000 $ US | 37 643 829 000 $ US | 15 348 623 000 $ US | 11 910 549 000 $ US | 9 760 700 000 $ US |
| 2021 | 87 907 888 000 $ US | 31 336 286 000 $ US | 11 878 463 000 $ US | 9 316 020 000 $ US | 5 433 174 000 $ US |
| 2020 | 67 788 075 000 $ US | 21 615 716 000 $ US | 8 488 738 000 $ US | 6 705 000 000 $ US | 4 056 873 000 $ US |
| 2019 | 62 871 652 000 $ US | 29 701 879 000 $ US | 9 723 825 000 $ US | 10 086 120 000 $ US | 3 999 195 000 $ US |
| 2018 | 64 205 647 000 $ US | 29 132 910 000 $ US | 14 951 217 000 $ US | 13 068 031 000 $ US | 5 150 784 000 $ US |
| 2017 | 47 488 449 000 $ US | 27 045 669 000 $ US | 17 618 814 000 $ US | 9 252 265 000 $ US | 3 840 183 000 $ US |
| 2016 | 35 133 590 000 $ US | 23 274 525 000 $ US | 13 417 670 000 $ US | 10 322 800 000 $ US | 2 629 681 000 $ US |
| 2015 | 35 607 524 000 $ US | 24 215 796 000 $ US | 12 800 015 000 $ US | 10 044 466 000 $ US | 2 971 693 000 $ US |
| 2014 | 40 611 877 000 $ US | 27 133 857 000 $ US | 14 277 231 000 $ US | 10 984 245 000 $ US | 3 279 588 000 $ US |
| 2013 | 46 023 192 000 $ US | 24 857 208 000 $ US | 19 612 849 000 $ US | 13 349 719 000 $ US | 3 575 848 000 $ US |
| 2012 | 41 225 811 000 $ US | 26 795 355 000 $ US | 17 986 737 000 $ US | 13 385 969 000 $ US | 3 688 113 000 $ US |
| 2011 | 44 304 608 000 $ US | 25 914 834 000 $ US | 22 701 356 000 $ US | 12 423 402 000 $ US | 4 703 999 000 $ US |
| 2010 | 30 747 554 000 $ US | 19 458 889 000 $ US | 18 507 273 000 $ US | 8 974 761 000 $ US | 3 892 967 000 $ US |
| 2009 | 20 994 920 000 $ US | 15 741 892 000 $ US | 12 781 102 000 $ US | 7 028 560 000 $ US | 2 663 279 000 $ US |
| 2008 | 16 519 994 000 $ US | 26 859 042 000 $ US | 17 598 656 000 $ US | 9 982 185 000 $ US | 4 073 198 000 $ US |
| 2007 | 10 776 728 000 $ US | 25 321 716 000 $ US | 14 409 066 000 $ US | 8 135 147 000 $ US | 3 450 225 000 $ US |
| 2006 | 8 398 204 000 $ US | 24 755 775 000 $ US | 11 733 141 000 $ US | 5 623 658 000 $ US | 2 329 134 000 $ US |
| 2005 | 6 826 868 000 $ US | 22 912 152 000 $ US | 9 967 855 000 $ US | 5 165 122 000 $ US | 2 165 278 000 $ US |
| 2004 | 5 438 638 000 $ US | 20 303 166 000 $ US | 7 371 087 000 $ US | 4 702 039 000 $ US | 1 982 708 000 $ US |
| 2003 | 4 531 201 000 $ US | 16 866 739 000 $ US | 4 559 942 000 $ US | 4 106 475 000 $ US | 1 549 766 000 $ US |
| 2002 | 2 516 554 000 $ US | 15 503 915 000 $ US | 2 337 328 000 $ US | 3 124 132 000 $ US | 1 118 965 000 $ US |
| 2001 | 1 901 251 000 $ US | 14 337 494 000 $ US | 4 993 052 000 $ US | 2 861 307 000 $ US | 1 040 697 000 $ US |
En 2025, les exportations de biens s'élevaient à 100 milliards de dollars vers la Chine, 38 milliards de dollars vers les États-Unis, 18,1 milliards de dollars vers l'Argentine, 11,7 milliards de dollars vers les Pays-Bas et 8,79 milliards de dollars vers l'Espagne. Le premier rang des cinq destinations du Brésil est occupé par la Chine depuis 2009. Le changement le plus récent dans leur ordre remonte à 2020, quand les exportations du Brésil vers l'Argentine ont dépassé celles vers les Pays-Bas.
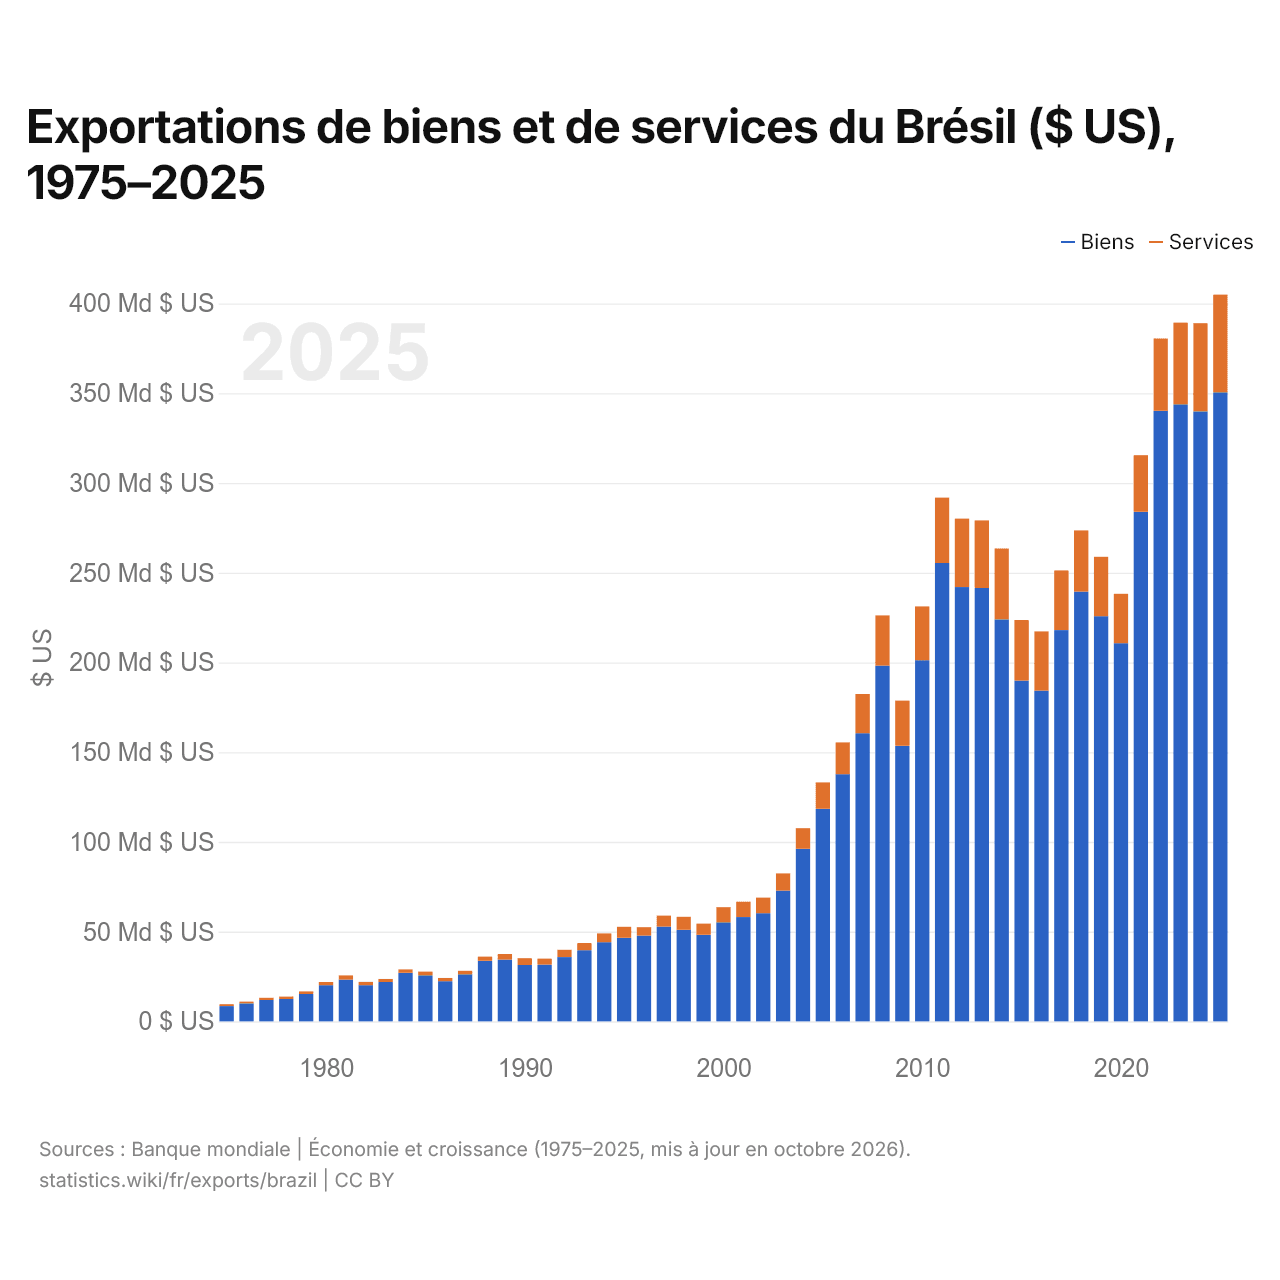
Exportations de biens et de services du Brésil ($ US), 1975–2025
| Année | $ US | |
|---|---|---|
| Biens | Services | |
| 2025 | 350 500 670 640 $ US | 54 420 203 876 $ US |
| 2024 | 339 856 468 700 $ US | 49 119 933 602 $ US |
| 2023 | 343 819 172 039 $ US | 45 485 521 511 $ US |
| 2022 | 340 201 137 676 $ US | 40 291 245 724 $ US |
| 2021 | 283 964 584 795 $ US | 31 481 822 899 $ US |
| 2020 | 210 690 506 941 $ US | 27 513 932 173 $ US |
| 2019 | 225 792 920 698 $ US | 33 033 119 252 $ US |
| 2018 | 239 518 281 272 $ US | 34 044 413 358 $ US |
| 2017 | 218 000 485 818 $ US | 33 257 427 223 $ US |
| 2016 | 184 266 804 706 $ US | 33 053 800 677 $ US |
| 2015 | 189 913 957 044 $ US | 33 674 744 241 $ US |
| 2014 | 223 971 304 319 $ US | 39 497 929 858 $ US |
| 2013 | 241 511 056 475 $ US | 37 630 635 779 $ US |
| 2012 | 241 982 433 455 $ US | 38 195 678 229 $ US |
| 2011 | 255 402 574 914 $ US | 36 436 720 330 $ US |
| 2010 | 201 197 085 781 $ US | 30 060 848 688 $ US |
| 2009 | 153 525 261 683 $ US | 25 195 308 259 $ US |
| 2008 | 198 214 040 085 $ US | 27 985 433 880 $ US |
| 2007 | 160 540 246 755 $ US | 21 824 000 137 $ US |
| 2006 | 137 708 800 759 $ US | 17 730 530 325 $ US |
| 2005 | 118 413 811 544 $ US | 14 762 690 788 $ US |
| 2004 | 96 097 603 410 $ US | 11 548 779 177 $ US |
| 2003 | 72 883 461 454 $ US | 9 578 042 993 $ US |
| 2002 | 60 278 560 129 $ US | 8 711 869 480 $ US |
| 2001 | 58 105 671 219 $ US | 8 555 964 165 $ US |
| 2000 | 55 187 572 648 $ US | 8 396 328 525 $ US |
| 1999 | 48 197 279 310 $ US | 6 297 722 250 $ US |
| 1998 | 51 045 291 549 $ US | 7 192 734 332 $ US |
| 1997 | 52 787 328 532 $ US | 6 170 229 739 $ US |
| 1996 | 47 746 000 000 $ US | 4 760 000 000 $ US |
| 1995 | 46 506 000 000 $ US | 6 135 000 000 $ US |
| 1994 | 44 102 000 000 $ US | 4 908 000 000 $ US |
| 1993 | 39 624 000 000 $ US | 3 971 000 000 $ US |
| 1992 | 35 793 000 000 $ US | 4 088 000 000 $ US |
| 1991 | 31 619 000 000 $ US | 3 319 000 000 $ US |
| 1990 | 31 408 000 000 $ US | 3 762 000 000 $ US |
| 1989 | 34 375 000 000 $ US | 3 132 000 000 $ US |
| 1988 | 33 773 000 000 $ US | 2 279 000 000 $ US |
| 1987 | 26 210 000 000 $ US | 1 952 000 000 $ US |
| 1986 | 22 348 000 000 $ US | 1 816 000 000 $ US |
| 1985 | 25 634 000 000 $ US | 2 086 000 000 $ US |
| 1984 | 27 002 000 000 $ US | 1 947 000 000 $ US |
| 1983 | 21 898 000 000 $ US | 1 724 000 000 $ US |
| 1982 | 20 173 000 000 $ US | 1 809 000 000 $ US |
| 1981 | 23 276 000 000 $ US | 2 265 000 000 $ US |
| 1980 | 20 132 000 000 $ US | 1 737 000 000 $ US |
| 1979 | 15 244 000 000 $ US | 1 475 000 000 $ US |
| 1978 | 12 473 000 000 $ US | 1 350 000 000 $ US |
| 1977 | 11 923 000 000 $ US | 1 207 000 000 $ US |
| 1976 | 9 961 000 000 $ US | 1 018 000 000 $ US |
| 1975 | 8 492 000 000 $ US | 1 060 000 000 $ US |
En 2025, les exportations de biens du Brésil s'élevaient à 351 milliards de dollars et celles de services à 54,4 milliards de dollars ; les services représentaient 13,4 % du total, contre 11,1 % en 1975.
Le Brésil dans le classement mondial des exportations, 2025
| Rang | Pays | Exportations | Part mondiale | |
|---|---|---|---|---|
| 22 |
 Russie |
466 Md $US | 1,34 % | vs Russie |
| 23 |
 Australie |
418 Md $US | 1,2 % | vs Australie |
| 24 |
 Thaïlande |
411 Md $US | 1,18 % | vs Thaïlande |
| 25 |
 Brésil |
406 Md $US | 1,16 % | |
| 26 |
 Turquie |
397 Md $US | 1,14 % | vs Turquie |
| 27 |
 Arabie saoudite |
380 Md $US | 1,09 % | |
| 28 |
 Suède |
356 Md $US | 1,02 % |
Exportations de biens et services du Brésil, % du PIB, 1960–2025
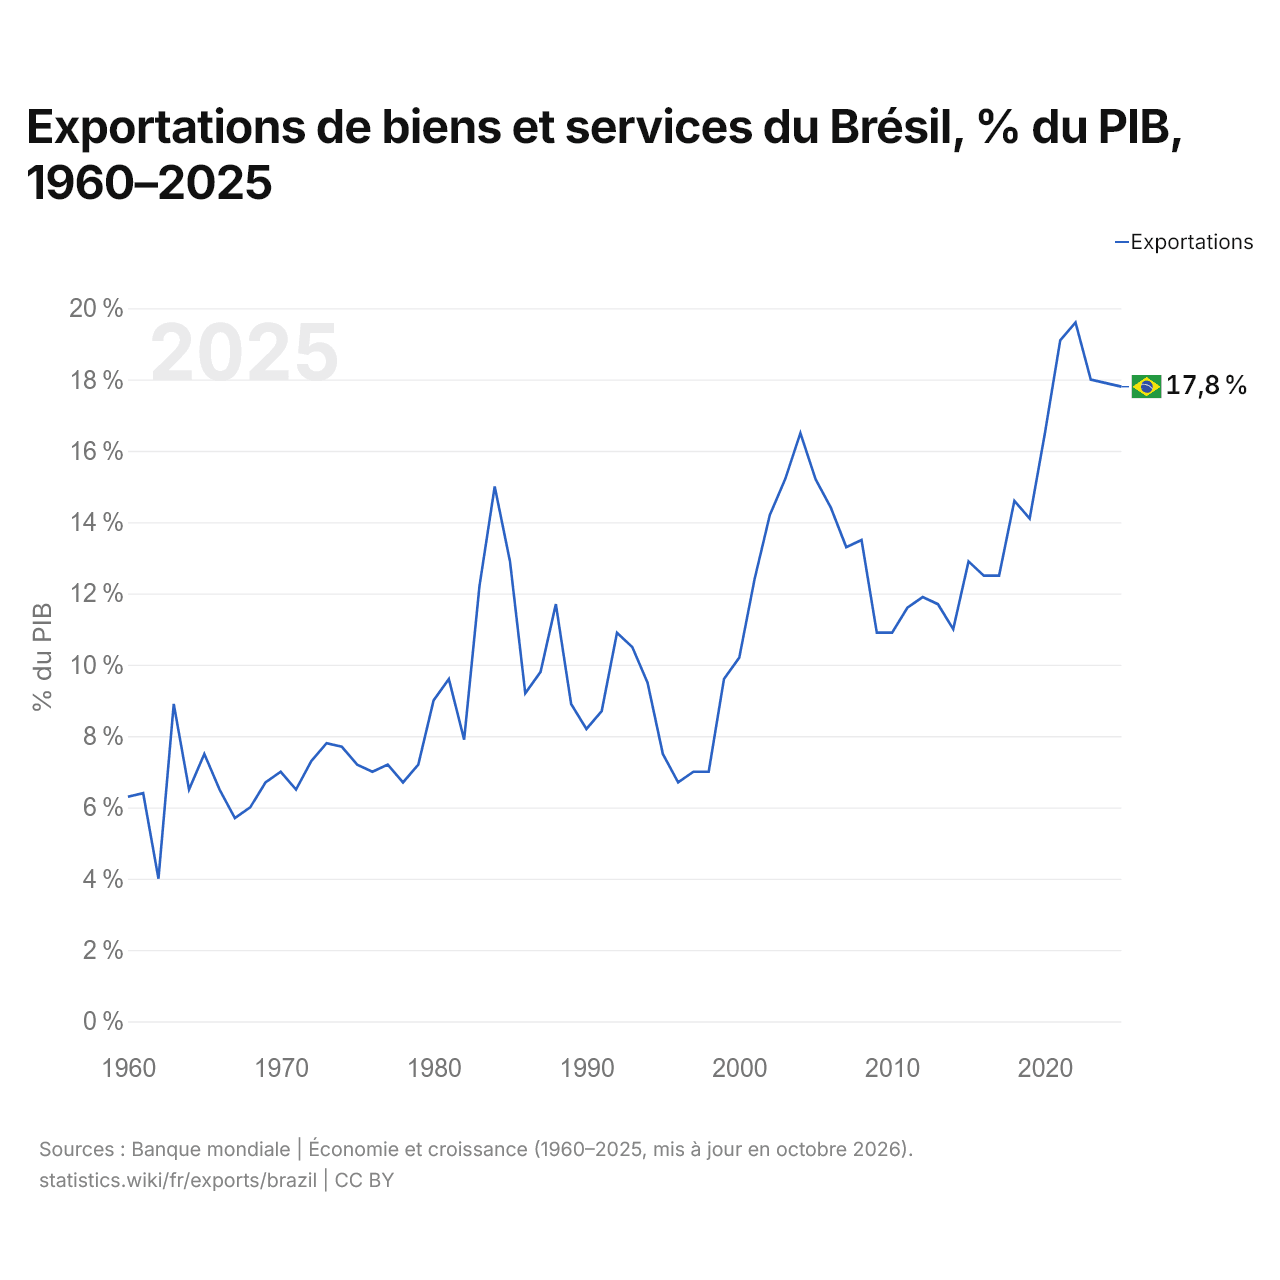
En 2025, les exportations de biens et services du Brésil équivalaient à 17,8 % de son PIB, contre 6,3 % en 1960. La part la plus élevée a été de 19,6 %, en 2022.
Comparer les exportations du Brésil avec celles d'autres pays
Sources :
- TradeMap (2001–2025, mis à jour en octobre 2026)
- Banque mondiale | Économie et croissance (1960–2025, mis à jour en octobre 2026)
Creative Commons Attribution (CC BY) : vous pouvez copier, partager, adapter et réutiliser ce contenu, y compris à des fins commerciales, à condition de citer statistics.wiki et d’indiquer les modifications apportées. Les sources citées ci-dessus peuvent avoir leurs propres conditions de licence.