
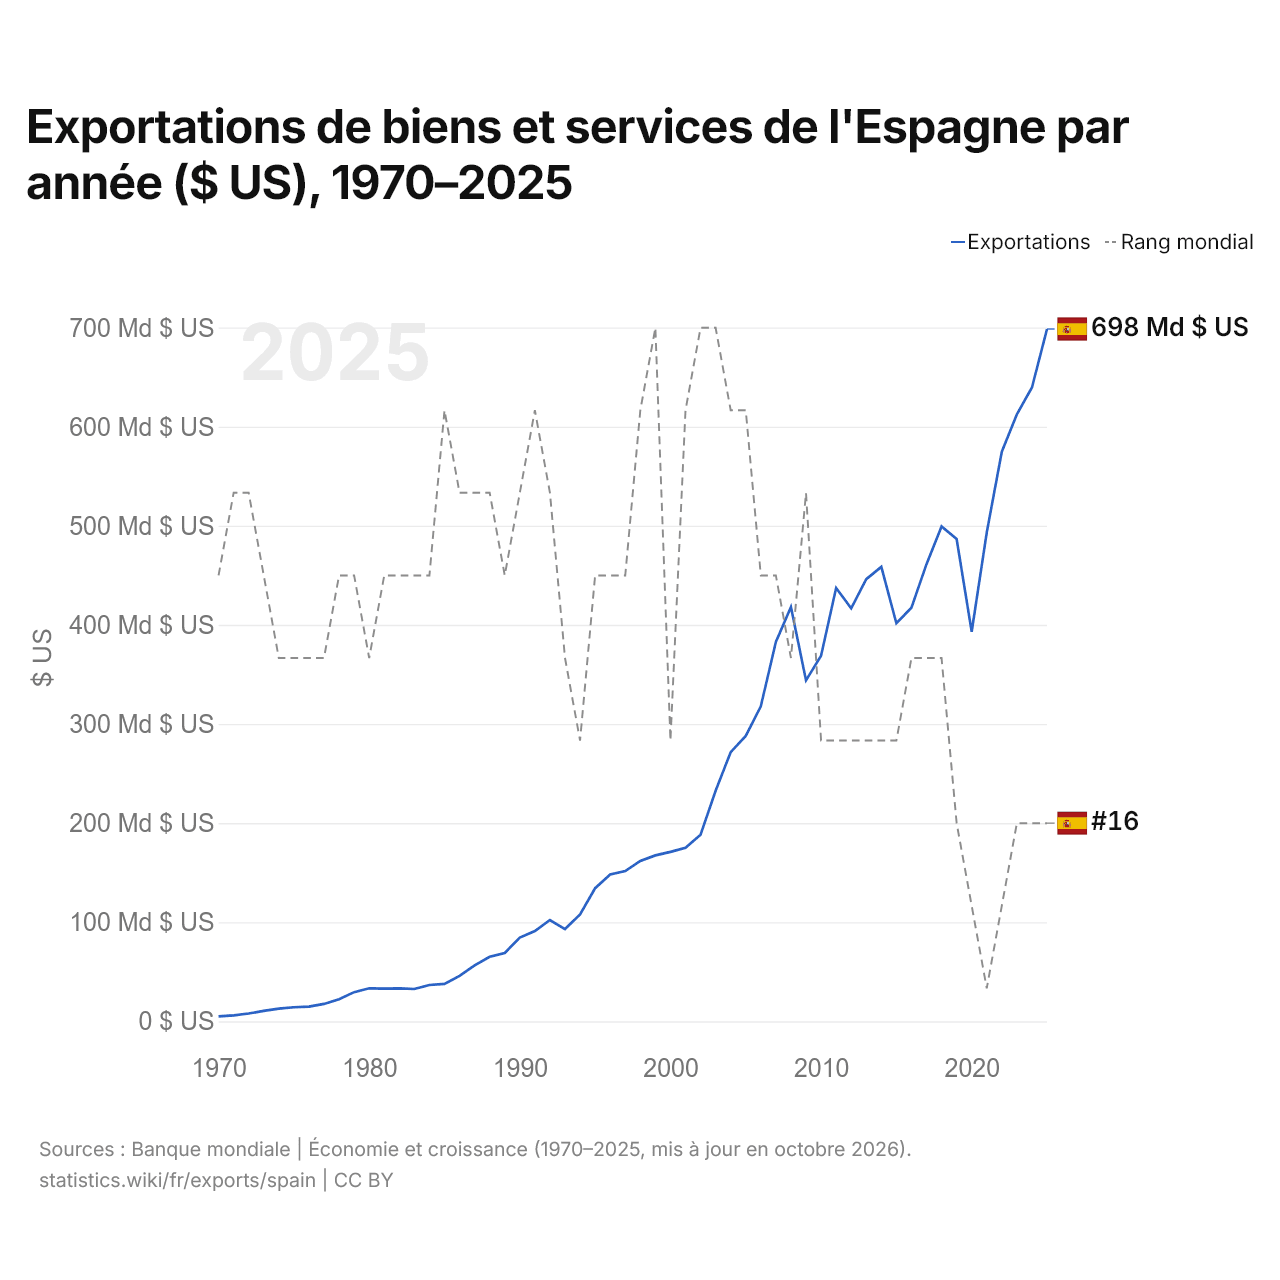
Exportations de biens et services de l'Espagne par année ($ US), 1970–2025
| Année | $ US | Rang mondial |
|---|---|---|
| Exportations | Rang mondial | |
| 2025 | 698 476 476 631 $ US | #16 |
| 2024 | 639 462 804 274 $ US | #16 |
| 2023 | 612 433 794 394 $ US | #16 |
| 2022 | 574 783 432 054 $ US | #17 |
| 2021 | 493 273 673 721 $ US | #18 |
| 2020 | 393 139 331 916 $ US | #17 |
| 2019 | 486 670 273 122 $ US | #16 |
| 2018 | 499 282 766 700 $ US | #14 |
| 2017 | 461 297 400 644 $ US | #14 |
| 2016 | 417 367 780 825 $ US | #14 |
| 2015 | 401 637 009 329 $ US | #15 |
| 2014 | 458 508 132 692 $ US | #15 |
| 2013 | 446 190 552 101 $ US | #15 |
| 2012 | 416 597 866 010 $ US | #15 |
| 2011 | 437 172 778 239 $ US | #15 |
| 2010 | 368 818 353 817 $ US | #15 |
| 2009 | 343 996 583 489 $ US | #12 |
| 2008 | 417 991 645 730 $ US | #14 |
| 2007 | 382 818 371 650 $ US | #13 |
| 2006 | 317 776 995 049 $ US | #13 |
| 2005 | 287 980 772 159 $ US | #11 |
| 2004 | 271 611 046 439 $ US | #11 |
| 2003 | 232 580 150 552 $ US | #10 |
| 2002 | 188 324 245 464 $ US | #10 |
| 2001 | 175 010 487 833 $ US | #11 |
| 2000 | 170 991 162 038 $ US | #15 |
| 1999 | 167 415 361 762 $ US | #10 |
| 1998 | 161 797 527 564 $ US | #11 |
| 1997 | 151 657 954 545 $ US | #13 |
| 1996 | 148 187 311 178 $ US | #13 |
| 1995 | 134 295 436 349 $ US | #13 |
| 1994 | 107 879 062 228 $ US | #15 |
| 1993 | 93 084 945 745 $ US | #14 |
| 1992 | 102 239 554 689 $ US | #12 |
| 1991 | 91 063 265 012 $ US | #11 |
| 1990 | 84 463 395 364 $ US | #12 |
| 1989 | 68 933 506 676 $ US | #13 |
| 1988 | 65 156 156 263 $ US | #12 |
| 1987 | 56 558 264 385 $ US | #12 |
| 1986 | 45 782 844 244 $ US | #12 |
| 1985 | 37 762 612 524 $ US | #11 |
| 1984 | 36 702 571 931 $ US | #13 |
| 1983 | 32 644 516 241 $ US | #13 |
| 1982 | 33 310 336 211 $ US | #13 |
| 1981 | 33 059 607 136 $ US | #13 |
| 1980 | 33 299 965 189 $ US | #14 |
| 1979 | 29 440 976 698 $ US | #13 |
| 1978 | 22 314 444 444 $ US | #13 |
| 1977 | 17 570 821 468 $ US | #14 |
| 1976 | 14 908 642 129 $ US | #14 |
| 1975 | 14 219 846 377 $ US | #14 |
| 1974 | 12 838 993 366 $ US | #14 |
| 1973 | 10 487 210 166 $ US | #13 |
| 1972 | 7 896 181 724 $ US | #12 |
| 1971 | 6 073 291 018 $ US | #12 |
| 1970 | 4 978 036 606 $ US | #13 |
En 2025, les exportations de biens et services de l'Espagne s'élevaient à 698 milliards de dollars, contre 4,98 milliards de dollars en 1970. Elles se classaient au 16e rang mondial, un rang qu'elles occupent depuis 2023. Leur meilleur rang a été le 10e, occupé pour la dernière fois en 2003.
En 2025, les exportations de biens et services de l'Espagne étaient les 8es plus élevées de 41 pays situés en Europe. Les importations de biens et services de l'Espagne s'élevaient à 626 milliards de dollars en 2025, au 16e rang mondial. En 2025, les exportations de l'Espagne dépassaient ses importations de 72,9 milliards de dollars, soit un excédent commercial.
Exportations de biens de l'Espagne par catégorie, 2025
Exportations de biens, 2025: 433 Md $US
En 2025, la première catégorie des exportations de biens de l'Espagne était « machines, électronique et véhicules », avec 30,1 %, suivie de « produits chimiques, pharmaceutiques et plastiques », avec 16,0 %.
Destinations des exportations de biens de l'Espagne : les 10 premières, 2025
| Rang | Pays | Exportations de biens | Part | |
|---|---|---|---|---|
| 1 |
 France |
61,3 Md $US | 14,1 % | vs France |
| 2 |
 Allemagne |
43,4 Md $US | 10 % | vs Allemagne |
| 3 |
 Portugal |
37,7 Md $US | 8,69 % | vs Portugal |
| 4 |
 Italie |
34,9 Md $US | 8,05 % | vs Italie |
| 5 |
 Royaume-Uni |
27,5 Md $US | 6,35 % | vs R.-U. |
| 6 |
 États-Unis |
18,2 Md $US | 4,2 % | vs USA |
| 7 |
 Pays-Bas |
15,5 Md $US | 3,59 % | vs Pays-Bas |
| 8 |
 Belgique |
13,9 Md $US | 3,22 % | vs Belgique |
| 9 |
 Maroc |
13,0 Md $US | 3,01 % | vs Maroc |
| 10 |
 Pologne |
11,3 Md $US | 2,62 % | vs Pologne |
| Autres partenaires et non précisés | 157 Md $US | 36,1 % |
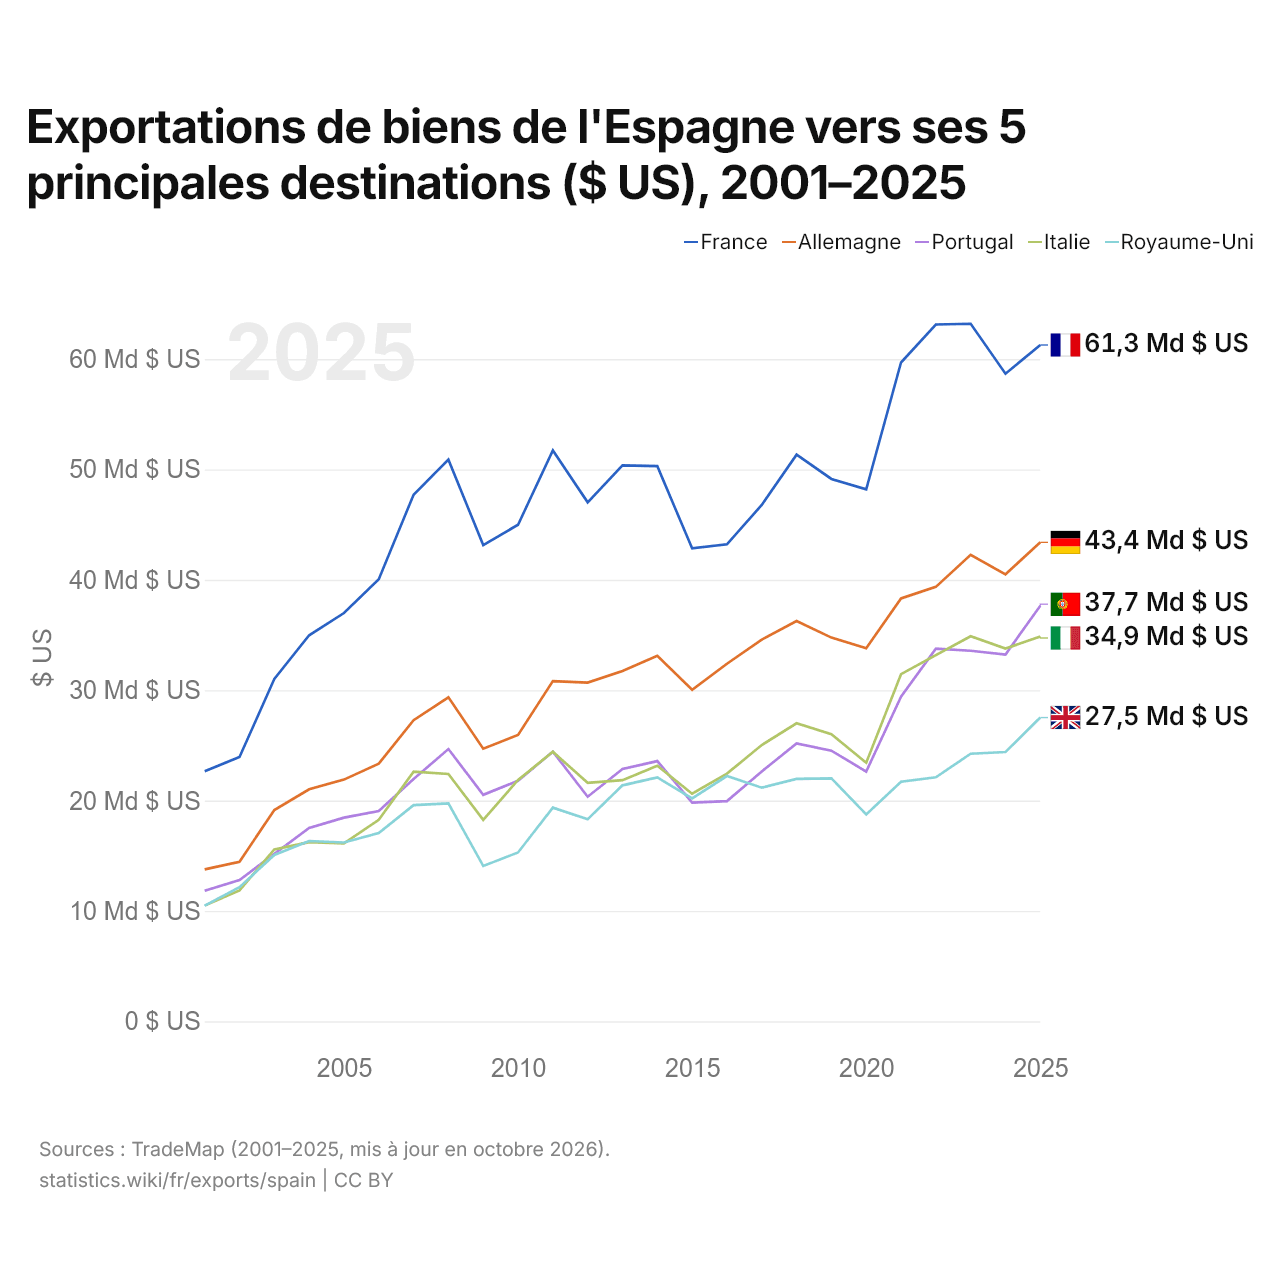
Exportations de biens de l'Espagne vers ses 5 principales destinations ($ US), 2001–2025
| Année | $ US | ||||
|---|---|---|---|---|---|
| France | Allemagne | Portugal | Italie | Royaume-Uni | |
| 2025 | 61 275 804 000 $ US | 43 397 239 000 $ US | 37 654 081 000 $ US | 34 868 424 000 $ US | 27 521 667 000 $ US |
| 2024 | 58 673 565 000 $ US | 40 500 651 000 $ US | 33 229 745 000 $ US | 33 768 449 000 $ US | 24 403 544 000 $ US |
| 2023 | 63 199 187 000 $ US | 42 267 936 000 $ US | 33 573 982 000 $ US | 34 891 322 000 $ US | 24 244 335 000 $ US |
| 2022 | 63 131 178 000 $ US | 39 359 539 000 $ US | 33 757 082 000 $ US | 33 172 514 000 $ US | 22 111 481 000 $ US |
| 2021 | 59 692 970 000 $ US | 38 320 461 000 $ US | 29 415 993 000 $ US | 31 450 763 000 $ US | 21 704 474 000 $ US |
| 2020 | 48 195 273 000 $ US | 33 805 203 000 $ US | 22 626 713 000 $ US | 23 430 464 000 $ US | 18 748 465 000 $ US |
| 2019 | 49 137 280 000 $ US | 34 766 015 000 $ US | 24 522 419 000 $ US | 26 008 632 000 $ US | 22 016 029 000 $ US |
| 2018 | 51 345 680 000 $ US | 36 264 844 000 $ US | 25 172 530 000 $ US | 27 005 531 000 $ US | 21 961 683 000 $ US |
| 2017 | 46 786 179 000 $ US | 34 581 753 000 $ US | 22 641 539 000 $ US | 25 029 329 000 $ US | 21 170 552 000 $ US |
| 2016 | 43 216 808 000 $ US | 32 397 303 000 $ US | 19 956 187 000 $ US | 22 441 700 000 $ US | 22 219 737 000 $ US |
| 2015 | 42 853 366 000 $ US | 30 043 110 000 $ US | 19 815 309 000 $ US | 20 620 055 000 $ US | 20 200 824 000 $ US |
| 2014 | 50 299 334 000 $ US | 33 119 659 000 $ US | 23 577 911 000 $ US | 23 149 901 000 $ US | 22 095 900 000 $ US |
| 2013 | 50 369 925 000 $ US | 31 732 687 000 $ US | 22 864 855 000 $ US | 21 847 840 000 $ US | 21 382 180 000 $ US |
| 2012 | 47 017 178 000 $ US | 30 687 957 000 $ US | 20 346 175 000 $ US | 21 605 098 000 $ US | 18 309 887 000 $ US |
| 2011 | 51 723 640 000 $ US | 30 822 427 000 $ US | 24 436 539 000 $ US | 24 421 965 000 $ US | 19 359 536 000 $ US |
| 2010 | 44 989 055 000 $ US | 25 948 277 000 $ US | 21 790 426 000 $ US | 21 866 842 000 $ US | 15 297 107 000 $ US |
| 2009 | 43 148 948 000 $ US | 24 697 685 000 $ US | 20 523 080 000 $ US | 18 246 376 000 $ US | 14 081 720 000 $ US |
| 2008 | 50 890 645 000 $ US | 29 357 782 000 $ US | 24 669 295 000 $ US | 22 410 358 000 $ US | 19 743 920 000 $ US |
| 2007 | 47 713 513 000 $ US | 27 284 735 000 $ US | 21 949 586 000 $ US | 22 615 343 000 $ US | 19 584 488 000 $ US |
| 2006 | 40 045 734 000 $ US | 23 341 135 000 $ US | 19 051 266 000 $ US | 18 260 584 000 $ US | 17 050 061 000 $ US |
| 2005 | 36 990 397 000 $ US | 21 900 941 000 $ US | 18 456 011 000 $ US | 16 127 841 000 $ US | 16 201 490 000 $ US |
| 2004 | 34 979 587 000 $ US | 21 027 279 000 $ US | 17 522 028 000 $ US | 16 240 050 000 $ US | 16 335 464 000 $ US |
| 2003 | 31 019 047 000 $ US | 19 147 738 000 $ US | 15 168 489 000 $ US | 15 570 813 000 $ US | 15 068 094 000 $ US |
| 2002 | 23 943 857 000 $ US | 14 463 925 000 $ US | 12 807 317 000 $ US | 11 863 502 000 $ US | 12 150 448 000 $ US |
| 2001 | 22 667 966 000 $ US | 13 763 106 000 $ US | 11 836 885 000 $ US | 10 481 154 000 $ US | 10 485 673 000 $ US |
En 2025, les exportations de biens s'élevaient à 61,3 milliards de dollars vers la France, 43,4 milliards de dollars vers l'Allemagne, 37,7 milliards de dollars vers le Portugal, 34,9 milliards de dollars vers l'Italie et 27,5 milliards de dollars vers le Royaume-Uni. Le premier rang des cinq destinations de l'Espagne est occupé par la France chaque année depuis 2001. Le changement le plus récent dans leur ordre remonte à 2025, quand les exportations de l'Espagne vers le Portugal ont dépassé celles vers l'Italie.
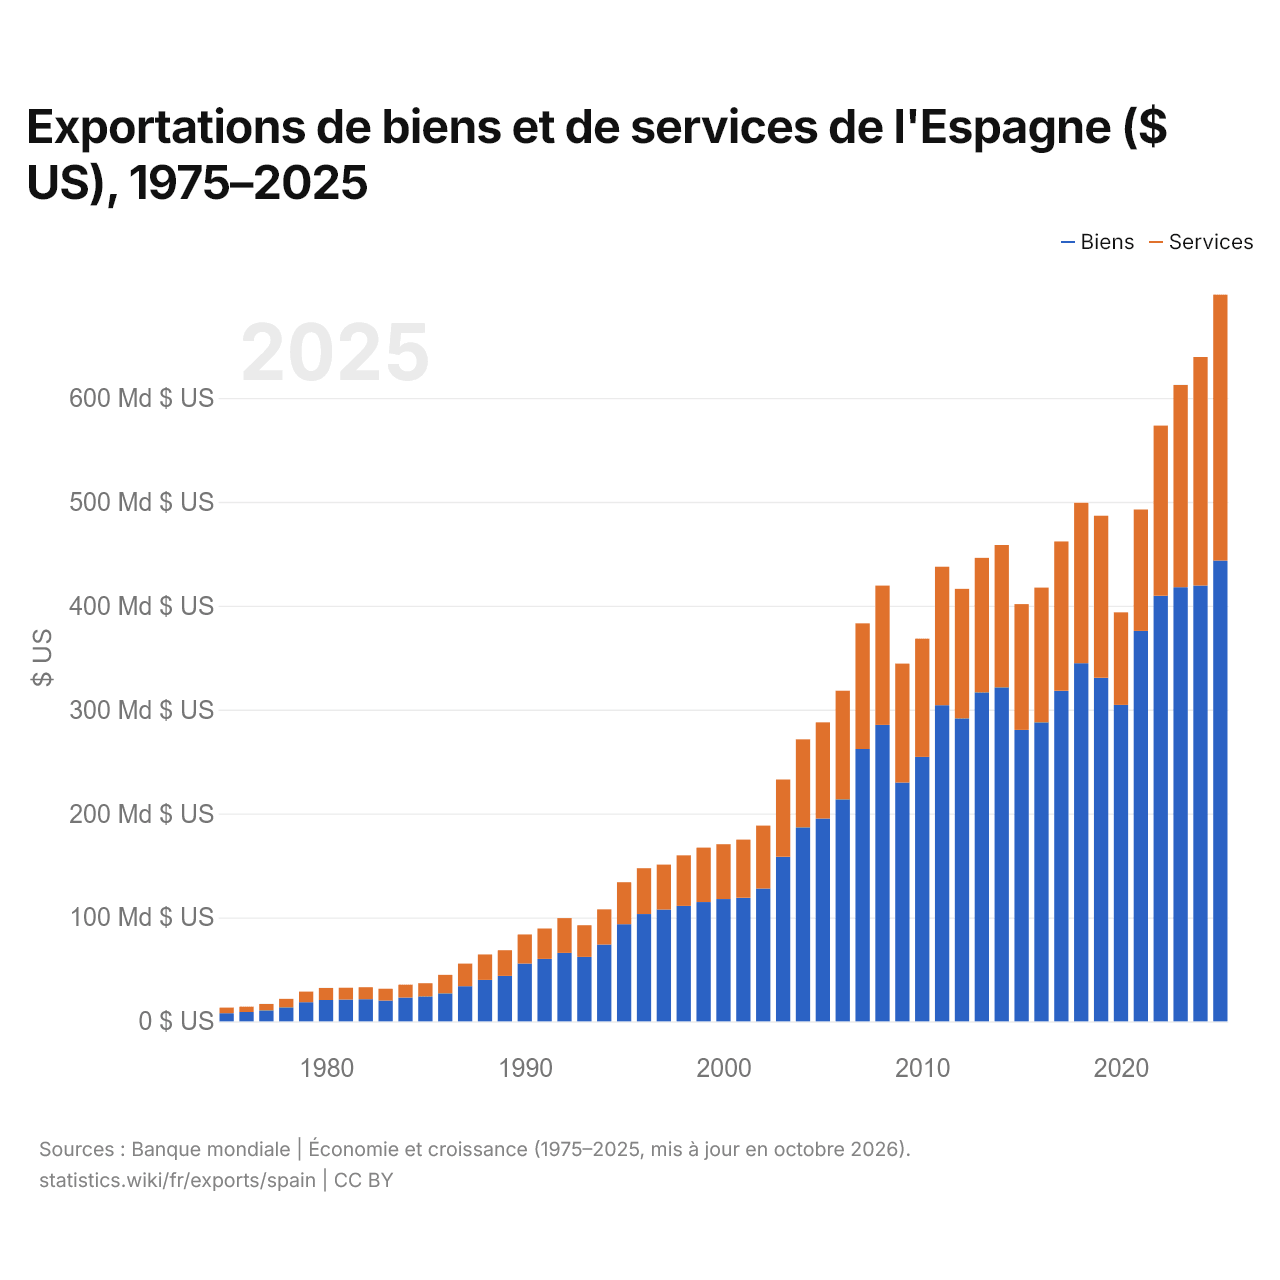
Exportations de biens et de services de l'Espagne ($ US), 1975–2025
| Année | $ US | |
|---|---|---|
| Biens | Services | |
| 2025 | 443 345 989 032 $ US | 255 992 696 095 $ US |
| 2024 | 419 448 139 536 $ US | 219 912 010 393 $ US |
| 2023 | 417 762 163 962 $ US | 194 724 569 292 $ US |
| 2022 | 409 584 756 471 $ US | 163 752 107 945 $ US |
| 2021 | 375 754 328 675 $ US | 116 812 727 335 $ US |
| 2020 | 304 605 110 793 $ US | 88 997 096 010 $ US |
| 2019 | 330 670 735 499 $ US | 155 918 836 943 $ US |
| 2018 | 344 687 780 659 $ US | 154 304 819 763 $ US |
| 2017 | 318 157 430 885 $ US | 143 683 412 479 $ US |
| 2016 | 287 712 088 283 $ US | 129 706 004 996 $ US |
| 2015 | 280 504 041 253 $ US | 121 048 902 391 $ US |
| 2014 | 321 490 862 993 $ US | 136 944 647 597 $ US |
| 2013 | 316 521 411 544 $ US | 129 519 363 018 $ US |
| 2012 | 291 515 484 570 $ US | 124 767 588 710 $ US |
| 2011 | 304 217 312 789 $ US | 133 316 579 457 $ US |
| 2010 | 254 565 471 687 $ US | 113 720 283 813 $ US |
| 2009 | 229 830 701 311 $ US | 114 497 428 293 $ US |
| 2008 | 285 322 727 190 $ US | 134 000 557 997 $ US |
| 2007 | 262 113 097 281 $ US | 120 867 933 633 $ US |
| 2006 | 213 661 282 300 $ US | 104 513 451 076 $ US |
| 2005 | 195 073 930 627 $ US | 92 648 863 722 $ US |
| 2004 | 186 630 563 855 $ US | 84 808 818 480 $ US |
| 2003 | 158 381 207 006 $ US | 74 365 363 467 $ US |
| 2002 | 127 738 943 901 $ US | 60 636 193 868 $ US |
| 2001 | 118 911 233 064 $ US | 55 963 330 687 $ US |
| 2000 | 117 680 994 768 $ US | 52 805 402 060 $ US |
| 1999 | 114 768 537 035 $ US | 52 423 413 696 $ US |
| 1998 | 111 179 652 835 $ US | 48 602 301 862 $ US |
| 1997 | 107 554 906 596 $ US | 43 309 671 638 $ US |
| 1996 | 103 236 926 608 $ US | 44 082 589 445 $ US |
| 1995 | 93 490 417 576 $ US | 40 419 916 877 $ US |
| 1994 | 73 968 443 401 $ US | 33 815 815 245 $ US |
| 1993 | 62 018 683 096 $ US | 30 449 125 666 $ US |
| 1992 | 65 847 035 601 $ US | 33 490 003 619 $ US |
| 1991 | 60 166 814 753 $ US | 29 170 874 542 $ US |
| 1990 | 55 657 617 114 $ US | 27 936 975 049 $ US |
| 1989 | 43 783 030 150 $ US | 24 617 674 457 $ US |
| 1988 | 39 945 426 892 $ US | 24 456 612 402 $ US |
| 1987 | 33 861 409 837 $ US | 21 705 339 606 $ US |
| 1986 | 26 875 768 096 $ US | 17 835 669 125 $ US |
| 1985 | 23 959 552 537 $ US | 12 723 146 517 $ US |
| 1984 | 22 964 530 676 $ US | 12 338 801 112 $ US |
| 1983 | 20 004 108 400 $ US | 11 365 066 188 $ US |
| 1982 | 21 288 329 911 $ US | 11 541 515 969 $ US |
| 1981 | 20 973 667 222 $ US | 11 330 920 902 $ US |
| 1980 | 20 546 771 287 $ US | 11 593 348 448 $ US |
| 1979 | 18 356 978 259 $ US | 10 285 107 410 $ US |
| 1978 | 13 491 229 193 $ US | 8 195 300 861 $ US |
| 1977 | 10 600 891 398 $ US | 6 151 894 276 $ US |
| 1976 | 9 015 180 711 $ US | 5 105 474 373 $ US |
| 1975 | 7 821 050 192 $ US | 5 434 092 162 $ US |
En 2025, les exportations de biens de l'Espagne s'élevaient à 443 milliards de dollars et celles de services à 256 milliards de dollars ; les services représentaient 36,6 % du total, contre 41,0 % en 1975.
L'Espagne dans le classement mondial des exportations, 2025
| Rang | Pays | Exportations | Part mondiale | |
|---|---|---|---|---|
| 13 |
 Suisse |
815 Md $US | 2,33 % | vs Suisse |
| 14 |
 Canada |
727 Md $US | 2,08 % | vs Canada |
| 15 |
 Mexique |
727 Md $US | 2,08 % | vs Mexique |
| 16 |
 Espagne |
698 Md $US | 2 % | |
| 17 |
 Taïwan |
679 Md $US | 1,94 % | |
| 18 |
 EAU |
558 Md $US (2023) | 1,79 % | |
| 19 |
Belgique
|
547 Md $US | 1,57 % | vs Belgique |
Exportations de biens et services de l'Espagne, % du PIB, 1970–2025
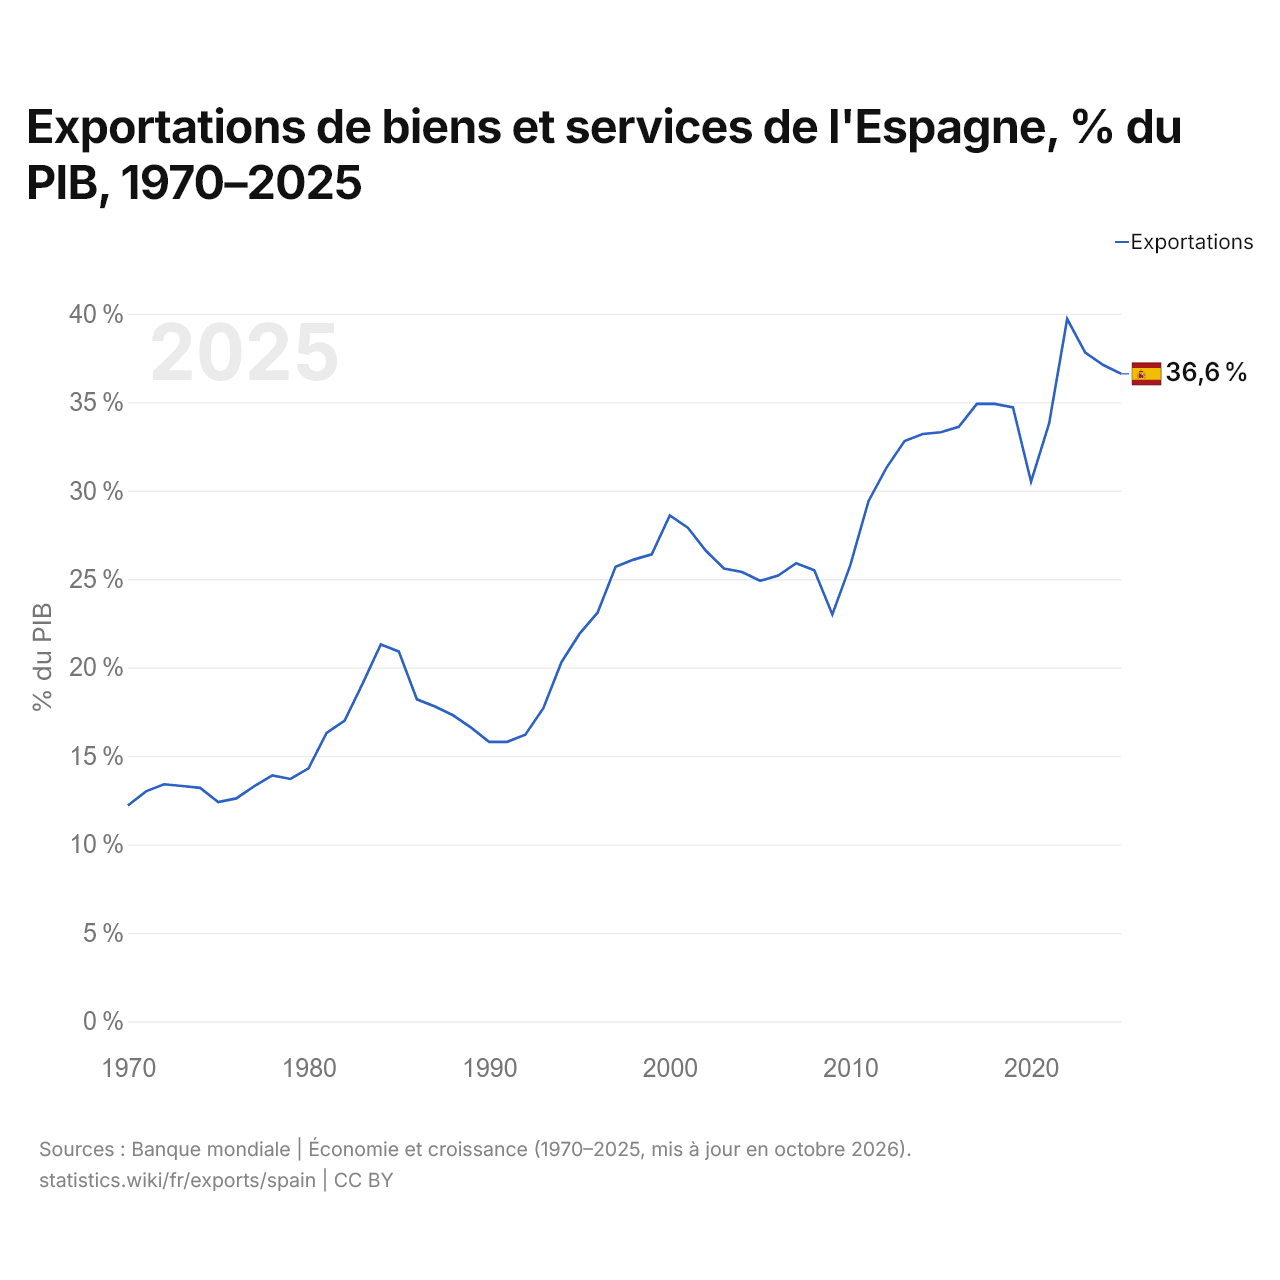
En 2025, les exportations de biens et services de l'Espagne équivalaient à 36,6 % de son PIB, contre 12,2 % en 1970. La part la plus élevée a été de 39,7 %, en 2022.
Comparer les exportations de l'Espagne avec celles d'autres pays
Sources :
- TradeMap (2001–2025, mis à jour en octobre 2026)
- Banque mondiale | Économie et croissance (1970–2025, mis à jour en octobre 2026)
Creative Commons Attribution (CC BY) : vous pouvez copier, partager, adapter et réutiliser ce contenu, y compris à des fins commerciales, à condition de citer statistics.wiki et d’indiquer les modifications apportées. Les sources citées ci-dessus peuvent avoir leurs propres conditions de licence.