
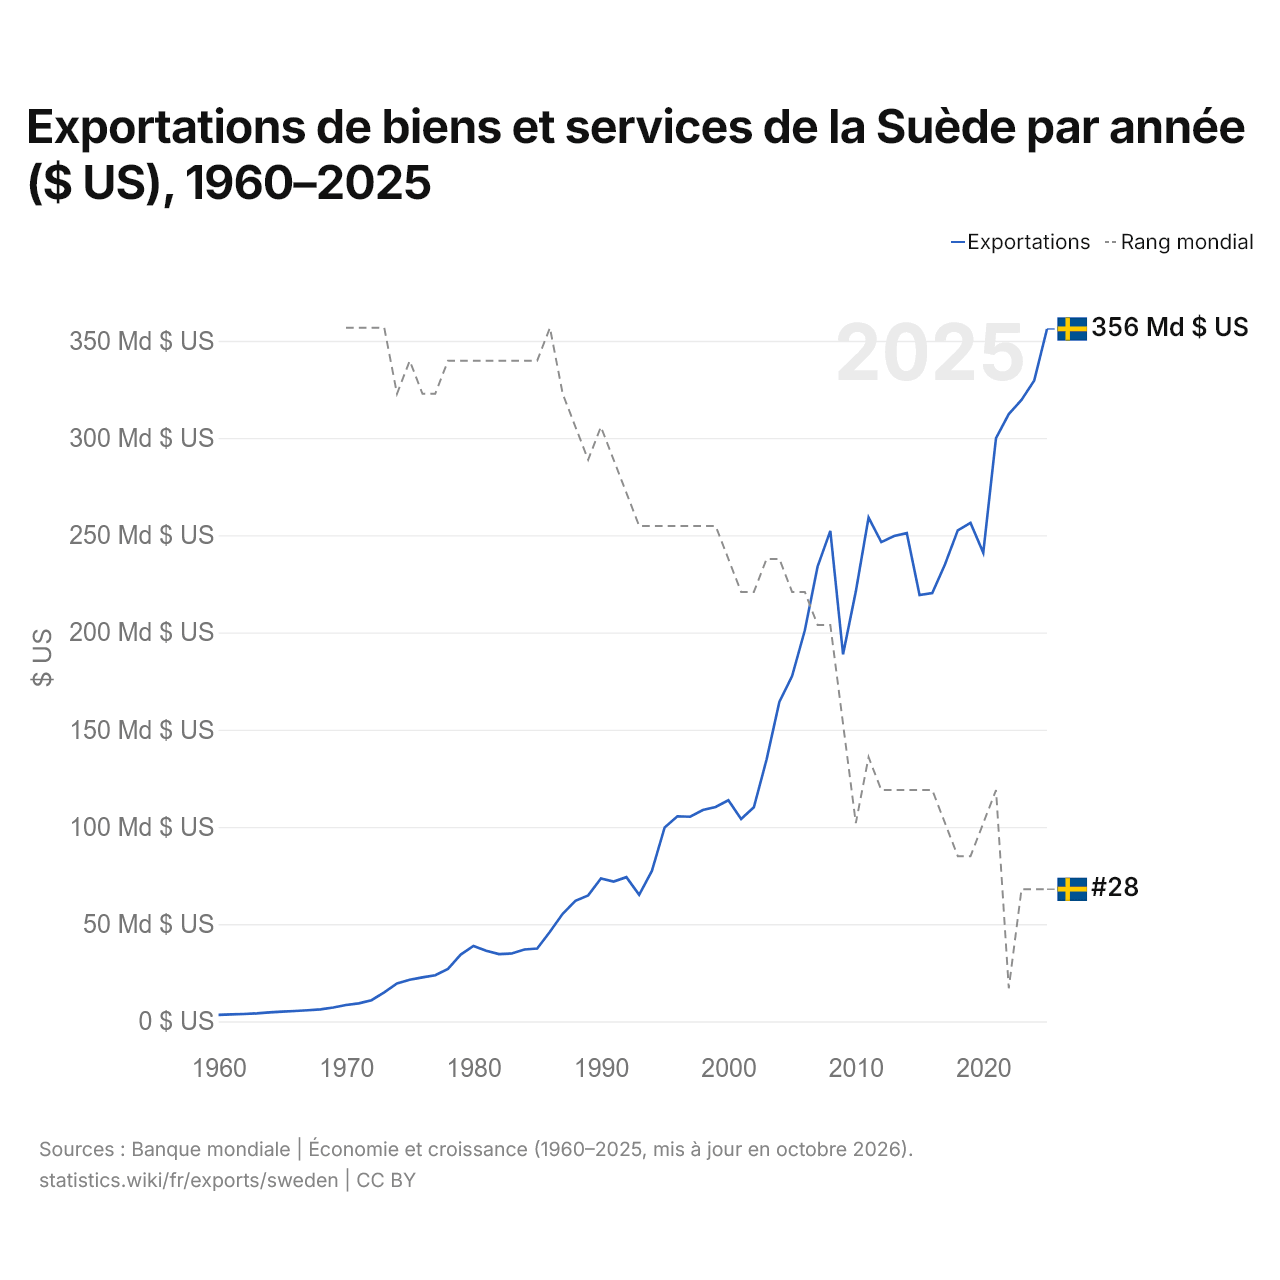
Exportations de biens et services de la Suède par année ($ US), 1960–2025
| Année | $ US | Rang mondial |
|---|---|---|
| Exportations | Rang mondial | |
| 2025 | 356 098 645 397 $ US | #28 |
| 2024 | 329 613 629 462 $ US | #28 |
| 2023 | 319 579 119 038 $ US | #28 |
| 2022 | 312 333 054 945 $ US | #31 |
| 2021 | 299 954 758 724 $ US | #25 |
| 2020 | 241 040 989 303 $ US | #26 |
| 2019 | 256 361 650 143 $ US | #27 |
| 2018 | 252 513 588 793 $ US | #27 |
| 2017 | 235 035 642 663 $ US | #26 |
| 2016 | 220 294 654 962 $ US | #25 |
| 2015 | 219 257 723 595 $ US | #25 |
| 2014 | 251 073 164 368 $ US | #25 |
| 2013 | 249 633 416 172 $ US | #25 |
| 2012 | 246 467 911 084 $ US | #25 |
| 2011 | 259 105 070 011 $ US | #24 |
| 2010 | 221 131 967 531 $ US | #26 |
| 2009 | 188 748 072 853 $ US | #23 |
| 2008 | 252 233 466 341 $ US | #20 |
| 2007 | 233 870 509 558 $ US | #20 |
| 2006 | 201 116 532 488 $ US | #19 |
| 2005 | 177 558 710 575 $ US | #19 |
| 2004 | 164 273 700 826 $ US | #18 |
| 2003 | 134 751 740 598 $ US | #18 |
| 2002 | 110 054 739 091 $ US | #19 |
| 2001 | 104 030 360 825 $ US | #19 |
| 2000 | 113 693 763 507 $ US | #18 |
| 1999 | 110 212 408 017 $ US | #17 |
| 1998 | 108 707 782 488 $ US | #17 |
| 1997 | 105 238 706 466 $ US | #17 |
| 1996 | 105 471 368 923 $ US | #17 |
| 1995 | 99 716 260 356 $ US | #17 |
| 1994 | 77 327 890 098 $ US | #17 |
| 1993 | 65 075 545 391 $ US | #17 |
| 1992 | 74 162 970 569 $ US | #16 |
| 1991 | 71 908 405 788 $ US | #15 |
| 1990 | 73 469 841 353 $ US | #14 |
| 1989 | 64 788 686 811 $ US | #15 |
| 1988 | 62 002 451 691 $ US | #14 |
| 1987 | 55 328 058 324 $ US | #13 |
| 1986 | 46 083 452 608 $ US | #11 |
| 1985 | 37 450 573 228 $ US | #12 |
| 1984 | 36 959 043 618 $ US | #12 |
| 1983 | 34 880 514 536 $ US | #12 |
| 1982 | 34 607 827 969 $ US | #12 |
| 1981 | 36 270 607 694 $ US | #12 |
| 1980 | 38 777 578 731 $ US | #12 |
| 1979 | 34 345 349 770 $ US | #12 |
| 1978 | 26 992 994 135 $ US | #12 |
| 1977 | 23 692 379 061 $ US | #13 |
| 1976 | 22 620 156 569 $ US | #13 |
| 1975 | 21 363 794 615 $ US | #12 |
| 1974 | 19 469 658 738 $ US | #13 |
| 1973 | 14 907 783 528 $ US | #11 |
| 1972 | 10 843 484 588 $ US | #11 |
| 1971 | 9 260 327 747 $ US | #11 |
| 1970 | 8 403 319 222 $ US | #11 |
| 1969 | 7 088 694 250 $ US | - |
| 1968 | 6 160 444 504 $ US | - |
| 1967 | 5 682 819 986 $ US | - |
| 1966 | 5 313 573 629 $ US | - |
| 1965 | 4 982 734 952 $ US | - |
| 1964 | 4 623 375 686 $ US | - |
| 1963 | 4 076 731 162 $ US | - |
| 1962 | 3 759 772 648 $ US | - |
| 1961 | 3 536 171 254 $ US | - |
| 1960 | 3 347 365 082 $ US | - |
En 2025, les exportations de biens et services de la Suède s'élevaient à 356 milliards de dollars, contre 3,35 milliards de dollars en 1960. Elles se classaient au 28e rang mondial, un rang qu'elles occupent depuis 2023. Leur meilleur rang a été le 11e, occupé pour la dernière fois en 1986.
En 2025, les exportations de biens et services de la Suède étaient les 12es plus élevées de 41 pays situés en Europe. Les importations de biens et services de la Suède s'élevaient à 342 milliards de dollars en 2025, au 28e rang mondial. En 2025, les exportations de la Suède dépassaient ses importations de 14,2 milliards de dollars, soit un excédent commercial.
Exportations de biens de la Suède par catégorie, 2025
Exportations de biens, 2025: 208 Md $US
En 2025, la première catégorie des exportations de biens de la Suède était « machines, électronique et véhicules », avec 39,8 %, suivie de « produits chimiques, pharmaceutiques et plastiques », avec 14,8 %.
Destinations des exportations de biens de la Suède : les 10 premières, 2025
| Rang | Pays | Exportations de biens | Part | |
|---|---|---|---|---|
| 1 |
 Allemagne |
20,5 Md $US | 9,85 % | vs Allemagne |
| 2 |
 Norvège |
20,5 Md $US | 9,83 % | vs Norvège |
| 3 |
 États-Unis |
16,6 Md $US | 7,97 % | vs USA |
| 4 |
 Danemark |
14,6 Md $US | 6,99 % | vs Danemark |
| 5 |
 Finlande |
13,5 Md $US | 6,49 % | vs Finlande |
| 6 |
 Royaume-Uni |
10,8 Md $US | 5,2 % | |
| 7 |
 Pays-Bas |
10,1 Md $US | 4,84 % | vs Pays-Bas |
| 8 |
 Belgique |
9,82 Md $US | 4,71 % | vs Belgique |
| 9 |
 Pologne |
8,51 Md $US | 4,08 % | vs Pologne |
| 10 |
 France |
8,36 Md $US | 4,01 % | vs France |
| Autres partenaires et non précisés | 75,1 Md $US | 36 % |
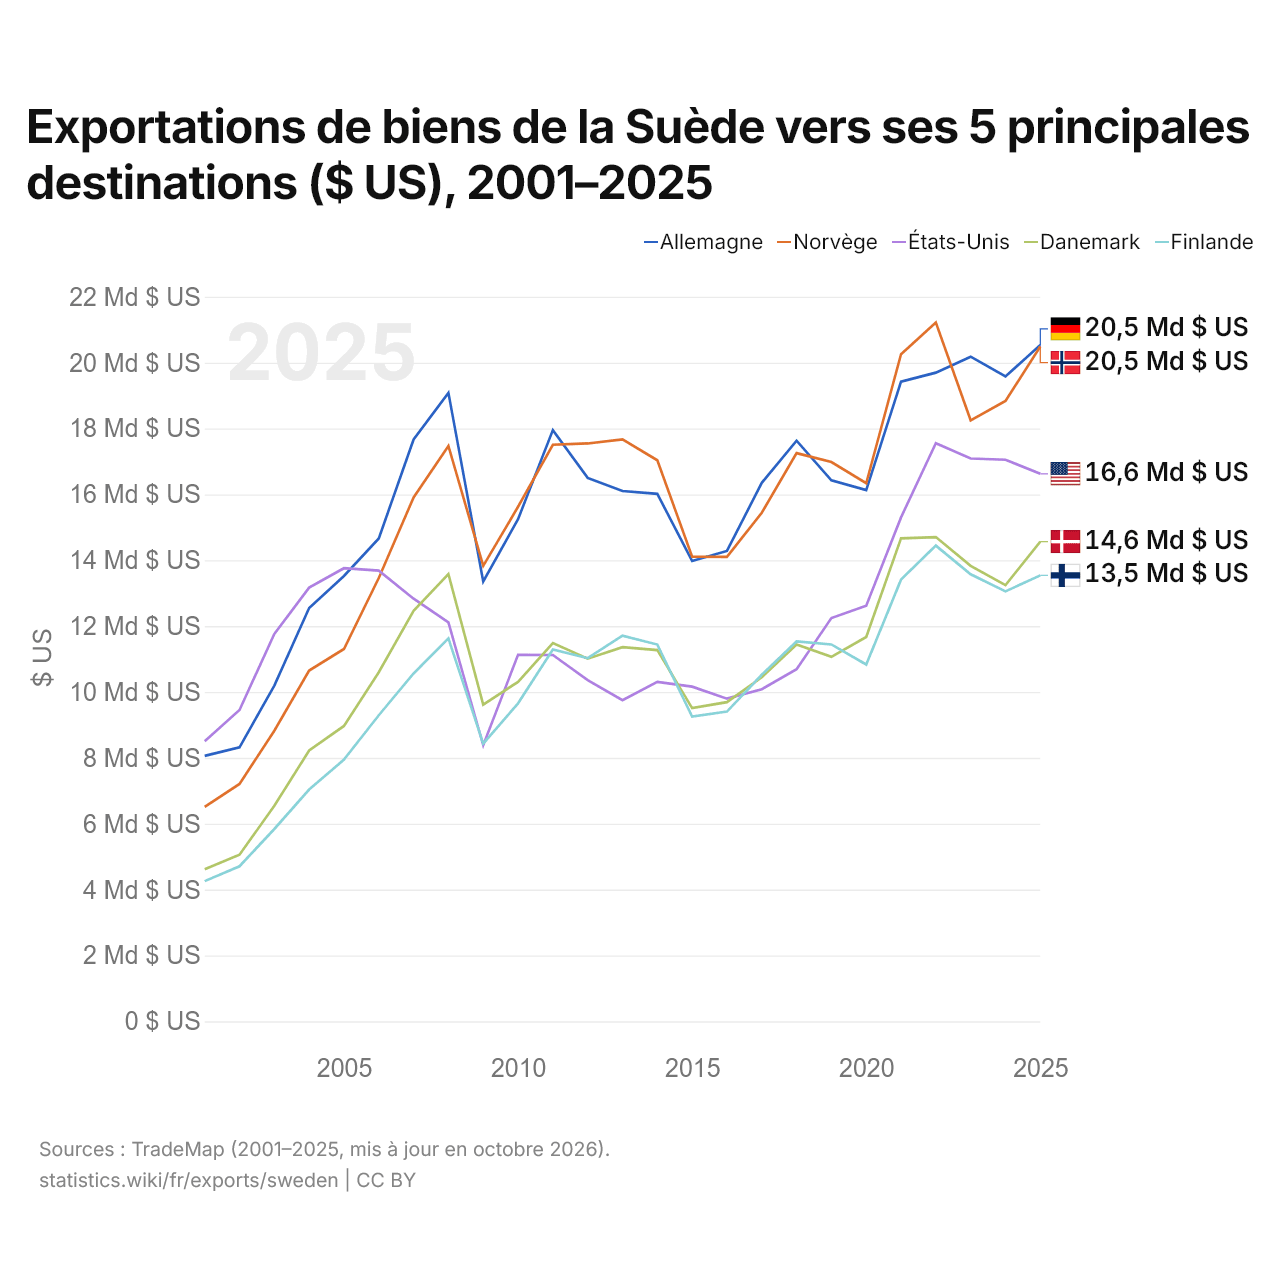
Exportations de biens de la Suède vers ses 5 principales destinations ($ US), 2001–2025
| Année | $ US | ||||
|---|---|---|---|---|---|
| Allemagne | Norvège | États-Unis | Danemark | Finlande | |
| 2025 | 20 538 452 000 $ US | 20 486 827 000 $ US | 16 624 481 000 $ US | 14 565 740 000 $ US | 13 540 177 000 $ US |
| 2024 | 19 580 172 000 $ US | 18 834 647 000 $ US | 17 052 176 000 $ US | 13 243 381 000 $ US | 13 054 191 000 $ US |
| 2023 | 20 181 366 000 $ US | 18 249 030 000 $ US | 17 089 983 000 $ US | 13 829 567 000 $ US | 13 575 226 000 $ US |
| 2022 | 19 696 101 000 $ US | 21 215 828 000 $ US | 17 555 070 000 $ US | 14 703 651 000 $ US | 14 444 051 000 $ US |
| 2021 | 19 422 649 000 $ US | 20 254 230 000 $ US | 15 301 714 000 $ US | 14 664 109 000 $ US | 13 411 323 000 $ US |
| 2020 | 16 128 219 000 $ US | 16 337 098 000 $ US | 12 621 523 000 $ US | 11 668 764 000 $ US | 10 833 990 000 $ US |
| 2019 | 16 426 166 000 $ US | 16 982 088 000 $ US | 12 244 073 000 $ US | 11 066 878 000 $ US | 11 443 676 000 $ US |
| 2018 | 17 631 585 000 $ US | 17 251 720 000 $ US | 10 692 900 000 $ US | 11 441 963 000 $ US | 11 534 158 000 $ US |
| 2017 | 16 349 159 000 $ US | 15 441 320 000 $ US | 10 082 724 000 $ US | 10 445 666 000 $ US | 10 525 043 000 $ US |
| 2016 | 14 282 182 000 $ US | 14 102 309 000 $ US | 9 797 671 000 $ US | 9 690 410 000 $ US | 9 404 345 000 $ US |
| 2015 | 13 978 875 000 $ US | 14 107 673 000 $ US | 10 161 580 000 $ US | 9 510 975 000 $ US | 9 253 672 000 $ US |
| 2014 | 16 015 508 000 $ US | 17 036 348 000 $ US | 10 306 942 000 $ US | 11 271 354 000 $ US | 11 440 161 000 $ US |
| 2013 | 16 102 611 000 $ US | 17 670 764 000 $ US | 9 749 160 000 $ US | 11 359 372 000 $ US | 11 710 255 000 $ US |
| 2012 | 16 500 155 000 $ US | 17 546 126 000 $ US | 10 362 257 000 $ US | 11 010 540 000 $ US | 11 026 586 000 $ US |
| 2011 | 17 952 267 000 $ US | 17 507 768 000 $ US | 11 122 841 000 $ US | 11 487 326 000 $ US | 11 288 256 000 $ US |
| 2010 | 15 246 295 000 $ US | 15 623 284 000 $ US | 11 128 501 000 $ US | 10 306 144 000 $ US | 9 654 932 000 $ US |
| 2009 | 13 357 552 000 $ US | 13 828 390 000 $ US | 8 382 141 000 $ US | 9 618 224 000 $ US | 8 430 931 000 $ US |
| 2008 | 19 083 565 000 $ US | 17 471 448 000 $ US | 12 111 317 000 $ US | 13 580 078 000 $ US | 11 629 407 000 $ US |
| 2007 | 17 666 346 000 $ US | 15 907 048 000 $ US | 12 832 056 000 $ US | 12 466 498 000 $ US | 10 561 414 000 $ US |
| 2006 | 14 661 966 000 $ US | 13 460 130 000 $ US | 13 683 751 000 $ US | 10 598 537 000 $ US | 9 294 005 000 $ US |
| 2005 | 13 520 752 000 $ US | 11 305 416 000 $ US | 13 757 965 000 $ US | 8 969 329 000 $ US | 7 945 522 000 $ US |
| 2004 | 12 549 477 000 $ US | 10 651 367 000 $ US | 13 169 164 000 $ US | 8 223 108 000 $ US | 7 038 150 000 $ US |
| 2003 | 10 194 615 000 $ US | 8 824 741 000 $ US | 11 764 457 000 $ US | 6 543 404 000 $ US | 5 840 974 000 $ US |
| 2002 | 8 316 936 000 $ US | 7 209 256 000 $ US | 9 453 931 000 $ US | 5 058 870 000 $ US | 4 707 319 000 $ US |
| 2001 | 8 060 570 000 $ US | 6 510 345 000 $ US | 8 500 648 000 $ US | 4 618 278 000 $ US | 4 257 478 000 $ US |
En 2025, les exportations de biens s'élevaient à 20,5 milliards de dollars vers l'Allemagne, 20,5 milliards de dollars vers la Norvège, 16,6 milliards de dollars vers les États-Unis, 14,6 milliards de dollars vers le Danemark et 13,5 milliards de dollars vers la Finlande. Le premier rang des cinq destinations de la Suède est occupé par l'Allemagne depuis 2023.
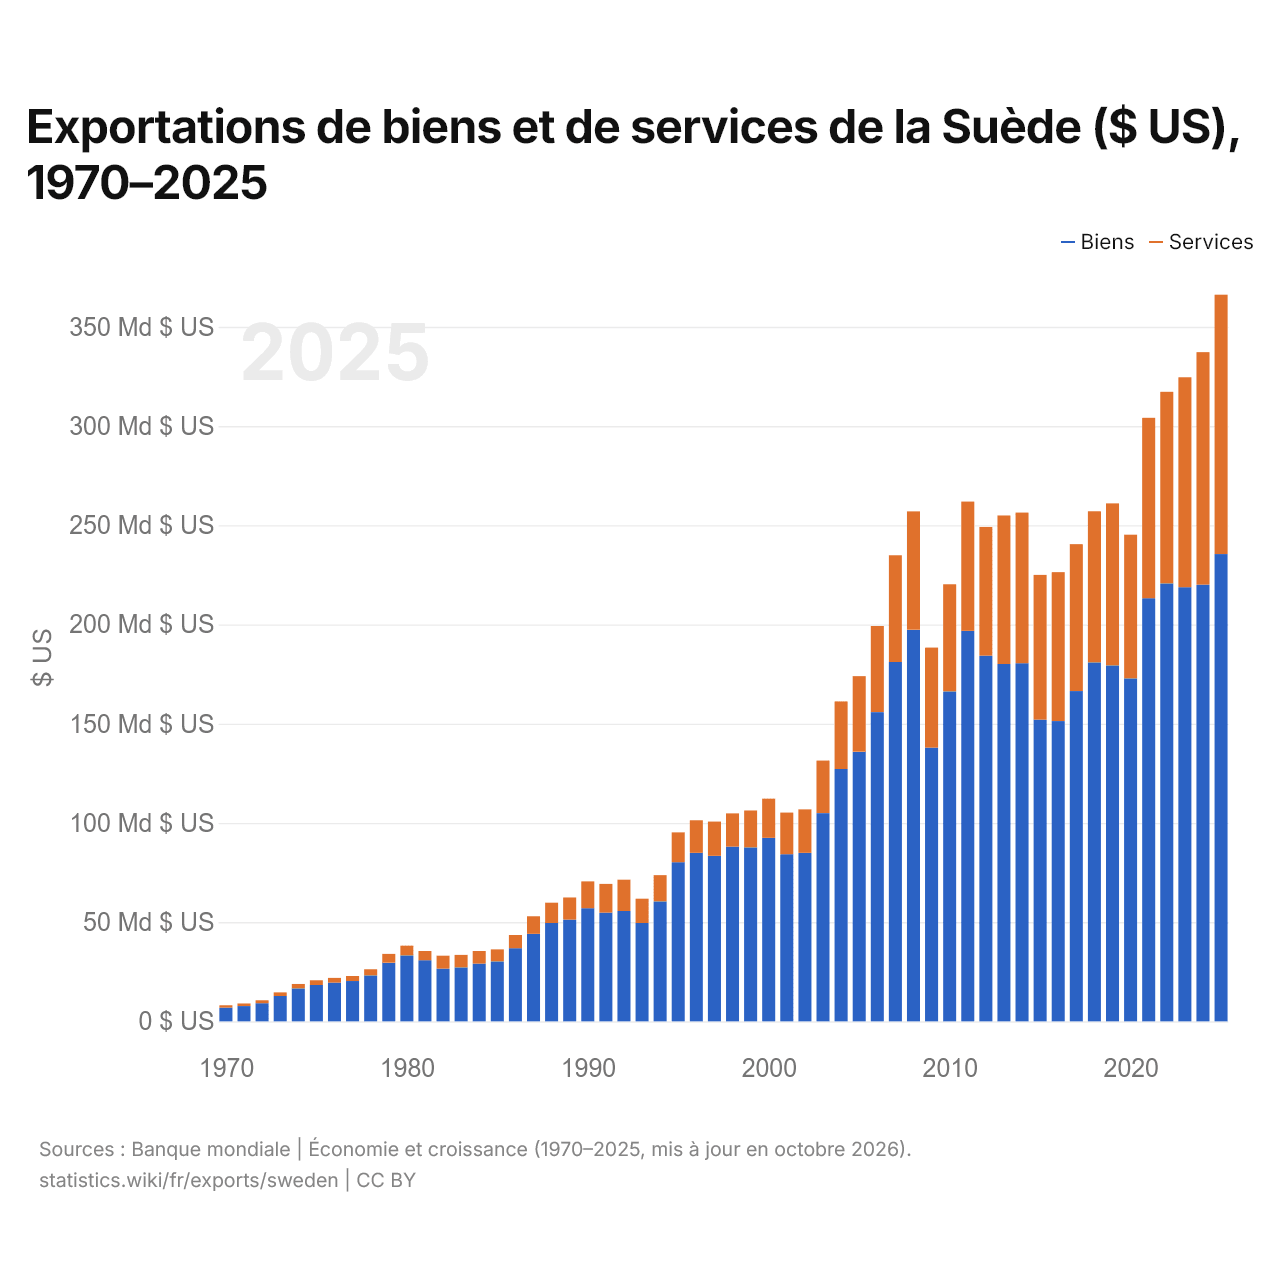
Exportations de biens et de services de la Suède ($ US), 1970–2025
| Année | $ US | |
|---|---|---|
| Biens | Services | |
| 2025 | 235 482 700 446 $ US | 130 728 731 918 $ US |
| 2024 | 220 032 592 218 $ US | 117 190 312 334 $ US |
| 2023 | 218 805 832 433 $ US | 105 797 047 615 $ US |
| 2022 | 220 716 212 599 $ US | 96 530 026 084 $ US |
| 2021 | 213 193 542 717 $ US | 90 940 629 791 $ US |
| 2020 | 172 777 152 833 $ US | 72 458 123 883 $ US |
| 2019 | 179 360 888 453 $ US | 81 675 957 430 $ US |
| 2018 | 180 871 244 851 $ US | 76 159 800 470 $ US |
| 2017 | 166 450 970 691 $ US | 74 013 417 067 $ US |
| 2016 | 151 317 226 606 $ US | 75 048 990 004 $ US |
| 2015 | 152 033 620 304 $ US | 72 957 554 007 $ US |
| 2014 | 180 493 944 558 $ US | 75 888 253 379 $ US |
| 2013 | 180 075 739 258 $ US | 74 863 448 366 $ US |
| 2012 | 184 265 550 199 $ US | 64 911 302 489 $ US |
| 2011 | 196 756 415 540 $ US | 65 185 244 764 $ US |
| 2010 | 166 225 378 894 $ US | 54 051 178 672 $ US |
| 2009 | 137 966 200 599 $ US | 50 375 602 117 $ US |
| 2008 | 197 330 660 427 $ US | 59 684 860 668 $ US |
| 2007 | 181 101 772 272 $ US | 53 777 951 808 $ US |
| 2006 | 155 838 490 570 $ US | 43 403 125 758 $ US |
| 2005 | 135 861 187 561 $ US | 38 113 559 603 $ US |
| 2004 | 127 162 333 903 $ US | 34 062 735 477 $ US |
| 2003 | 104 935 699 527 $ US | 26 502 640 688 $ US |
| 2002 | 84 897 425 344 $ US | 21 926 492 754 $ US |
| 2001 | 84 198 841 253 $ US | 21 003 750 868 $ US |
| 2000 | 92 441 279 022 $ US | 19 786 458 527 $ US |
| 1999 | 87 623 542 500 $ US | 18 629 317 998 $ US |
| 1998 | 88 073 833 673 $ US | 16 730 229 216 $ US |
| 1997 | 83 398 079 668 $ US | 17 286 219 453 $ US |
| 1996 | 84 942 949 248 $ US | 16 401 002 552 $ US |
| 1995 | 80 203 401 434 $ US | 15 051 446 452 $ US |
| 1994 | 60 456 913 143 $ US | 13 200 676 510 $ US |
| 1993 | 49 558 393 055 $ US | 12 226 599 496 $ US |
| 1992 | 55 632 443 821 $ US | 15 750 761 040 $ US |
| 1991 | 54 747 422 635 $ US | 14 519 852 951 $ US |
| 1990 | 57 020 002 086 $ US | 13 510 172 667 $ US |
| 1989 | 51 306 544 774 $ US | 11 119 018 627 $ US |
| 1988 | 49 551 200 516 $ US | 10 235 701 329 $ US |
| 1987 | 44 101 260 182 $ US | 8 830 274 242 $ US |
| 1986 | 36 845 461 737 $ US | 6 663 954 605 $ US |
| 1985 | 30 172 874 075 $ US | 6 120 779 793 $ US |
| 1984 | 29 122 824 384 $ US | 6 293 083 977 $ US |
| 1983 | 27 203 808 028 $ US | 6 291 598 365 $ US |
| 1982 | 26 575 301 678 $ US | 6 521 304 432 $ US |
| 1981 | 30 770 137 926 $ US | 4 653 958 891 $ US |
| 1980 | 33 215 407 017 $ US | 4 935 254 820 $ US |
| 1979 | 29 525 250 211 $ US | 4 470 982 578 $ US |
| 1978 | 23 174 455 423 $ US | 3 077 613 142 $ US |
| 1977 | 20 315 963 817 $ US | 2 522 652 621 $ US |
| 1976 | 19 508 716 823 $ US | 2 402 564 241 $ US |
| 1975 | 18 321 015 148 $ US | 2 369 383 032 $ US |
| 1974 | 16 608 006 671 $ US | 2 230 018 528 $ US |
| 1973 | 12 760 890 724 $ US | 1 818 077 738 $ US |
| 1972 | 9 159 215 386 $ US | 1 455 143 572 $ US |
| 1971 | 7 694 250 692 $ US | 1 322 693 197 $ US |
| 1970 | 6 904 803 782 $ US | 1 198 482 179 $ US |
En 2025, les exportations de biens de la Suède s'élevaient à 235 milliards de dollars et celles de services à 131 milliards de dollars ; les services représentaient 35,7 % du total, contre 14,8 % en 1970.
La Suède dans le classement mondial des exportations, 2025
| Rang | Pays | Exportations | Part mondiale | |
|---|---|---|---|---|
| 25 |
 Brésil |
406 Md $US | 1,16 % | |
| 26 |
 Turquie |
397 Md $US | 1,14 % | |
| 27 |
 Arabie saoudite |
380 Md $US | 1,09 % | |
| 28 |
 Suède |
356 Md $US | 1,02 % | |
| 29 |
 Malaisie |
335 Md $US | 0,96 % | |
| 30 |
 Indonésie |
330 Md $US | 0,95 % | |
| 31 |
Danemark
|
324 Md $US | 0,93 % | vs Danemark |
Exportations de biens et services de la Suède, % du PIB, 1960–2025
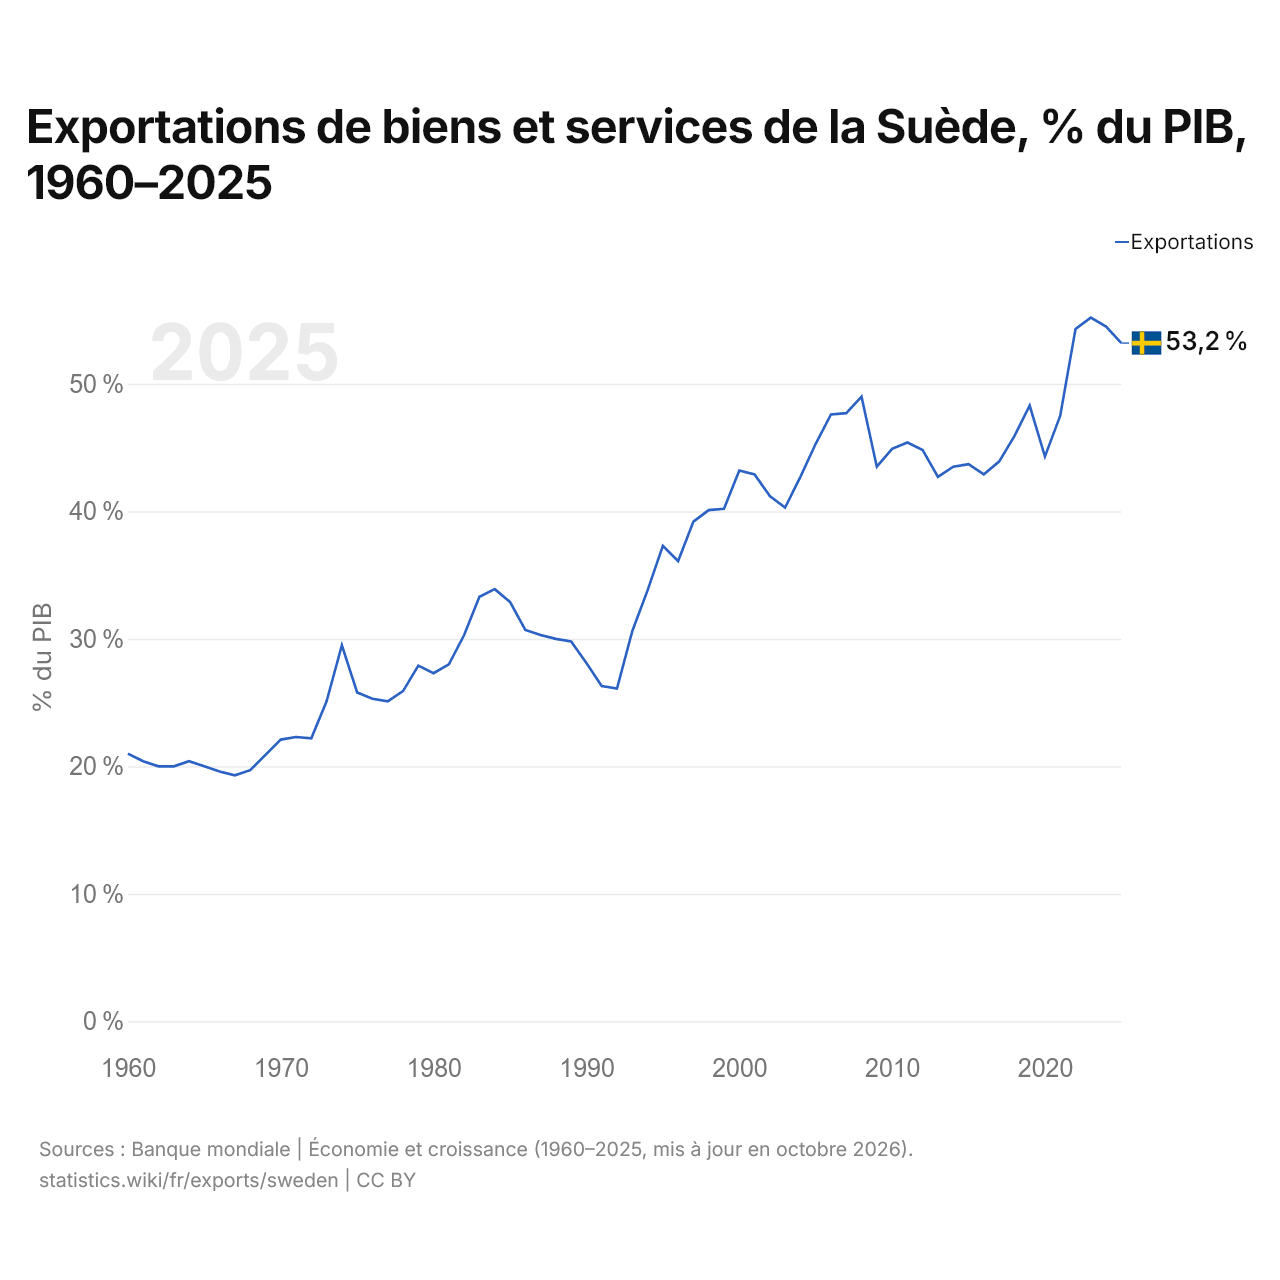
En 2025, les exportations de biens et services de la Suède équivalaient à 53,2 % de son PIB, contre 21,0 % en 1960. La part la plus élevée a été de 55,2 %, en 2023.
Comparer les exportations de la Suède avec celles d'autres pays
Sources :
- TradeMap (2001–2025, mis à jour en octobre 2026)
- Banque mondiale | Économie et croissance (1960–2025, mis à jour en octobre 2026)
Creative Commons Attribution (CC BY) : vous pouvez copier, partager, adapter et réutiliser ce contenu, y compris à des fins commerciales, à condition de citer statistics.wiki et d’indiquer les modifications apportées. Les sources citées ci-dessus peuvent avoir leurs propres conditions de licence.