
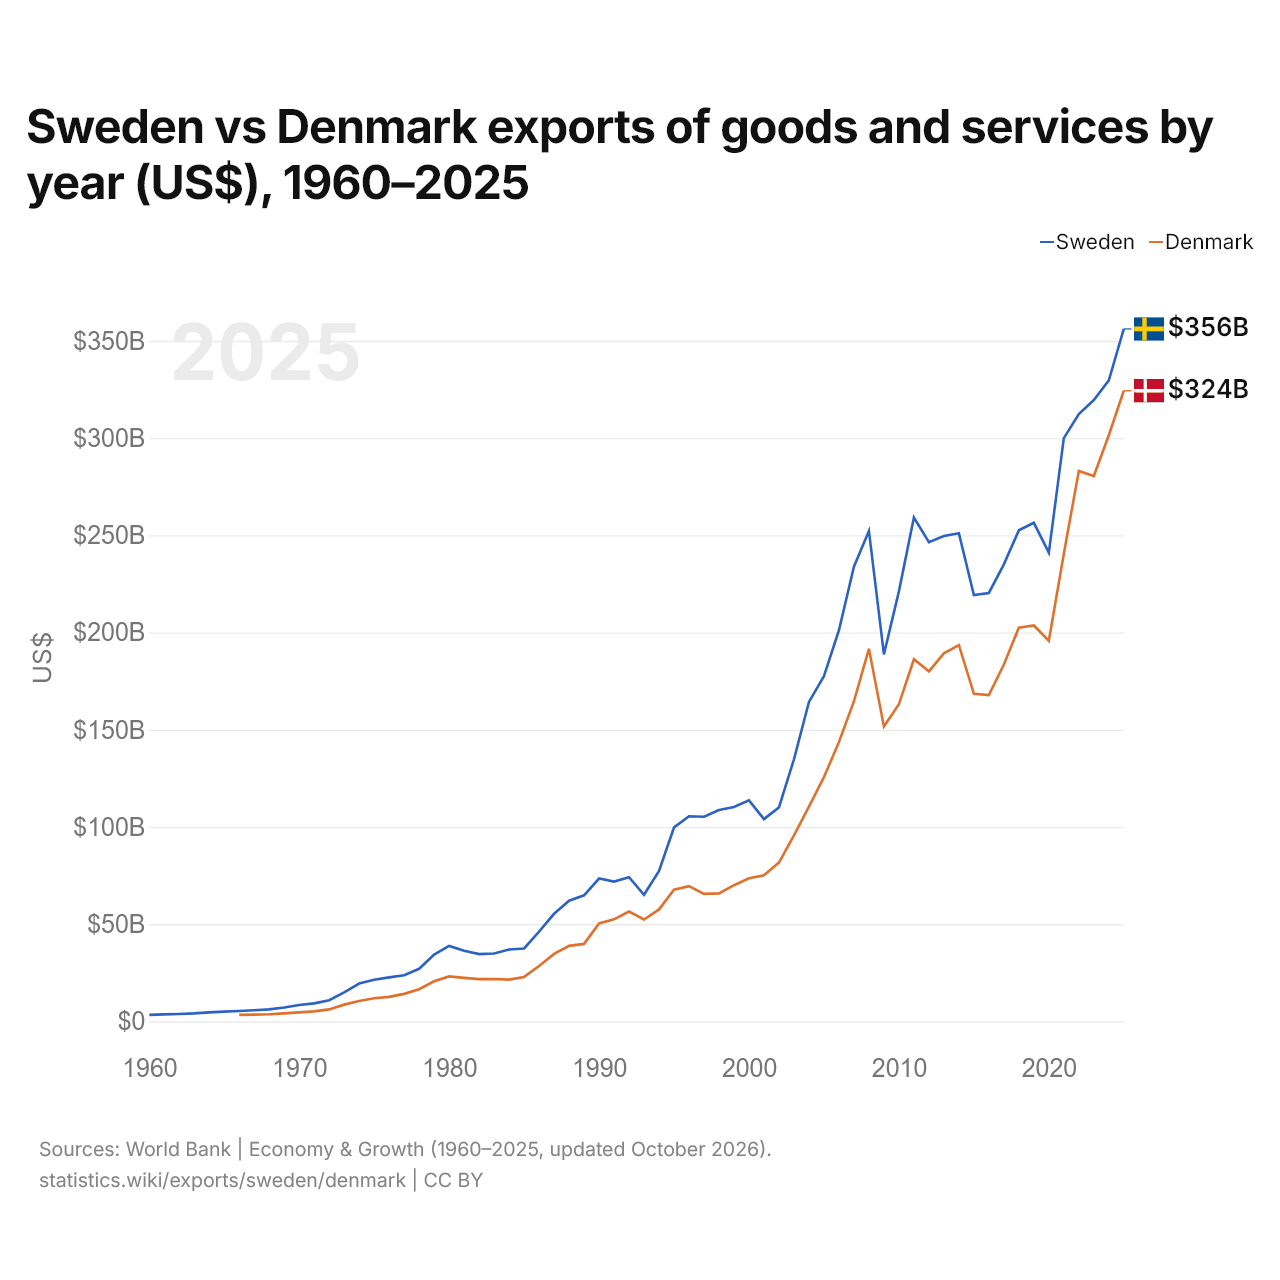
Suède vs Danemark : exportations de biens et services par année ($ US), 1960–2025
| Année | $ US | |
|---|---|---|
 Suède |
 Danemark |
|
| 2025 | 356 098 645 397 $ US | 324 310 154 070 $ US |
| 2024 | 329 613 629 462 $ US | 301 421 099 196 $ US |
| 2023 | 319 579 119 038 $ US | 280 481 748 657 $ US |
| 2022 | 312 333 054 945 $ US | 283 101 737 205 $ US |
| 2021 | 299 954 758 724 $ US | 240 447 056 409 $ US |
| 2020 | 241 040 989 303 $ US | 195 728 280 394 $ US |
| 2019 | 256 361 650 143 $ US | 203 616 268 094 $ US |
| 2018 | 252 513 588 793 $ US | 202 458 132 659 $ US |
| 2017 | 235 035 642 663 $ US | 183 533 038 707 $ US |
| 2016 | 220 294 654 962 $ US | 167 778 866 084 $ US |
| 2015 | 219 257 723 595 $ US | 168 424 695 290 $ US |
| 2014 | 251 073 164 368 $ US | 193 470 125 257 $ US |
| 2013 | 249 633 416 172 $ US | 189 274 488 027 $ US |
| 2012 | 246 467 911 084 $ US | 180 000 103 467 $ US |
| 2011 | 259 105 070 011 $ US | 186 218 363 096 $ US |
| 2010 | 221 131 967 531 $ US | 163 077 152 065 $ US |
| 2009 | 188 748 072 853 $ US | 151 627 484 191 $ US |
| 2008 | 252 233 466 341 $ US | 191 585 682 313 $ US |
| 2007 | 233 870 509 558 $ US | 164 581 516 799 $ US |
| 2006 | 201 116 532 488 $ US | 143 632 474 608 $ US |
| 2005 | 177 558 710 575 $ US | 125 615 175 507 $ US |
| 2004 | 164 273 700 826 $ US | 110 424 226 102 $ US |
| 2003 | 134 751 740 598 $ US | 95 609 830 442 $ US |
| 2002 | 110 054 739 091 $ US | 81 644 271 220 $ US |
| 2001 | 104 030 360 825 $ US | 75 069 907 723 $ US |
| 2000 | 113 693 763 507 $ US | 73 620 705 670 $ US |
| 1999 | 110 212 408 017 $ US | 70 026 519 452 $ US |
| 1998 | 108 707 782 488 $ US | 65 817 213 169 $ US |
| 1997 | 105 238 706 466 $ US | 65 532 780 680 $ US |
| 1996 | 105 471 368 923 $ US | 69 550 401 642 $ US |
| 1995 | 99 716 260 356 $ US | 67 734 639 976 $ US |
| 1994 | 77 327 890 098 $ US | 57 548 745 244 $ US |
| 1993 | 65 075 545 391 $ US | 52 361 218 248 $ US |
| 1992 | 74 162 970 569 $ US | 56 509 036 961 $ US |
| 1991 | 71 908 405 788 $ US | 52 463 311 186 $ US |
| 1990 | 73 469 841 353 $ US | 50 354 023 850 $ US |
| 1989 | 64 788 686 811 $ US | 39 815 296 435 $ US |
| 1988 | 62 002 451 691 $ US | 38 843 912 798 $ US |
| 1987 | 55 328 058 324 $ US | 34 688 518 632 $ US |
| 1986 | 46 083 452 608 $ US | 28 448 676 060 $ US |
| 1985 | 37 450 573 228 $ US | 22 827 227 077 $ US |
| 1984 | 36 959 043 618 $ US | 21 450 892 185 $ US |
| 1983 | 34 880 514 536 $ US | 21 784 408 092 $ US |
| 1982 | 34 607 827 969 $ US | 21 672 296 937 $ US |
| 1981 | 36 270 607 694 $ US | 22 322 851 588 $ US |
| 1980 | 38 777 578 731 $ US | 23 118 475 665 $ US |
| 1979 | 34 345 349 770 $ US | 20 570 160 616 $ US |
| 1978 | 26 992 994 135 $ US | 16 550 378 631 $ US |
| 1977 | 23 692 379 061 $ US | 14 117 650 586 $ US |
| 1976 | 22 620 156 569 $ US | 12 587 275 103 $ US |
| 1975 | 21 363 794 615 $ US | 11 887 428 561 $ US |
| 1974 | 19 469 658 738 $ US | 10 472 333 426 $ US |
| 1973 | 14 907 783 528 $ US | 8 596 329 118 $ US |
| 1972 | 10 843 484 588 $ US | 6 134 824 083 $ US |
| 1971 | 9 260 327 747 $ US | 5 119 658 107 $ US |
| 1970 | 8 403 319 222 $ US | 4 636 162 800 $ US |
| 1969 | 7 088 694 250 $ US | 4 118 477 067 $ US |
| 1968 | 6 160 444 504 $ US | 3 642 678 800 $ US |
| 1967 | 5 682 819 986 $ US | 3 491 604 729 $ US |
| 1966 | 5 313 573 629 $ US | 3 345 823 849 $ US |
| 1965 | 4 982 734 952 $ US | - |
| 1964 | 4 623 375 686 $ US | - |
| 1963 | 4 076 731 162 $ US | - |
| 1962 | 3 759 772 648 $ US | - |
| 1961 | 3 536 171 254 $ US | - |
| 1960 | 3 347 365 082 $ US | - |
En 2025, les exportations de biens et services de la Suède s'élevaient à 356 milliards de dollars et celles du Danemark à 324 milliards de dollars : celles de la Suède étaient supérieures de 9,8 %. En 1966, les exportations de la Suède étaient 1,6 fois plus élevées : 5,31 milliards de dollars pour la Suède et 3,35 milliards de dollars pour le Danemark.
Les exportations de biens et services de la Suède sont supérieures à celles du Danemark chaque année depuis 1966.
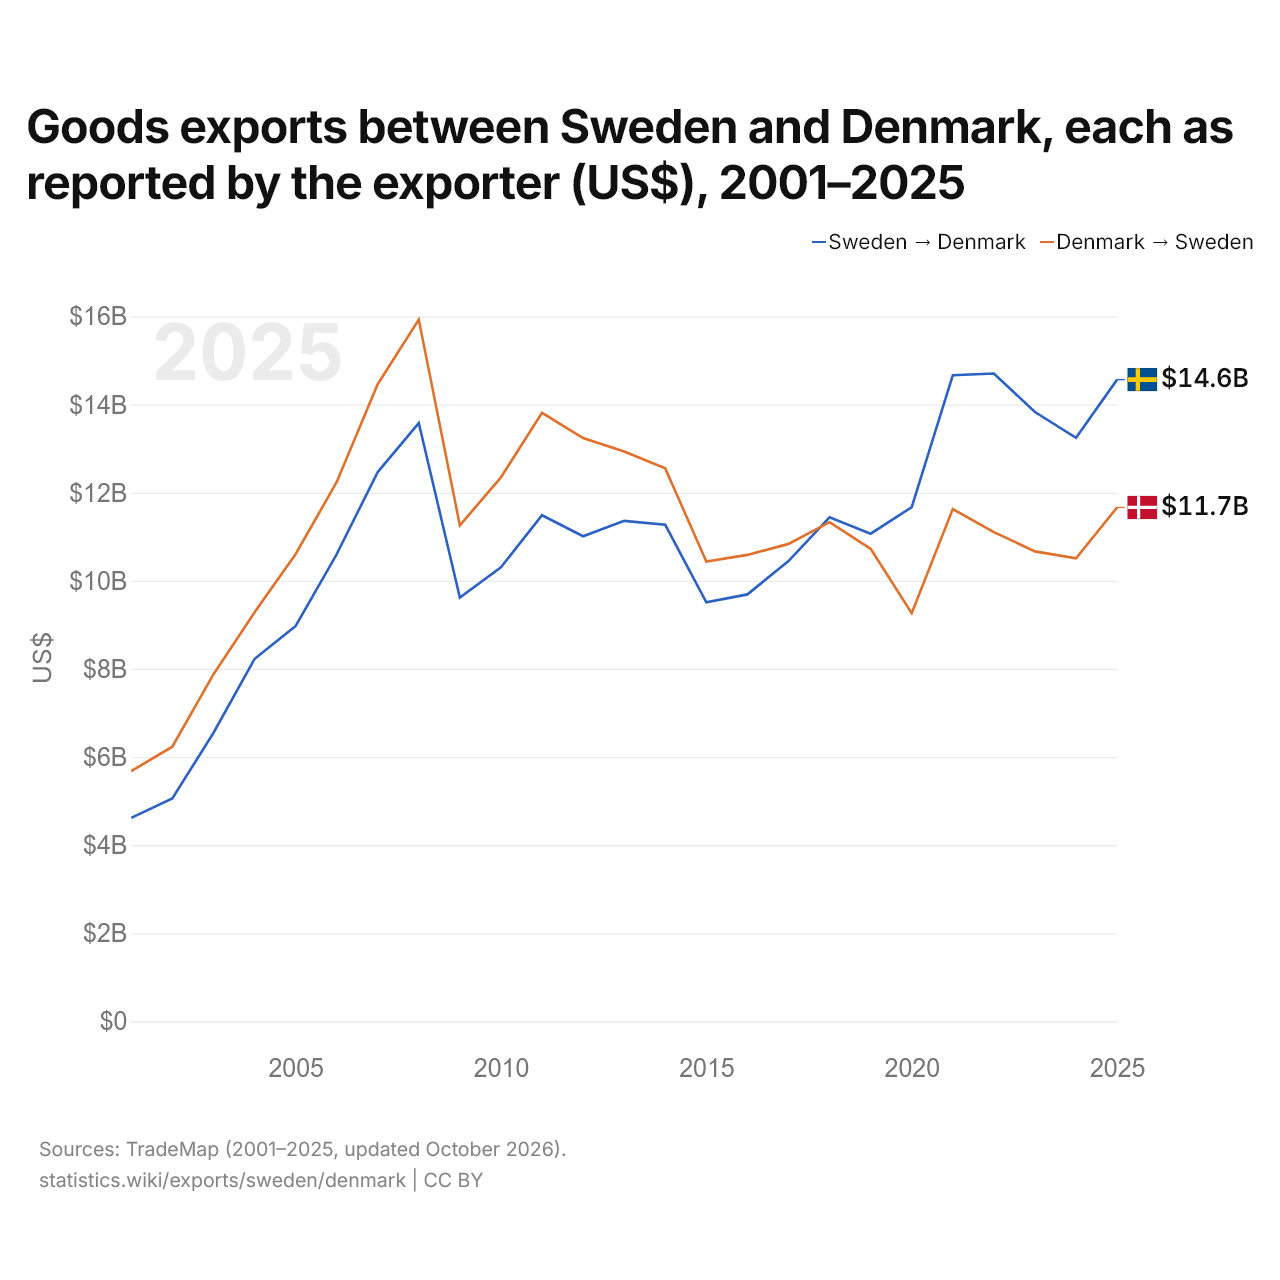
Exportations de biens entre la Suède et le Danemark, selon chaque exportateur ($ US), 2001–2025
| Année | $ US | |
|---|---|---|
| Suède → Danemark | Danemark → Suède | |
| 2025 | 14 565 740 000 $ US | 11 663 844 000 $ US |
| 2024 | 13 243 381 000 $ US | 10 506 980 000 $ US |
| 2023 | 13 829 567 000 $ US | 10 667 125 000 $ US |
| 2022 | 14 703 651 000 $ US | 11 104 321 000 $ US |
| 2021 | 14 664 109 000 $ US | 11 626 785 000 $ US |
| 2020 | 11 668 764 000 $ US | 9 261 661 000 $ US |
| 2019 | 11 066 878 000 $ US | 10 724 934 000 $ US |
| 2018 | 11 441 963 000 $ US | 11 329 485 000 $ US |
| 2017 | 10 445 666 000 $ US | 10 836 039 000 $ US |
| 2016 | 9 690 410 000 $ US | 10 585 878 000 $ US |
| 2015 | 9 510 975 000 $ US | 10 436 204 000 $ US |
| 2014 | 11 271 354 000 $ US | 12 551 081 000 $ US |
| 2013 | 11 359 372 000 $ US | 12 935 337 000 $ US |
| 2012 | 11 010 540 000 $ US | 13 238 229 000 $ US |
| 2011 | 11 487 326 000 $ US | 13 813 454 000 $ US |
| 2010 | 10 306 144 000 $ US | 12 347 367 000 $ US |
| 2009 | 9 618 224 000 $ US | 11 255 092 000 $ US |
| 2008 | 13 580 078 000 $ US | 15 927 736 000 $ US |
| 2007 | 12 466 498 000 $ US | 14 460 985 000 $ US |
| 2006 | 10 598 537 000 $ US | 12 236 435 000 $ US |
| 2005 | 8 969 329 000 $ US | 10 602 982 000 $ US |
| 2004 | 8 223 108 000 $ US | 9 280 374 000 $ US |
| 2003 | 6 543 404 000 $ US | 7 875 014 000 $ US |
| 2002 | 5 058 870 000 $ US | 6 232 996 000 $ US |
| 2001 | 4 618 278 000 $ US | 5 679 507 000 $ US |
En 2025, les exportations de biens de la Suède vers le Danemark, selon la Suède, s'élevaient à 14,6 milliards de dollars, et celles du Danemark vers la Suède, selon le Danemark, à 11,7 milliards de dollars : 25 % de plus pour celles de la Suède. En 2001, elles s'élevaient à 4,62 milliards de dollars pour la Suède et à 5,68 milliards de dollars pour le Danemark.
Suède vs Danemark : chiffres des exportations
|
Suède
|
Danemark
|
|
|---|---|---|
| Exportations | 356 Md $US (2025) | 324 Md $US (2025) |
| Rang mondial | 28/176 | 31/176 |
| Part mondiale | 1,02 % | 0,93 % |
| % du PIB | 53,2 % | 70,1 % |
| Première catégorie de biens | Machines, électronique et véhicules (39,8 %, 2025) | Machines, électronique et véhicules (28,5 %, 2025) |
| Première destination des biens | Allemagne (9,85 %, 2025) | Allemagne (12,9 %, 2025) |
Comparer les exportations de 2 pays au choix
Sources :
- Banque mondiale | Économie et croissance (1960–2025, mis à jour en octobre 2026)
- TradeMap (2001–2025, mis à jour en octobre 2026)
Creative Commons Attribution (CC BY) : vous pouvez copier, partager, adapter et réutiliser ce contenu, y compris à des fins commerciales, à condition de citer statistics.wiki et d’indiquer les modifications apportées. Les sources citées ci-dessus peuvent avoir leurs propres conditions de licence.