
Exportations de biens et services du Portugal par année ($ US), 1970–2025
| Année | $ US | Rang mondial |
|---|---|---|
| Exportations | Rang mondial | |
| 2025 | 151 336 322 847 $ US | #39 |
| 2024 | 143 716 598 546 $ US | #38 |
| 2023 | 137 846 682 522 $ US | #38 |
| 2022 | 127 117 787 017 $ US | #43 |
| 2021 | 106 387 190 475 $ US | #42 |
| 2020 | 85 546 804 978 $ US | #43 |
| 2019 | 104 818 126 822 $ US | #41 |
| 2018 | 105 740 319 070 $ US | #41 |
| 2017 | 94 844 484 378 $ US | #42 |
| 2016 | 83 254 740 237 $ US | #43 |
| 2015 | 80 984 130 312 $ US | #42 |
| 2014 | 92 457 300 369 $ US | #44 |
| 2013 | 89 682 537 232 $ US | #46 |
| 2012 | 81 685 225 652 $ US | #50 |
| 2011 | 84 455 064 293 $ US | #46 |
| 2010 | 71 598 934 533 $ US | #45 |
| 2009 | 66 778 989 702 $ US | #40 |
| 2008 | 82 346 807 429 $ US | #40 |
| 2007 | 75 020 812 081 $ US | #40 |
| 2006 | 63 373 039 604 $ US | #41 |
| 2005 | 53 424 570 458 $ US | #40 |
| 2004 | 52 396 449 477 $ US | #37 |
| 2003 | 45 217 764 525 $ US | #37 |
| 2002 | 36 493 691 735 $ US | #38 |
| 2001 | 33 364 915 450 $ US | #37 |
| 2000 | 33 452 144 656 $ US | #37 |
| 1999 | 33 756 675 285 $ US | #34 |
| 1998 | 33 876 548 308 $ US | #34 |
| 1997 | 31 774 839 337 $ US | #35 |
| 1996 | 32 556 406 291 $ US | #34 |
| 1995 | 31 620 944 673 $ US | #34 |
| 1994 | 25 055 310 386 $ US | #33 |
| 1993 | 22 422 442 339 $ US | #33 |
| 1992 | 26 315 596 971 $ US | #31 |
| 1991 | 23 689 342 306 $ US | #31 |
| 1990 | 22 960 185 628 $ US | #31 |
| 1989 | 17 854 164 757 $ US | #33 |
| 1988 | 15 572 504 178 $ US | #32 |
| 1987 | 13 172 520 279 $ US | #33 |
| 1986 | 10 071 952 821 $ US | #34 |
| 1985 | 7 929 289 328 $ US | #39 |
| 1984 | 7 358 490 824 $ US | #41 |
| 1983 | 6 687 714 441 $ US | #43 |
| 1982 | 6 314 253 280 $ US | #44 |
| 1981 | 6 501 188 925 $ US | #43 |
| 1980 | 7 058 033 640 $ US | #39 |
| 1979 | 5 643 155 738 $ US | #40 |
| 1978 | 3 702 002 737 $ US | #43 |
| 1977 | 3 094 730 225 $ US | #44 |
| 1976 | 2 777 320 955 $ US | #42 |
| 1975 | 3 092 305 882 $ US | #38 |
| 1974 | 3 686 495 659 $ US | #37 |
| 1973 | 3 160 024 530 $ US | #34 |
| 1972 | 2 398 176 427 $ US | #31 |
| 1971 | 1 808 141 343 $ US | #31 |
| 1970 | 1 549 504 881 $ US | #32 |
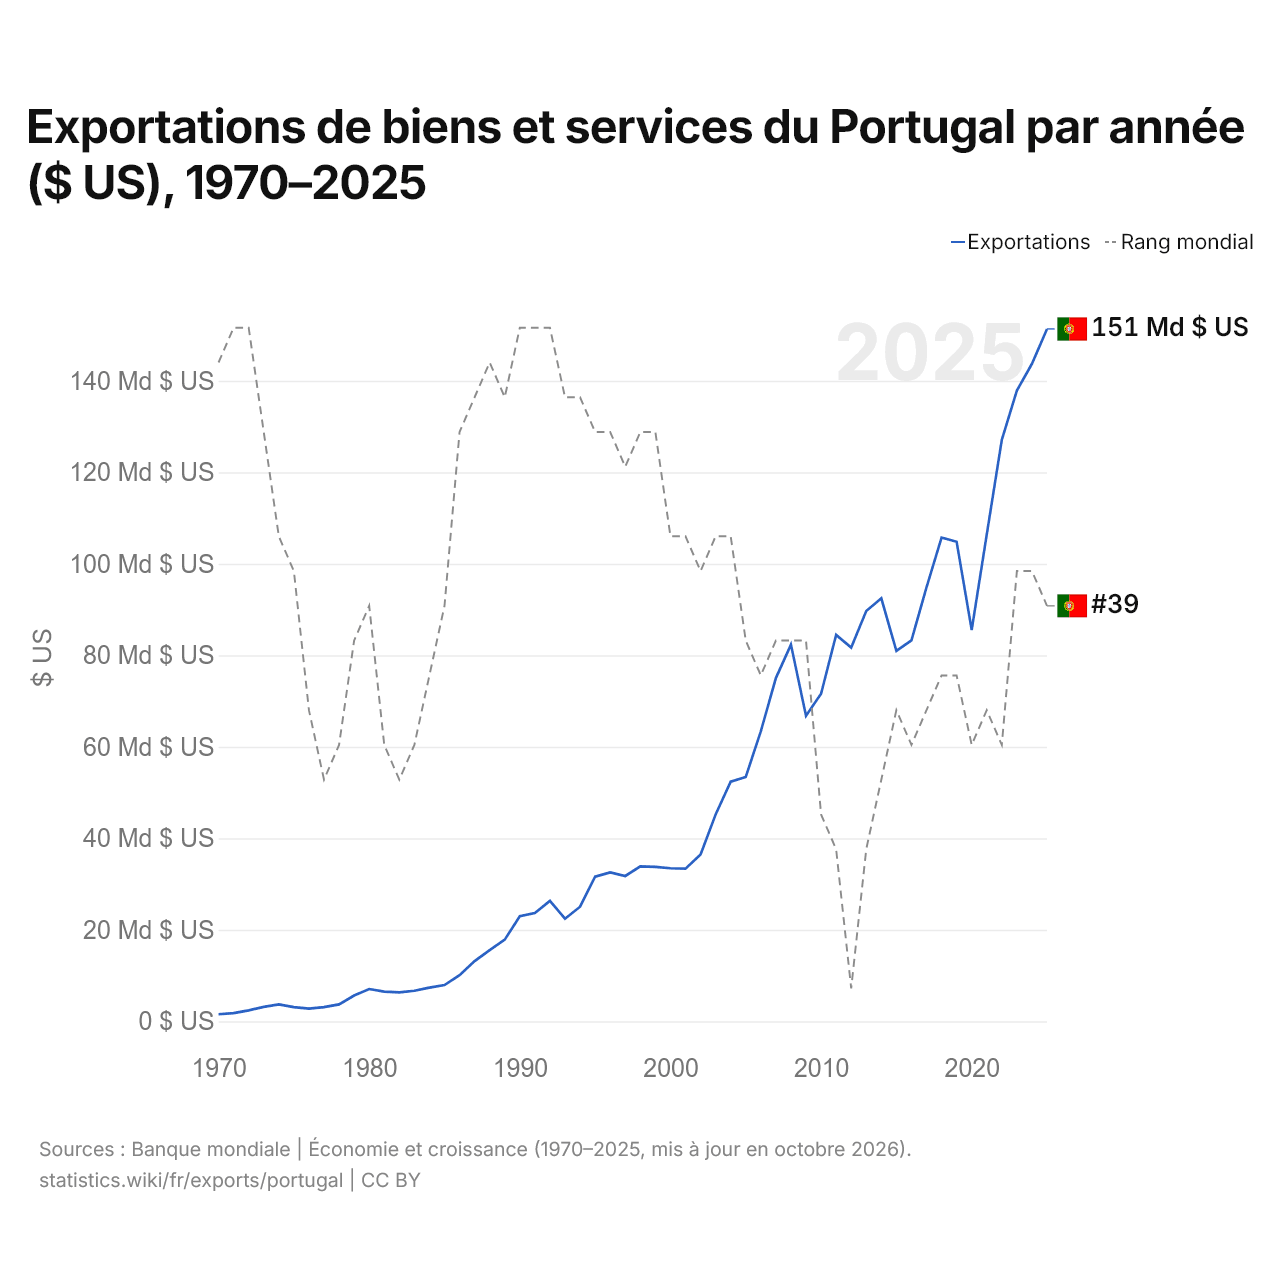
En 2025, les exportations de biens et services du Portugal s'élevaient à 151 milliards de dollars, contre 1,55 milliard de dollars en 1970. Elles se classaient au 39e rang mondial, en baisse par rapport au 38e rang en 2024. Leur meilleur rang a été le 31e, occupé pour la dernière fois en 1992.
En 2025, les exportations de biens et services du Portugal étaient les 20es plus élevées de 41 pays situés en Europe. Les importations de biens et services du Portugal s'élevaient à 148 milliards de dollars en 2025, au 40e rang mondial. En 2025, les exportations du Portugal dépassaient ses importations de 3,18 milliards de dollars, soit un excédent commercial.
Exportations de biens du Portugal par catégorie, 2025
Exportations de biens, 2025: 89,5 Md $US
En 2025, la première catégorie des exportations de biens du Portugal était « machines, électronique et véhicules », avec 31,6 %, suivie de « textiles, vêtements, chaussures, meubles et jouets », avec 15,2 %.
Destinations des exportations de biens du Portugal : les 10 premières, 2025
| Rang | Pays | Exportations de biens | Part | |
|---|---|---|---|---|
| 1 |
 Espagne |
23,3 Md $US | 26 % | vs Espagne |
| 2 |
 Allemagne |
12,4 Md $US | 13,9 % | |
| 3 |
 France |
10,7 Md $US | 12 % | vs France |
| 4 |
 États-Unis |
5,18 Md $US | 5,79 % | |
| 5 |
 Royaume-Uni |
4,04 Md $US | 4,51 % | vs R.-U. |
| 6 |
 Italie |
4,00 Md $US | 4,47 % | vs Italie |
| 7 |
 Pays-Bas |
2,96 Md $US | 3,31 % | vs Pays-Bas |
| 8 |
 Belgique |
2,30 Md $US | 2,57 % | vs Belgique |
| 9 |
 Pologne |
1,39 Md $US | 1,55 % | vs Pologne |
| 10 |
 Angola |
1,23 Md $US | 1,38 % | |
| Autres partenaires et non précisés | 21,9 Md $US | 24,5 % |
Exportations de biens du Portugal vers ses 5 principales destinations ($ US), 2001–2025
| Année | $ US | ||||
|---|---|---|---|---|---|
| Espagne | Allemagne | France | États-Unis | Royaume-Uni | |
| 2025 | 23 284 024 000 $ US | 12 427 021 000 $ US | 10 749 067 000 $ US | 5 183 969 000 $ US | 4 037 698 000 $ US |
| 2024 | 21 435 210 000 $ US | 10 121 170 000 $ US | 9 996 888 000 $ US | 5 571 035 000 $ US | 3 784 791 000 $ US |
| 2023 | 21 529 416 000 $ US | 8 952 285 000 $ US | 10 947 717 000 $ US | 5 664 097 000 $ US | 3 938 520 000 $ US |
| 2022 | 21 772 641 000 $ US | 9 002 194 000 $ US | 10 254 991 000 $ US | 5 369 640 000 $ US | 4 066 800 000 $ US |
| 2021 | 20 125 645 000 $ US | 8 292 672 000 $ US | 9 876 248 000 $ US | 4 195 254 000 $ US | 3 910 486 000 $ US |
| 2020 | 15 575 177 000 $ US | 7 285 322 000 $ US | 8 345 515 000 $ US | 3 050 142 000 $ US | 3 497 593 000 $ US |
| 2019 | 16 582 017 000 $ US | 8 040 834 000 $ US | 8 679 651 000 $ US | 3 399 184 000 $ US | 4 062 654 000 $ US |
| 2018 | 18 733 964 000 $ US | 8 511 209 000 $ US | 9 439 357 000 $ US | 3 660 782 000 $ US | 4 711 799 000 $ US |
| 2017 | 15 641 894 000 $ US | 7 066 928 000 $ US | 7 808 354 000 $ US | 3 211 978 000 $ US | 4 119 688 000 $ US |
| 2016 | 14 307 755 000 $ US | 6 460 077 000 $ US | 7 001 729 000 $ US | 2 727 773 000 $ US | 3 915 429 000 $ US |
| 2015 | 13 652 195 000 $ US | 6 523 789 000 $ US | 6 692 464 000 $ US | 2 846 870 000 $ US | 3 721 822 000 $ US |
| 2014 | 14 990 403 000 $ US | 7 462 326 000 $ US | 7 519 737 000 $ US | 2 803 995 000 $ US | 3 910 856 000 $ US |
| 2013 | 14 837 360 000 $ US | 7 312 271 000 $ US | 7 298 402 000 $ US | 2 652 012 000 $ US | 3 468 243 000 $ US |
| 2012 | 13 054 721 000 $ US | 7 195 067 000 $ US | 6 881 657 000 $ US | 2 399 013 000 $ US | 3 068 459 000 $ US |
| 2011 | 14 845 876 000 $ US | 8 072 198 000 $ US | 7 246 237 000 $ US | 2 082 361 000 $ US | 3 107 535 000 $ US |
| 2010 | 13 341 214 000 $ US | 6 408 001 000 $ US | 5 907 175 000 $ US | 1 742 427 000 $ US | 2 686 877 000 $ US |
| 2009 | 12 032 665 000 $ US | 5 705 152 000 $ US | 5 464 601 000 $ US | 1 398 941 000 $ US | 2 475 806 000 $ US |
| 2008 | 15 899 943 000 $ US | 7 200 883 000 $ US | 6 720 738 000 $ US | 1 936 666 000 $ US | 3 105 946 000 $ US |
| 2007 | 15 024 905 000 $ US | 6 697 588 000 $ US | 6 566 308 000 $ US | 2 411 806 000 $ US | 3 138 237 000 $ US |
| 2006 | 12 690 488 000 $ US | 5 772 632 000 $ US | 5 588 308 000 $ US | 2 642 916 000 $ US | 3 045 264 000 $ US |
| 2005 | 10 625 898 000 $ US | 4 738 212 000 $ US | 5 196 561 000 $ US | 2 048 554 000 $ US | 3 162 605 000 $ US |
| 2004 | 9 366 737 000 $ US | 4 909 843 000 $ US | 5 072 479 000 $ US | 2 169 352 000 $ US | 3 481 865 000 $ US |
| 2003 | 7 578 389 000 $ US | 4 704 371 000 $ US | 4 195 980 000 $ US | 1 813 238 000 $ US | 3 272 411 000 $ US |
| 2002 | 5 408 753 000 $ US | 4 565 464 000 $ US | 3 493 543 000 $ US | 1 480 521 000 $ US | 2 682 375 000 $ US |
| 2001 | 4 652 849 000 $ US | 4 573 947 000 $ US | 3 062 904 000 $ US | 1 376 899 000 $ US | 2 459 615 000 $ US |
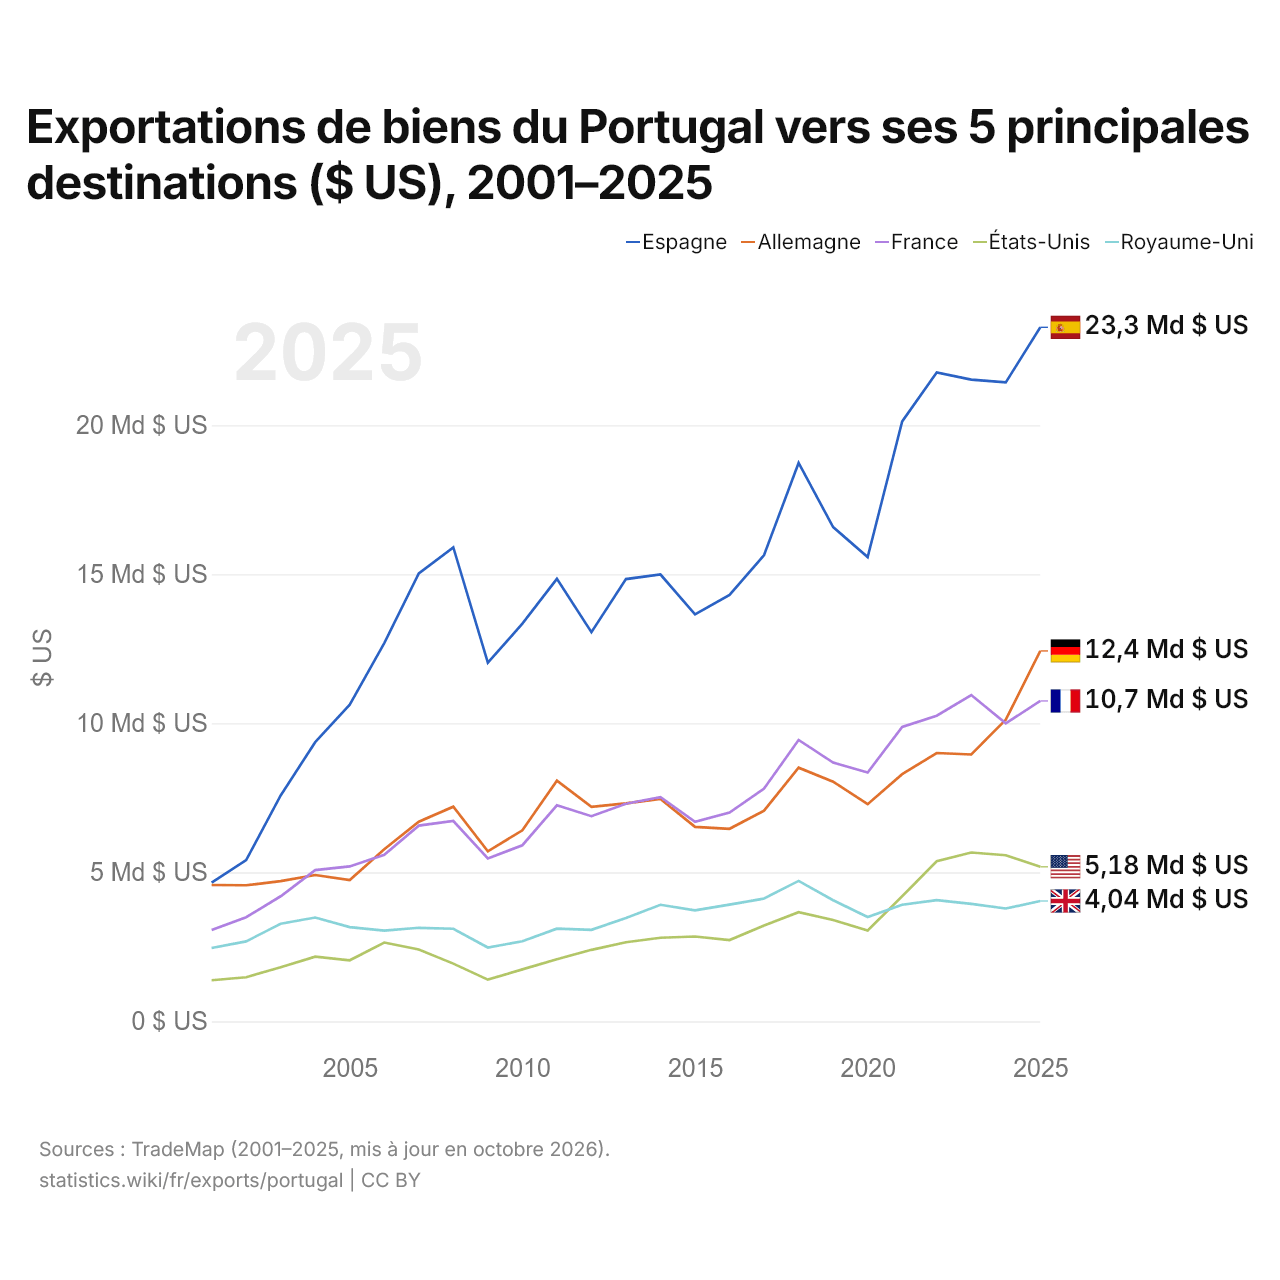
En 2025, les exportations de biens s'élevaient à 23,3 milliards de dollars vers l'Espagne, 12,4 milliards de dollars vers l'Allemagne, 10,7 milliards de dollars vers la France, 5,18 milliards de dollars vers les États-Unis et 4,04 milliards de dollars vers le Royaume-Uni. Le premier rang des cinq destinations du Portugal est occupé par l'Espagne chaque année depuis 2001. Le changement le plus récent dans leur ordre remonte à 2024, quand les exportations du Portugal vers l'Allemagne ont dépassé celles vers la France.
Exportations de biens et de services du Portugal ($ US), 1975–2025
| Année | $ US | |
|---|---|---|
| Biens | Services | |
| 2025 | 83 195 513 438 $ US | 68 965 998 082 $ US |
| 2024 | 81 585 292 480 $ US | 62 993 389 075 $ US |
| 2023 | 80 373 205 271 $ US | 57 757 266 466 $ US |
| 2022 | 79 977 884 835 $ US | 46 975 382 790 $ US |
| 2021 | 73 448 878 656 $ US | 33 009 134 460 $ US |
| 2020 | 59 638 766 800 $ US | 26 292 615 232 $ US |
| 2019 | 64 862 951 740 $ US | 40 523 663 633 $ US |
| 2018 | 66 383 268 466 $ US | 39 837 319 318 $ US |
| 2017 | 60 238 771 837 $ US | 35 349 107 730 $ US |
| 2016 | 54 368 465 327 $ US | 29 648 932 194 $ US |
| 2015 | 54 279 489 095 $ US | 27 950 198 479 $ US |
| 2014 | 62 826 690 547 $ US | 30 928 532 414 $ US |
| 2013 | 61 760 155 039 $ US | 29 231 859 870 $ US |
| 2012 | 56 958 651 124 $ US | 25 572 508 335 $ US |
| 2011 | 58 888 388 805 $ US | 26 980 204 102 $ US |
| 2010 | 48 937 557 705 $ US | 23 065 422 038 $ US |
| 2009 | 43 882 162 468 $ US | 23 112 663 367 $ US |
| 2008 | 56 912 938 989 $ US | 26 465 589 565 $ US |
| 2007 | 52 087 914 238 $ US | 23 657 320 953 $ US |
| 2006 | 45 040 147 043 $ US | 18 586 805 937 $ US |
| 2005 | 38 646 941 793 $ US | 15 096 851 051 $ US |
| 2004 | 38 008 457 918 $ US | 14 720 032 847 $ US |
| 2003 | 33 106 614 151 $ US | 12 312 041 558 $ US |
| 2002 | 26 333 142 628 $ US | 10 342 908 085 $ US |
| 2001 | 24 112 883 791 $ US | 9 458 813 134 $ US |
| 2000 | 24 230 391 758 $ US | 9 323 126 261 $ US |
| 1999 | 24 507 448 186 $ US | 9 294 045 334 $ US |
| 1998 | 24 850 611 321 $ US | 9 133 878 633 $ US |
| 1997 | 23 947 214 700 $ US | 7 919 227 515 $ US |
| 1996 | 24 703 612 347 $ US | 8 145 897 442 $ US |
| 1995 | 23 809 532 696 $ US | 8 418 973 924 $ US |
| 1994 | 18 434 451 064 $ US | 6 940 035 110 $ US |
| 1993 | 15 780 789 829 $ US | 6 976 916 893 $ US |
| 1992 | 18 348 132 041 $ US | 5 497 394 005 $ US |
| 1991 | 16 390 748 441 $ US | 5 231 156 577 $ US |
| 1990 | 16 457 895 136 $ US | 5 095 766 493 $ US |
| 1989 | 12 842 577 781 $ US | 3 788 781 271 $ US |
| 1988 | 11 015 033 400 $ US | 3 418 126 818 $ US |
| 1987 | 9 334 525 117 $ US | 3 164 536 133 $ US |
| 1986 | 7 264 817 158 $ US | 2 424 528 083 $ US |
| 1985 | 5 749 073 582 $ US | 1 930 735 148 $ US |
| 1984 | 5 246 497 630 $ US | 1 656 081 033 $ US |
| 1983 | 4 646 210 852 $ US | 1 478 084 682 $ US |
| 1982 | 4 194 101 943 $ US | 1 535 891 598 $ US |
| 1981 | 4 184 643 589 $ US | 1 946 176 618 $ US |
| 1980 | 4 667 869 889 $ US | 2 005 840 069 $ US |
| 1979 | 3 608 188 713 $ US | 1 591 884 519 $ US |
| 1978 | 2 781 934 256 $ US | 1 075 615 827 $ US |
| 1977 | 2 564 467 181 $ US | 839 815 804 $ US |
| 1976 | 1 824 567 192 $ US | 756 331 332 $ US |
| 1975 | 1 941 607 508 $ US | 941 029 961 $ US |
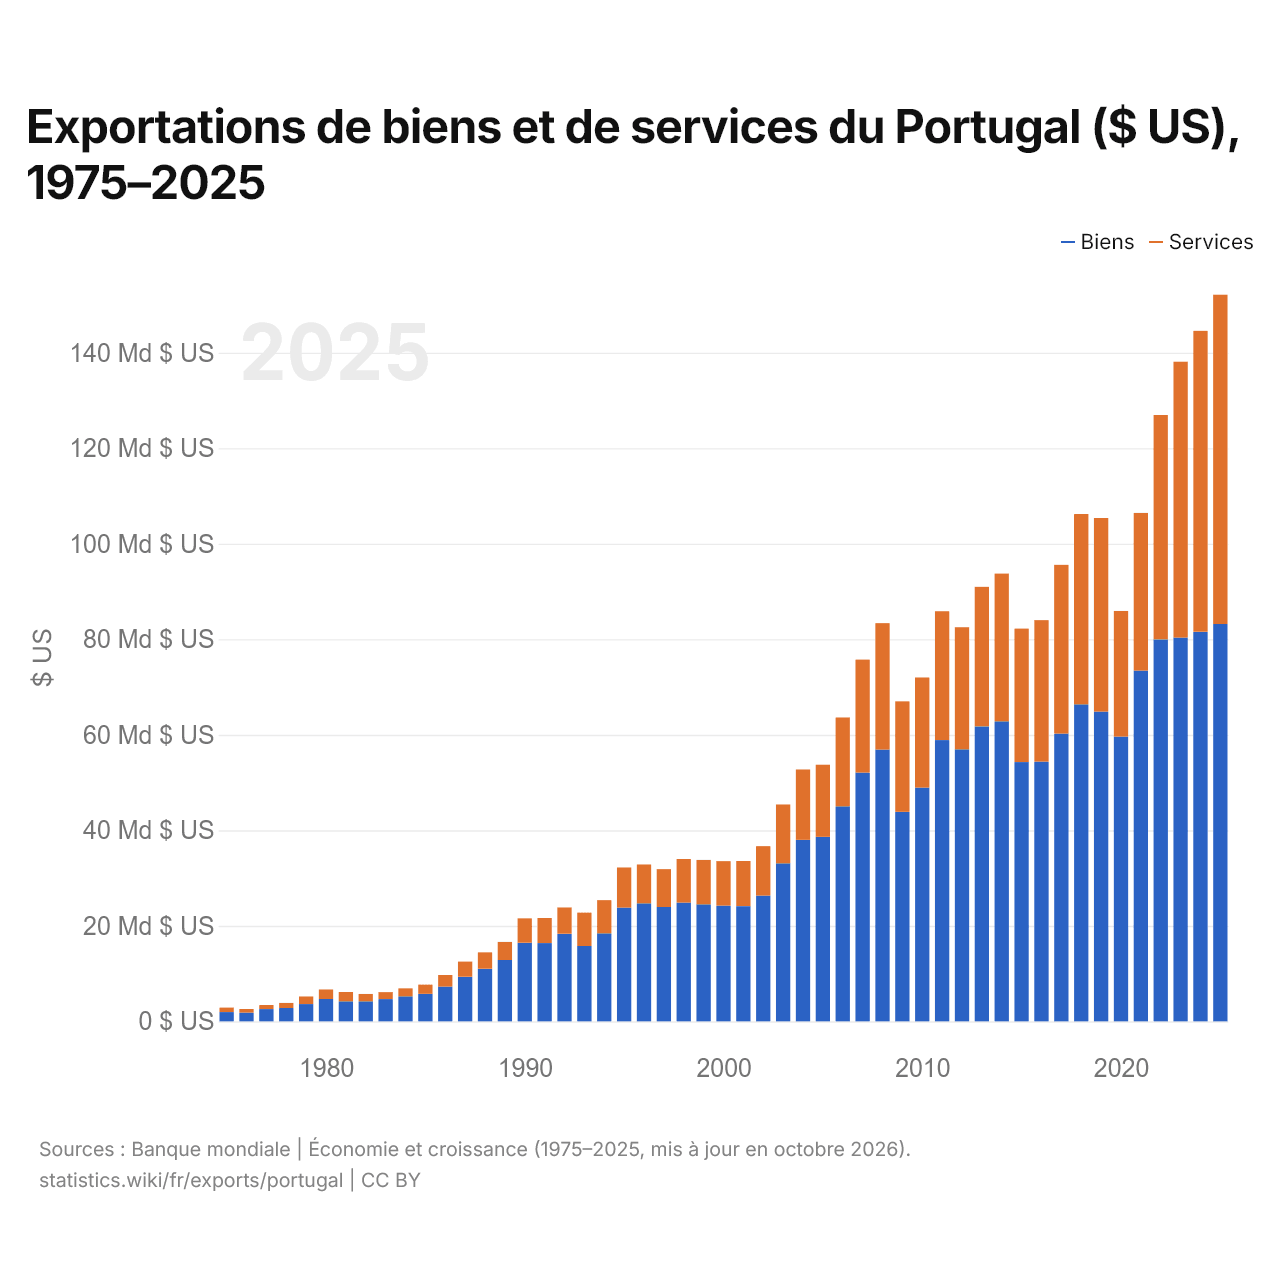
En 2025, les exportations de biens du Portugal s'élevaient à 83,2 milliards de dollars et celles de services à 69 milliards de dollars ; les services représentaient 45,3 % du total, contre 32,6 % en 1975.
Le Portugal dans le classement mondial des exportations, 2025
| Rang | Pays | Exportations | Part mondiale | |
|---|---|---|---|---|
| 36 |
 Hongrie |
179 Md $US | 0,51 % | vs Hongrie |
| 37 |
 Israël |
168 Md $US | 0,48 % | vs Israël |
| 38 |
 Roumanie |
152 Md $US | 0,44 % | vs Roumanie |
| 39 |
 Portugal |
151 Md $US | 0,43 % | |
| 40 |
 Finlande |
134 Md $US | 0,38 % | |
| 41 |
 Afrique du Sud |
134 Md $US | 0,38 % | |
| 42 |
 Slovaquie |
131 Md $US | 0,38 % |
Exportations de biens et services du Portugal, % du PIB, 1970–2025
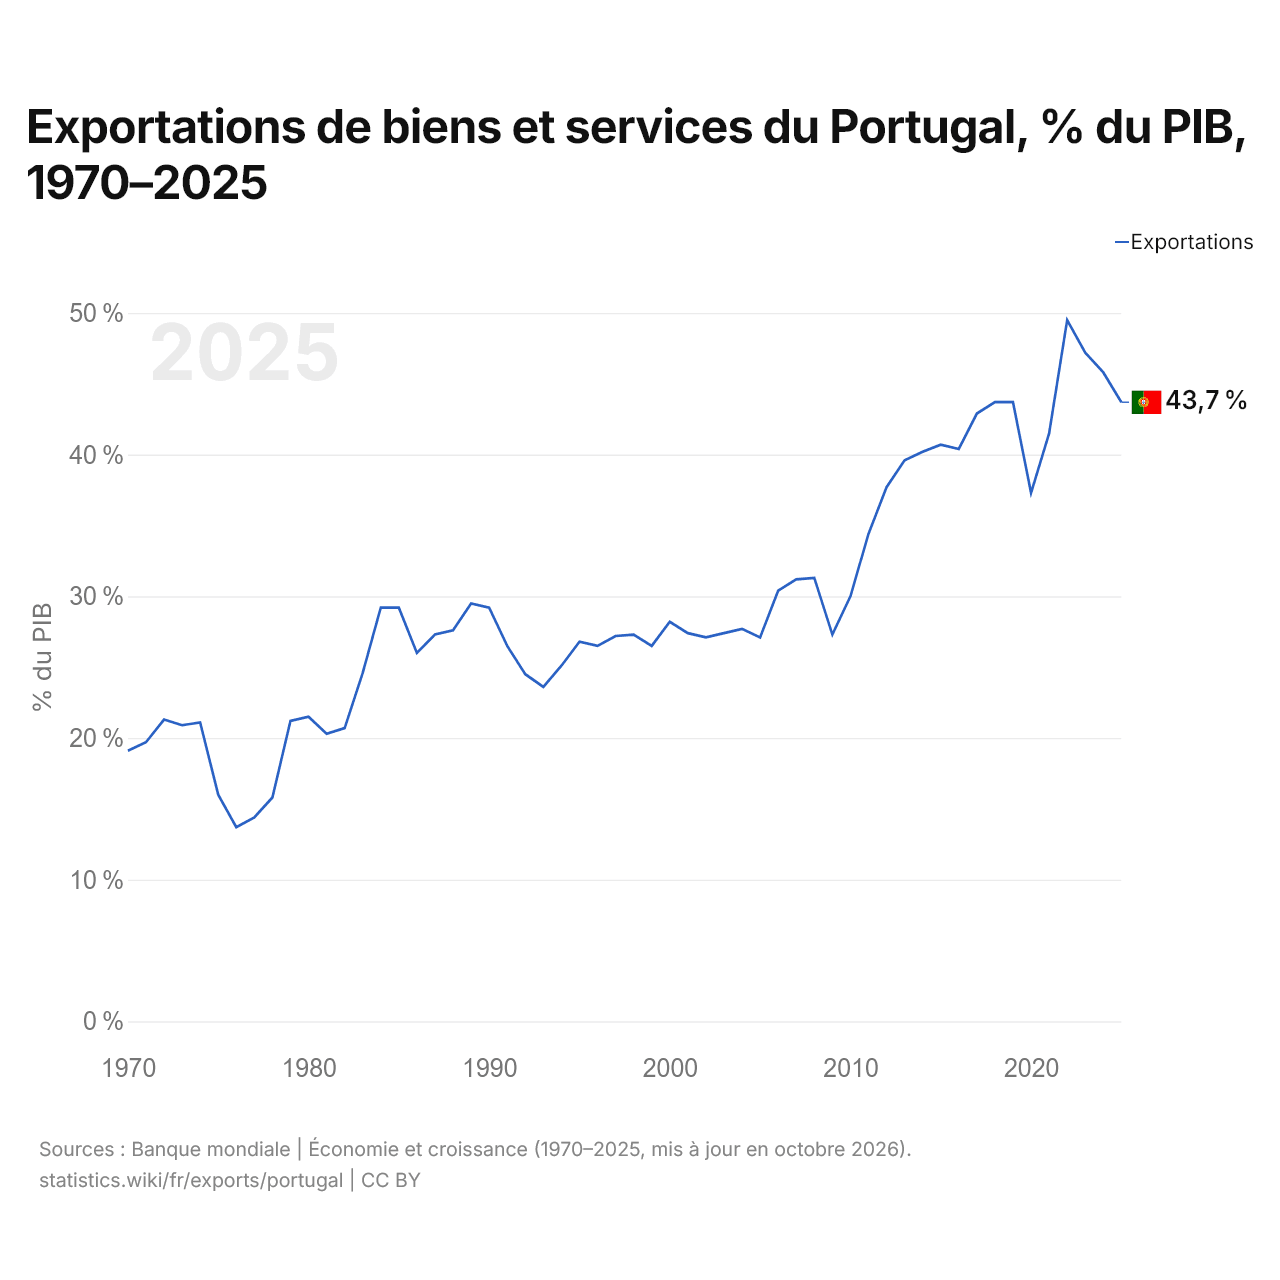
En 2025, les exportations de biens et services du Portugal équivalaient à 43,7 % de son PIB, contre 19,1 % en 1970. La part la plus élevée a été de 49,5 %, en 2022.
Comparer les exportations du Portugal avec celles d'autres pays
Sources :
- TradeMap (2001–2025, mis à jour en octobre 2026)
- Banque mondiale | Économie et croissance (1970–2025, mis à jour en octobre 2026)
Creative Commons Attribution (CC BY) : vous pouvez copier, partager, adapter et réutiliser ce contenu, y compris à des fins commerciales, à condition de citer statistics.wiki et d’indiquer les modifications apportées. Les sources citées ci-dessus peuvent avoir leurs propres conditions de licence.