
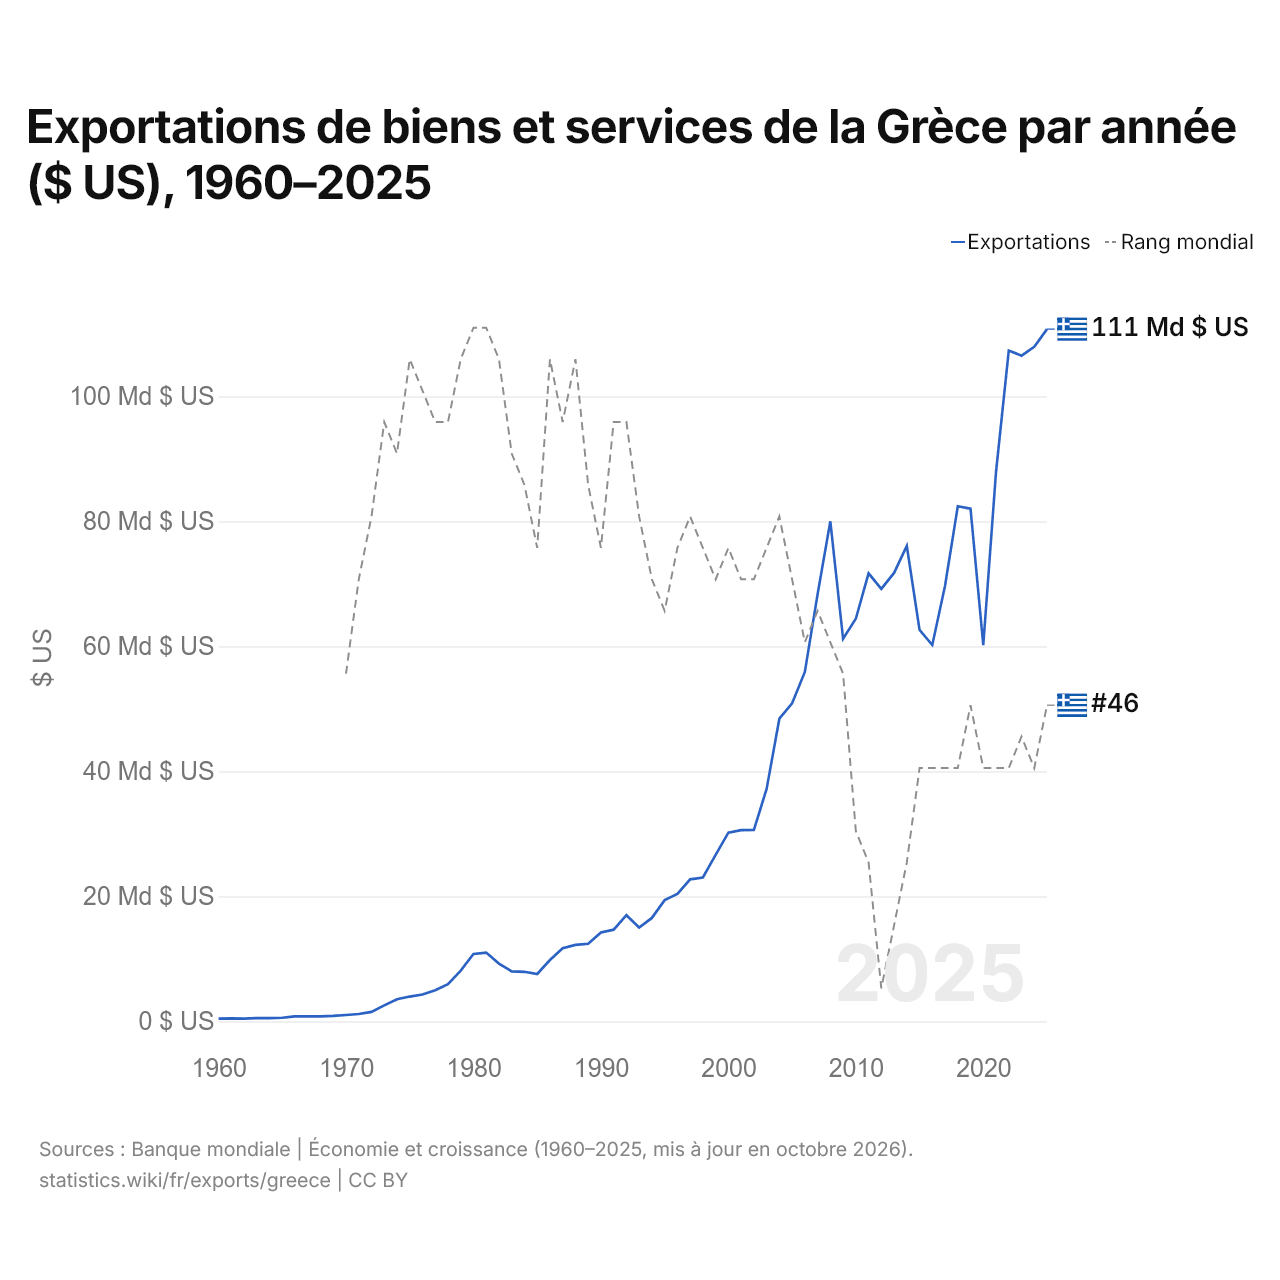
Exportations de biens et services de la Grèce par année ($ US), 1960–2025
| Année | $ US | Rang mondial |
|---|---|---|
| Exportations | Rang mondial | |
| 2025 | 110 743 741 990 $ US | #46 |
| 2024 | 107 906 278 861 $ US | #48 |
| 2023 | 106 504 786 801 $ US | #47 |
| 2022 | 107 320 103 000 $ US | #48 |
| 2021 | 87 890 002 523 $ US | #48 |
| 2020 | 60 184 486 580 $ US | #48 |
| 2019 | 82 010 713 282 $ US | #46 |
| 2018 | 82 399 082 670 $ US | #48 |
| 2017 | 69 691 264 259 $ US | #48 |
| 2016 | 60 206 483 726 $ US | #48 |
| 2015 | 62 624 153 982 $ US | #48 |
| 2014 | 76 056 457 342 $ US | #51 |
| 2013 | 71 740 892 359 $ US | #53 |
| 2012 | 69 182 299 553 $ US | #55 |
| 2011 | 71 678 227 685 $ US | #51 |
| 2010 | 64 408 084 270 $ US | #50 |
| 2009 | 61 214 696 316 $ US | #45 |
| 2008 | 80 002 280 548 $ US | #44 |
| 2007 | 68 338 676 372 $ US | #43 |
| 2006 | 55 899 928 858 $ US | #44 |
| 2005 | 50 868 190 128 $ US | #42 |
| 2004 | 48 427 679 624 $ US | #40 |
| 2003 | 37 167 664 772 $ US | #41 |
| 2002 | 30 626 385 965 $ US | #42 |
| 2001 | 30 582 572 464 $ US | #42 |
| 2000 | 30 196 597 914 $ US | #41 |
| 1999 | 26 625 314 615 $ US | #42 |
| 1998 | 23 016 451 055 $ US | #41 |
| 1997 | 22 716 461 999 $ US | #40 |
| 1996 | 20 396 997 452 $ US | #41 |
| 1995 | 19 395 600 824 $ US | #43 |
| 1994 | 16 545 700 843 $ US | #42 |
| 1993 | 15 014 692 331 $ US | #40 |
| 1992 | 16 986 794 780 $ US | #37 |
| 1991 | 14 665 696 392 $ US | #37 |
| 1990 | 14 210 855 546 $ US | #41 |
| 1989 | 12 400 650 441 $ US | #39 |
| 1988 | 12 221 486 908 $ US | #35 |
| 1987 | 11 688 341 721 $ US | #37 |
| 1986 | 9 799 520 448 $ US | #35 |
| 1985 | 7 578 756 477 $ US | #41 |
| 1984 | 7 925 024 184 $ US | #39 |
| 1983 | 7 999 818 111 $ US | #38 |
| 1982 | 9 232 897 959 $ US | #35 |
| 1981 | 10 998 456 335 $ US | #34 |
| 1980 | 10 787 426 059 $ US | #34 |
| 1979 | 8 120 634 775 $ US | #35 |
| 1978 | 5 937 115 028 $ US | #37 |
| 1977 | 4 968 001 850 $ US | #37 |
| 1976 | 4 299 095 149 $ US | #36 |
| 1975 | 3 962 624 867 $ US | #35 |
| 1974 | 3 540 079 545 $ US | #38 |
| 1973 | 2 554 695 052 $ US | #37 |
| 1972 | 1 514 340 909 $ US | #40 |
| 1971 | 1 169 159 091 $ US | #42 |
| 1970 | 1 017 465 909 $ US | #45 |
| 1969 | 878 078 639 $ US | - |
| 1968 | 791 766 667 $ US | - |
| 1967 | 819 571 866 $ US | - |
| 1966 | 788 927 084 $ US | - |
| 1965 | 577 923 334 $ US | - |
| 1964 | 500 981 988 $ US | - |
| 1963 | 525 311 537 $ US | - |
| 1962 | 427 584 441 $ US | - |
| 1961 | 462 193 281 $ US | - |
| 1960 | 421 746 258 $ US | - |
En 2025, les exportations de biens et services de la Grèce s'élevaient à 111 milliards de dollars, contre 422 millions de dollars en 1960. Elles se classaient au 46e rang mondial, en hausse par rapport au 48e rang en 2024. Leur meilleur rang a été le 34e, occupé pour la dernière fois en 1981.
En 2025, les exportations de biens et services de la Grèce étaient les 23es plus élevées de 41 pays situés en Europe. Les importations de biens et services de la Grèce s'élevaient à 123 milliards de dollars en 2025, au 45e rang mondial. En 2025, les importations de la Grèce dépassaient ses exportations de 12,7 milliards de dollars, soit un déficit commercial.
Exportations de biens de la Grèce par catégorie, 2025
Exportations de biens, 2025: 54,9 Md $US
En 2025, la première catégorie des exportations de biens de la Grèce était « pétrole, gaz, minerais et autres matières premières », avec 29,9 %, suivie de « produits chimiques, pharmaceutiques et plastiques », avec 12,7 %.
Destinations des exportations de biens de la Grèce : les 10 premières, 2025
| Rang | Pays | Exportations de biens | Part | |
|---|---|---|---|---|
| 1 |
 Italie |
5,02 Md $US | 9,14 % | vs Italie |
| 2 |
 Allemagne |
4,28 Md $US | 7,8 % | vs Allemagne |
| 3 |
 Chypre |
3,74 Md $US | 6,81 % | vs Chypre |
| 4 |
 Bulgarie |
3,57 Md $US | 6,49 % | vs Bulgarie |
| 5 |
 Royaume-Uni |
3,43 Md $US | 6,24 % | |
| 6 |
 États-Unis |
2,71 Md $US | 4,94 % | |
| 7 |
 Roumanie |
2,36 Md $US | 4,3 % | vs Roumanie |
| 8 |
 Espagne |
1,86 Md $US | 3,38 % | vs Espagne |
| 9 |
 France |
1,75 Md $US | 3,19 % | vs France |
| 10 |
 Turquie |
1,56 Md $US | 2,83 % | vs Turquie |
| Autres partenaires et non précisés | 24,7 Md $US | 44,9 % |
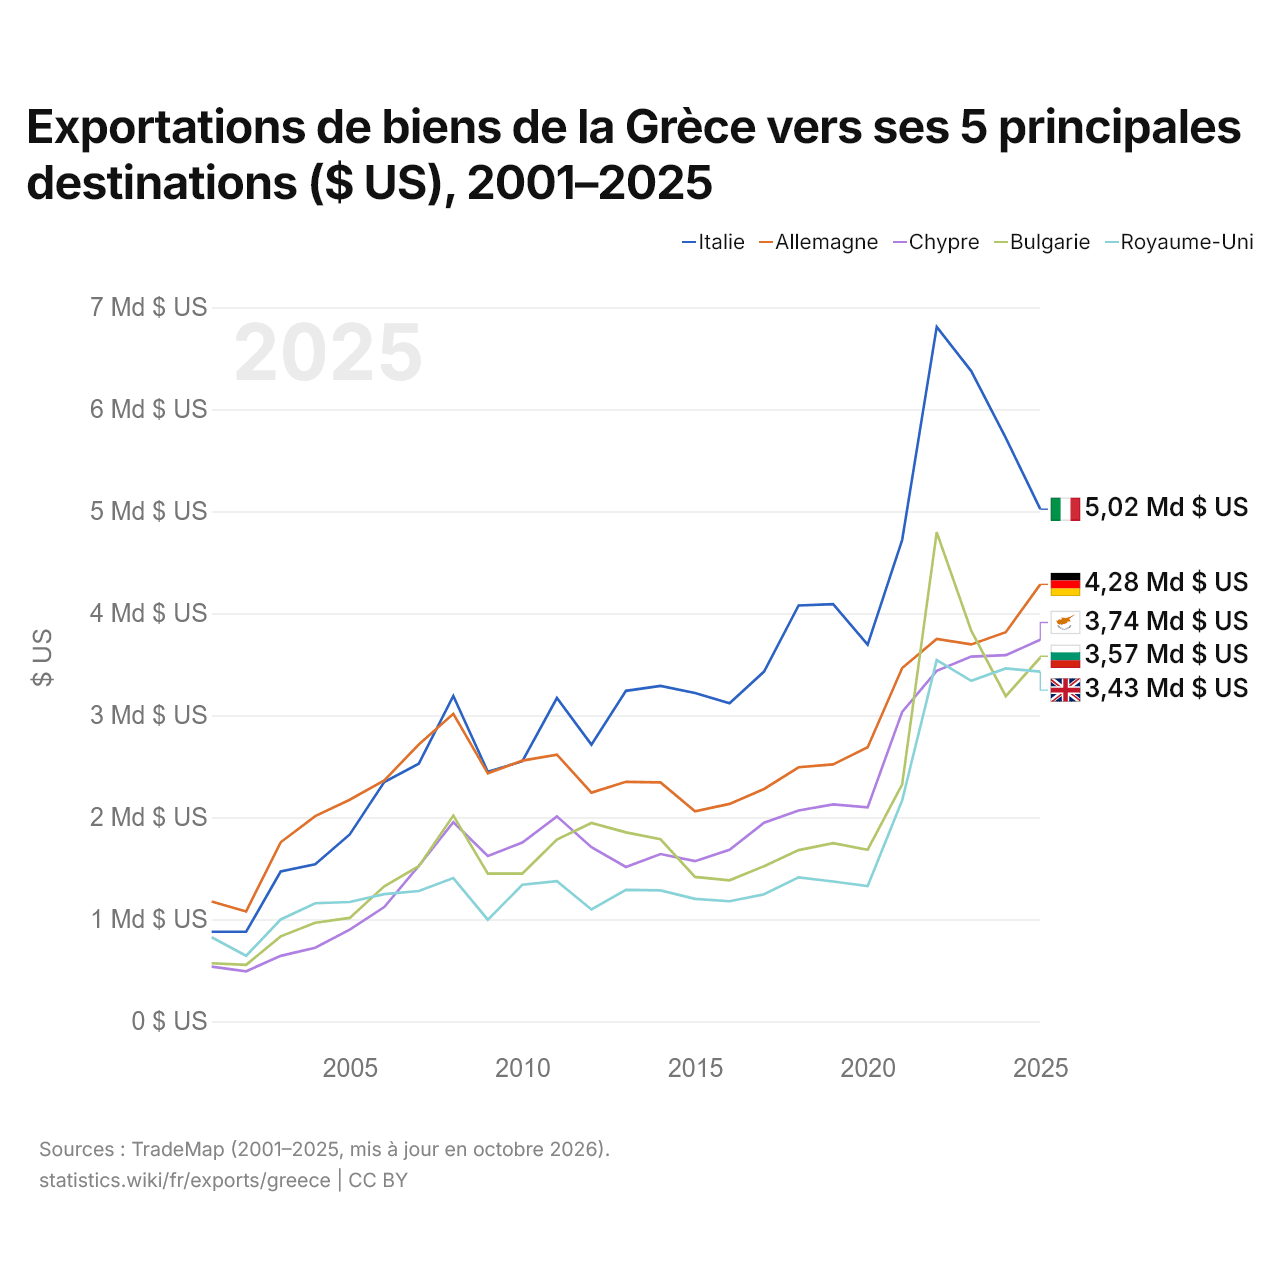
Exportations de biens de la Grèce vers ses 5 principales destinations ($ US), 2001–2025
| Année | $ US | ||||
|---|---|---|---|---|---|
| Italie | Allemagne | Chypre | Bulgarie | Royaume-Uni | |
| 2025 | 5 020 848 000 $ US | 4 283 585 000 $ US | 3 741 732 000 $ US | 3 566 682 000 $ US | 3 428 198 000 $ US |
| 2024 | 5 719 435 000 $ US | 3 814 990 000 $ US | 3 589 306 000 $ US | 3 186 947 000 $ US | 3 459 780 000 $ US |
| 2023 | 6 375 088 000 $ US | 3 695 276 000 $ US | 3 575 406 000 $ US | 3 830 052 000 $ US | 3 338 198 000 $ US |
| 2022 | 6 807 968 000 $ US | 3 749 009 000 $ US | 3 436 524 000 $ US | 4 795 375 000 $ US | 3 540 969 000 $ US |
| 2021 | 4 720 425 000 $ US | 3 463 613 000 $ US | 3 034 168 000 $ US | 2 324 031 000 $ US | 2 167 678 000 $ US |
| 2020 | 3 692 358 000 $ US | 2 686 289 000 $ US | 2 096 836 000 $ US | 1 682 450 000 $ US | 1 326 798 000 $ US |
| 2019 | 4 089 943 000 $ US | 2 519 380 000 $ US | 2 126 615 000 $ US | 1 746 443 000 $ US | 1 370 965 000 $ US |
| 2018 | 4 077 120 000 $ US | 2 490 600 000 $ US | 2 066 466 000 $ US | 1 679 003 000 $ US | 1 411 772 000 $ US |
| 2017 | 3 428 470 000 $ US | 2 278 016 000 $ US | 1 947 211 000 $ US | 1 521 239 000 $ US | 1 245 506 000 $ US |
| 2016 | 3 119 192 000 $ US | 2 131 517 000 $ US | 1 682 629 000 $ US | 1 382 670 000 $ US | 1 177 634 000 $ US |
| 2015 | 3 218 695 000 $ US | 2 058 146 000 $ US | 1 570 261 000 $ US | 1 416 119 000 $ US | 1 200 587 000 $ US |
| 2014 | 3 288 451 000 $ US | 2 342 431 000 $ US | 1 639 903 000 $ US | 1 785 447 000 $ US | 1 283 910 000 $ US |
| 2013 | 3 239 928 000 $ US | 2 347 834 000 $ US | 1 512 612 000 $ US | 1 852 436 000 $ US | 1 288 495 000 $ US |
| 2012 | 2 712 161 000 $ US | 2 242 078 000 $ US | 1 706 451 000 $ US | 1 944 935 000 $ US | 1 096 408 000 $ US |
| 2011 | 3 169 754 000 $ US | 2 614 594 000 $ US | 2 009 438 000 $ US | 1 782 396 000 $ US | 1 373 751 000 $ US |
| 2010 | 2 550 086 000 $ US | 2 555 845 000 $ US | 1 753 060 000 $ US | 1 448 665 000 $ US | 1 339 369 000 $ US |
| 2009 | 2 445 884 000 $ US | 2 431 026 000 $ US | 1 621 315 000 $ US | 1 447 665 000 $ US | 996 360 000 $ US |
| 2008 | 3 189 398 000 $ US | 3 014 495 000 $ US | 1 952 092 000 $ US | 2 017 090 000 $ US | 1 404 798 000 $ US |
| 2007 | 2 526 065 000 $ US | 2 714 191 000 $ US | 1 524 038 000 $ US | 1 521 303 000 $ US | 1 277 831 000 $ US |
| 2006 | 2 346 692 000 $ US | 2 362 340 000 $ US | 1 120 112 000 $ US | 1 323 724 000 $ US | 1 247 450 000 $ US |
| 2005 | 1 832 260 000 $ US | 2 171 999 000 $ US | 899 180 000 $ US | 1 014 015 000 $ US | 1 169 803 000 $ US |
| 2004 | 1 538 917 000 $ US | 2 012 008 000 $ US | 721 042 000 $ US | 967 041 000 $ US | 1 157 582 000 $ US |
| 2003 | 1 468 541 000 $ US | 1 755 196 000 $ US | 642 076 000 $ US | 833 085 000 $ US | 998 455 000 $ US |
| 2002 | 878 746 000 $ US | 1 077 319 000 $ US | 490 659 000 $ US | 553 234 000 $ US | 642 771 000 $ US |
| 2001 | 878 373 000 $ US | 1 175 166 000 $ US | 536 844 000 $ US | 569 689 000 $ US | 824 858 000 $ US |
En 2025, les exportations de biens s'élevaient à 5,02 milliards de dollars vers l'Italie, 4,28 milliards de dollars vers l'Allemagne, 3,74 milliards de dollars vers Chypre, 3,57 milliards de dollars vers la Bulgarie et 3,43 milliards de dollars vers le Royaume-Uni. Le premier rang des cinq destinations de la Grèce est occupé par l'Italie depuis 2011. Le changement le plus récent dans leur ordre remonte à 2025, quand les exportations de la Grèce vers la Bulgarie ont dépassé celles vers le Royaume-Uni.
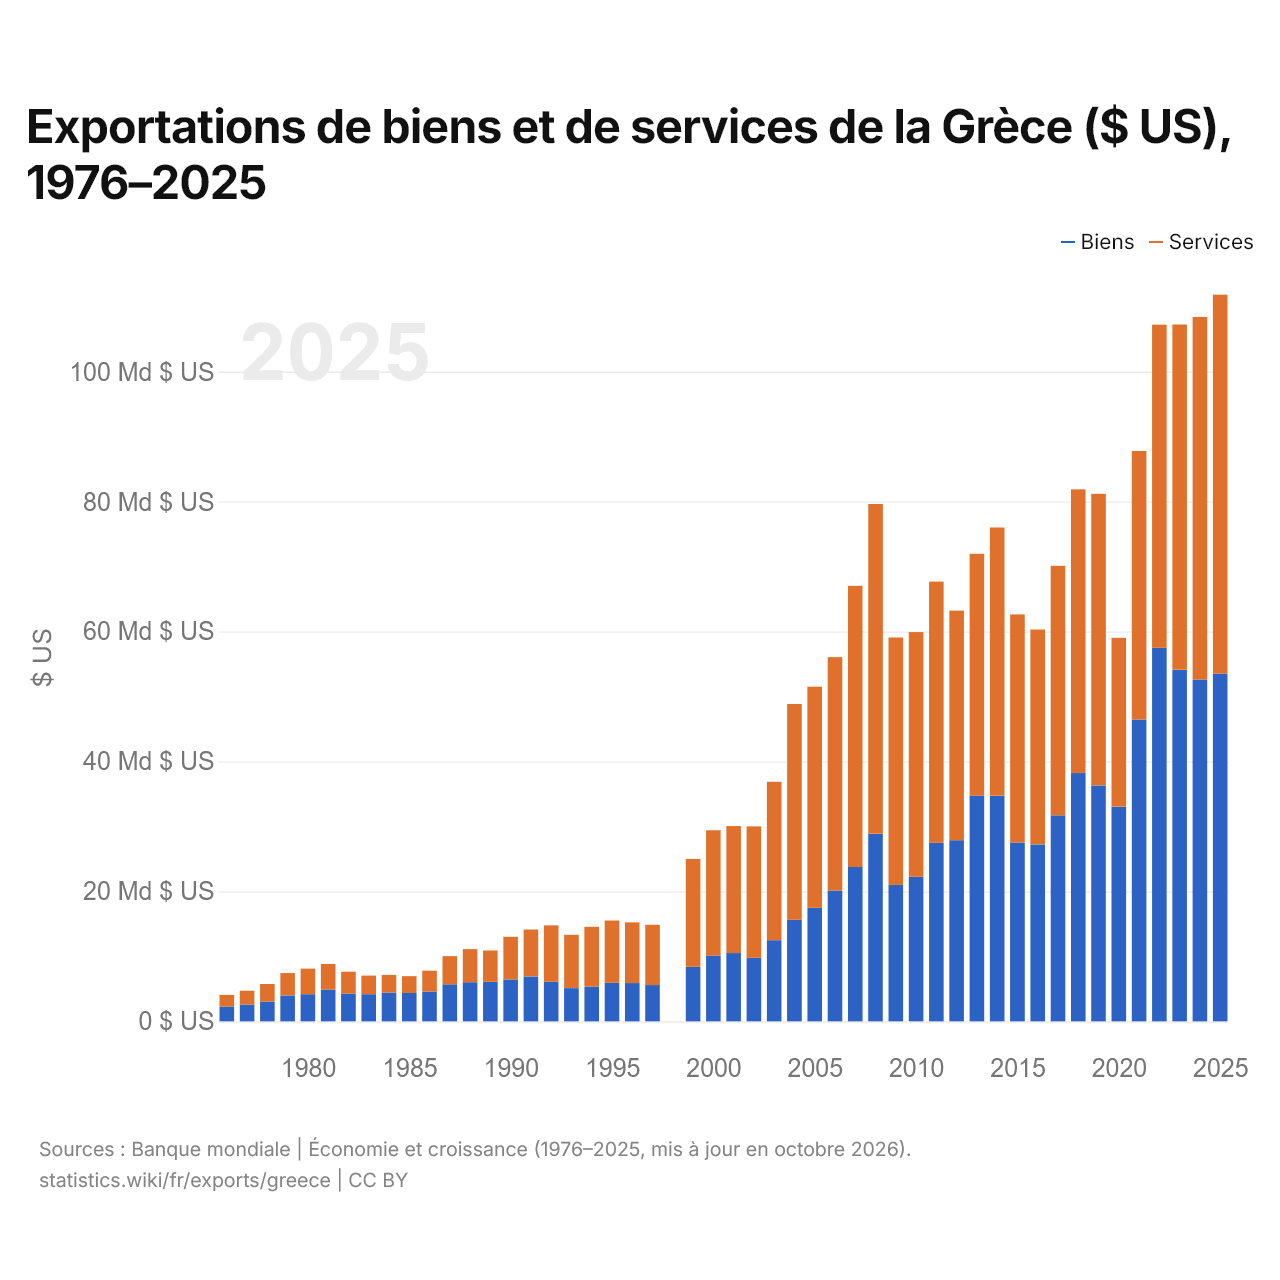
Exportations de biens et de services de la Grèce ($ US), 1976–2025
| Année | $ US | |
|---|---|---|
| Biens | Services | |
| 2025 | 53 535 671 546 $ US | 58 301 594 025 $ US |
| 2024 | 52 614 126 856 $ US | 55 792 265 242 $ US |
| 2023 | 54 114 020 143 $ US | 53 130 551 976 $ US |
| 2022 | 57 477 629 163 $ US | 49 743 642 626 $ US |
| 2021 | 46 452 353 062 $ US | 41 322 045 084 $ US |
| 2020 | 33 035 804 104 $ US | 25 985 705 038 $ US |
| 2019 | 36 308 417 145 $ US | 44 875 697 908 $ US |
| 2018 | 38 208 484 097 $ US | 43 659 235 484 $ US |
| 2017 | 31 702 637 913 $ US | 38 401 943 376 $ US |
| 2016 | 27 229 570 716 $ US | 33 075 837 345 $ US |
| 2015 | 27 518 376 686 $ US | 35 106 606 354 $ US |
| 2014 | 34 723 906 909 $ US | 41 273 826 267 $ US |
| 2013 | 34 764 136 571 $ US | 37 196 327 995 $ US |
| 2012 | 27 884 573 855 $ US | 35 329 588 220 $ US |
| 2011 | 27 471 481 985 $ US | 40 197 276 222 $ US |
| 2010 | 22 244 488 075 $ US | 37 660 362 569 $ US |
| 2009 | 20 993 418 271 $ US | 38 075 465 079 $ US |
| 2008 | 28 869 024 559 $ US | 50 753 851 262 $ US |
| 2007 | 23 747 394 212 $ US | 43 279 467 948 $ US |
| 2006 | 20 138 995 839 $ US | 35 916 377 310 $ US |
| 2005 | 17 461 520 087 $ US | 34 045 529 047 $ US |
| 2004 | 15 629 355 371 $ US | 33 213 133 547 $ US |
| 2003 | 12 485 857 067 $ US | 24 386 730 616 $ US |
| 2002 | 9 771 471 868 $ US | 20 235 733 062 $ US |
| 2001 | 10 502 103 046 $ US | 19 546 311 318 $ US |
| 2000 | 10 120 149 406 $ US | 19 286 349 745 $ US |
| 1999 | 8 390 919 224 $ US | 16 603 358 169 $ US |
| 1998 | - | - |
| 1997 | 5 576 000 000 $ US | 9 287 000 000 $ US |
| 1996 | 5 890 000 000 $ US | 9 348 000 000 $ US |
| 1995 | 5 918 000 000 $ US | 9 605 000 000 $ US |
| 1994 | 5 338 000 000 $ US | 9 213 000 000 $ US |
| 1993 | 5 112 000 000 $ US | 8 214 000 000 $ US |
| 1992 | 6 076 000 000 $ US | 8 697 000 000 $ US |
| 1991 | 6 911 000 000 $ US | 7 222 350 000 $ US |
| 1990 | 6 458 000 000 $ US | 6 560 000 000 $ US |
| 1989 | 6 074 000 000 $ US | 4 828 000 000 $ US |
| 1988 | 6 015 000 000 $ US | 5 094 000 000 $ US |
| 1987 | 5 699 000 000 $ US | 4 332 000 000 $ US |
| 1986 | 4 586 000 000 $ US | 3 213 000 000 $ US |
| 1985 | 4 357 000 000 $ US | 2 600 000 000 $ US |
| 1984 | 4 426 000 000 $ US | 2 724 000 000 $ US |
| 1983 | 4 179 000 000 $ US | 2 857 000 000 $ US |
| 1982 | 4 273 000 000 $ US | 3 360 000 000 $ US |
| 1981 | 4 884 000 000 $ US | 3 953 000 000 $ US |
| 1980 | 4 175 000 000 $ US | 3 947 000 000 $ US |
| 1979 | 3 991 000 000 $ US | 3 436 000 000 $ US |
| 1978 | 3 036 000 000 $ US | 2 705 000 000 $ US |
| 1977 | 2 583 000 000 $ US | 2 133 000 000 $ US |
| 1976 | 2 258 000 000 $ US | 1 808 000 000 $ US |
En 2025, les exportations de biens de la Grèce s'élevaient à 53,5 milliards de dollars et celles de services à 58,3 milliards de dollars ; les services représentaient 52,1 % du total, contre 44,5 % en 1976.
La Grèce dans le classement mondial des exportations, 2025







Exportations de biens et services de la Grèce, % du PIB, 1960–2025
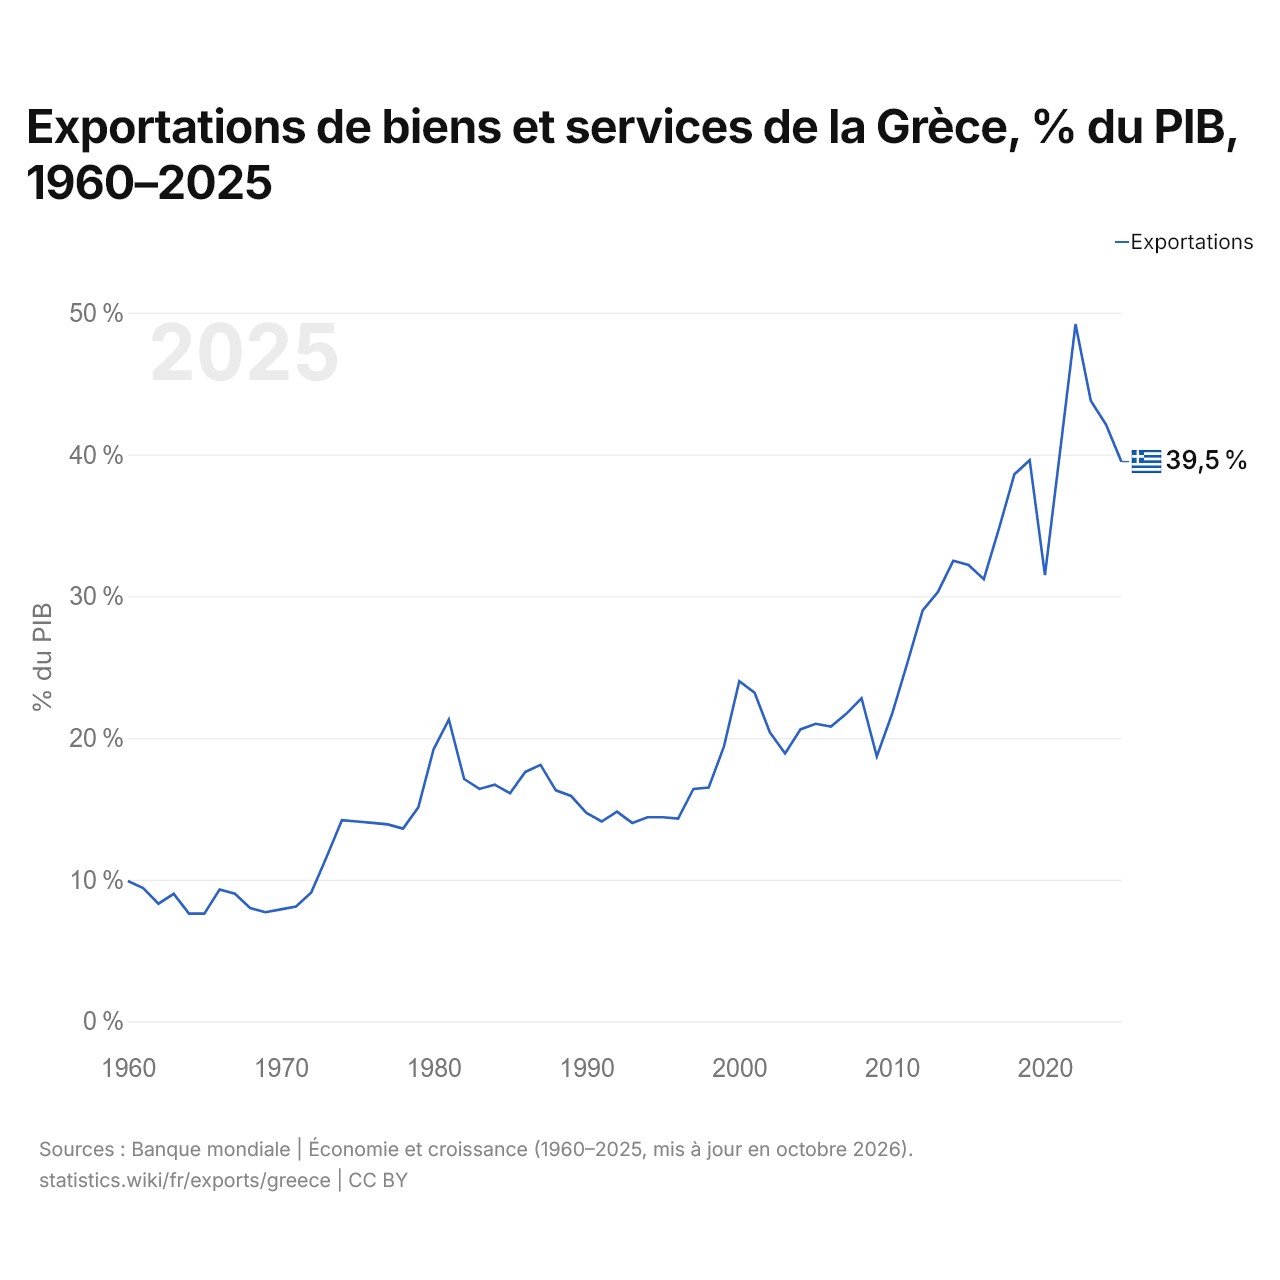
En 2025, les exportations de biens et services de la Grèce équivalaient à 39,5 % de son PIB, contre 9,9 % en 1960. La part la plus élevée a été de 49,2 %, en 2022.
Comparer les exportations de la Grèce avec celles d'autres pays
Sources :
- TradeMap (2001–2025, mis à jour en octobre 2026)
- Banque mondiale | Économie et croissance (1960–2025, mis à jour en octobre 2026)
Creative Commons Attribution (CC BY) : vous pouvez copier, partager, adapter et réutiliser ce contenu, y compris à des fins commerciales, à condition de citer statistics.wiki et d’indiquer les modifications apportées. Les sources citées ci-dessus peuvent avoir leurs propres conditions de licence.