
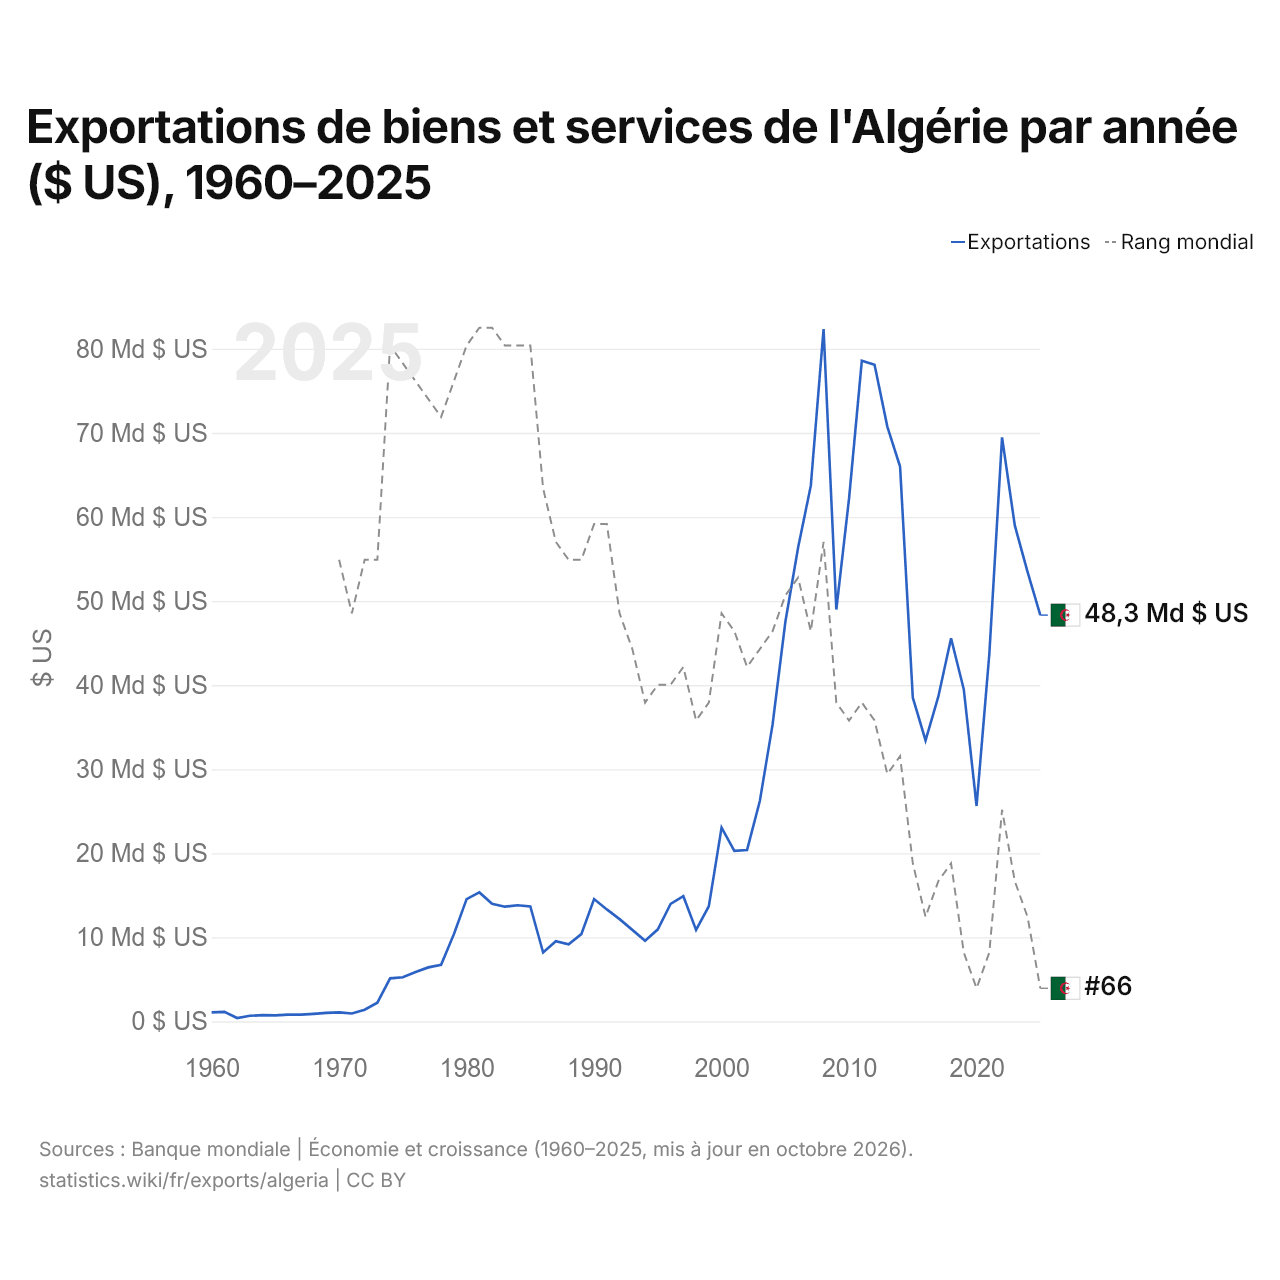
Exportations de biens et services de l'Algérie par année ($ US), 1960–2025
| Année | $ US | Rang mondial |
|---|---|---|
| Exportations | Rang mondial | |
| 2025 | 48 321 061 533 $ US | #66 |
| 2024 | 53 466 882 957 $ US | #62 |
| 2023 | 58 981 242 697 $ US | #60 |
| 2022 | 69 460 098 852 $ US | #56 |
| 2021 | 43 660 727 771 $ US | #64 |
| 2020 | 25 613 416 650 $ US | #66 |
| 2019 | 39 481 135 535 $ US | #64 |
| 2018 | 45 570 702 426 $ US | #59 |
| 2017 | 38 609 773 041 $ US | #60 |
| 2016 | 33 417 246 978 $ US | #62 |
| 2015 | 38 489 004 323 $ US | #59 |
| 2014 | 65 994 736 570 $ US | #53 |
| 2013 | 70 746 581 763 $ US | #54 |
| 2012 | 78 098 361 758 $ US | #51 |
| 2011 | 78 573 489 719 $ US | #50 |
| 2010 | 62 203 842 893 $ US | #51 |
| 2009 | 48 982 402 224 $ US | #50 |
| 2008 | 82 340 143 196 $ US | #41 |
| 2007 | 63 718 503 039 $ US | #46 |
| 2006 | 56 328 445 411 $ US | #43 |
| 2005 | 47 497 958 003 $ US | #44 |
| 2004 | 35 288 382 278 $ US | #46 |
| 2003 | 26 210 435 497 $ US | #47 |
| 2002 | 20 384 692 132 $ US | #48 |
| 2001 | 20 272 584 009 $ US | #46 |
| 2000 | 23 050 166 017 $ US | #45 |
| 1999 | 13 692 404 115 $ US | #50 |
| 1998 | 10 880 008 006 $ US | #51 |
| 1997 | 14 889 922 793 $ US | #48 |
| 1996 | 13 970 016 988 $ US | #49 |
| 1995 | 10 940 062 643 $ US | #49 |
| 1994 | 9 585 286 282 $ US | #50 |
| 1993 | 10 880 084 682 $ US | #47 |
| 1992 | 12 154 198 605 $ US | #45 |
| 1991 | 13 311 409 366 $ US | #40 |
| 1990 | 14 546 456 704 $ US | #40 |
| 1989 | 10 369 902 260 $ US | #42 |
| 1988 | 9 163 505 595 $ US | #42 |
| 1987 | 9 526 280 058 $ US | #41 |
| 1986 | 8 187 453 058 $ US | #38 |
| 1985 | 13 664 028 064 $ US | #30 |
| 1984 | 13 805 905 456 $ US | #30 |
| 1983 | 13 635 984 130 $ US | #30 |
| 1982 | 13 980 251 588 $ US | #29 |
| 1981 | 15 338 958 197 $ US | #29 |
| 1980 | 14 540 906 201 $ US | #30 |
| 1979 | 10 354 849 612 $ US | #32 |
| 1978 | 6 732 393 454 $ US | #34 |
| 1977 | 6 414 649 589 $ US | #33 |
| 1976 | 5 859 996 277 $ US | #32 |
| 1975 | 5 241 291 935 $ US | #31 |
| 1974 | 5 118 698 918 $ US | #30 |
| 1973 | 2 220 822 992 $ US | #42 |
| 1972 | 1 383 769 500 $ US | #42 |
| 1971 | 936 360 465 $ US | #45 |
| 1970 | 1 073 513 326 $ US | #42 |
| 1969 | 1 012 748 478 $ US | - |
| 1968 | 891 218 660 $ US | - |
| 1967 | 789 943 813 $ US | - |
| 1966 | 789 943 813 $ US | - |
| 1965 | 708 923 934 $ US | - |
| 1964 | 729 774 643 $ US | - |
| 1963 | 667 222 517 $ US | - |
| 1962 | 396 163 385 $ US | - |
| 1961 | 1 125 937 987 $ US | - |
| 1960 | 1 063 385 881 $ US | - |
En 2025, les exportations de biens et services de l'Algérie s'élevaient à 48,3 milliards de dollars, contre 1,06 milliard de dollars en 1960. Le maximum a été de 82,3 milliards de dollars, en 2008. Elles se classaient au 66e rang mondial, en baisse par rapport au 62e rang en 2024. Leur meilleur rang a été le 29e, occupé pour la dernière fois en 1982.
En 2025, les exportations de biens et services de l'Algérie étaient les 4es plus élevées de 50 pays situés en Afrique. Les importations de biens et services de l'Algérie s'élevaient à 63,6 milliards de dollars en 2025, au 62e rang mondial. En 2025, les importations de l'Algérie dépassaient ses exportations de 15,2 milliards de dollars, soit un déficit commercial.
Exportations de biens de l'Algérie par catégorie
Exportations de biens, 2024: 51,9 Md $US
La première catégorie des exportations de biens de l'Algérie est « pétrole, gaz, minerais et autres matières premières », avec 97,2 %, suivie de « métaux communs (fer, acier, cuivre, aluminium) », avec 1,5 %.
Destinations des exportations de biens de l'Algérie : les 10 premières
| Rang | Pays | Exportations de biens | Part | |
|---|---|---|---|---|
| 1 |
 Italie |
12,4 Md $US | 24 % | vs Italie |
| 2 |
 France |
7,57 Md $US | 14,6 % | vs France |
| 3 |
 Espagne |
6,40 Md $US | 12,3 % | vs Espagne |
| 4 |
 Turquie |
3,46 Md $US | 6,66 % | vs Turquie |
| 5 |
 États-Unis |
2,59 Md $US | 5 % | vs USA |
| 6 |
 Pays-Bas |
2,41 Md $US | 4,65 % | |
| 7 |
 Congo-Brazza |
2,17 Md $US | 4,19 % | |
| 8 |
 Chine |
1,99 Md $US | 3,83 % | vs Chine |
| 9 |
 Tunisie |
1,89 Md $US | 3,65 % | vs Tunisie |
| 10 |
 Belgique |
1,46 Md $US | 2,81 % | vs Belgique |
| Autres partenaires et non précisés | 9,49 Md $US | 18,3 % |
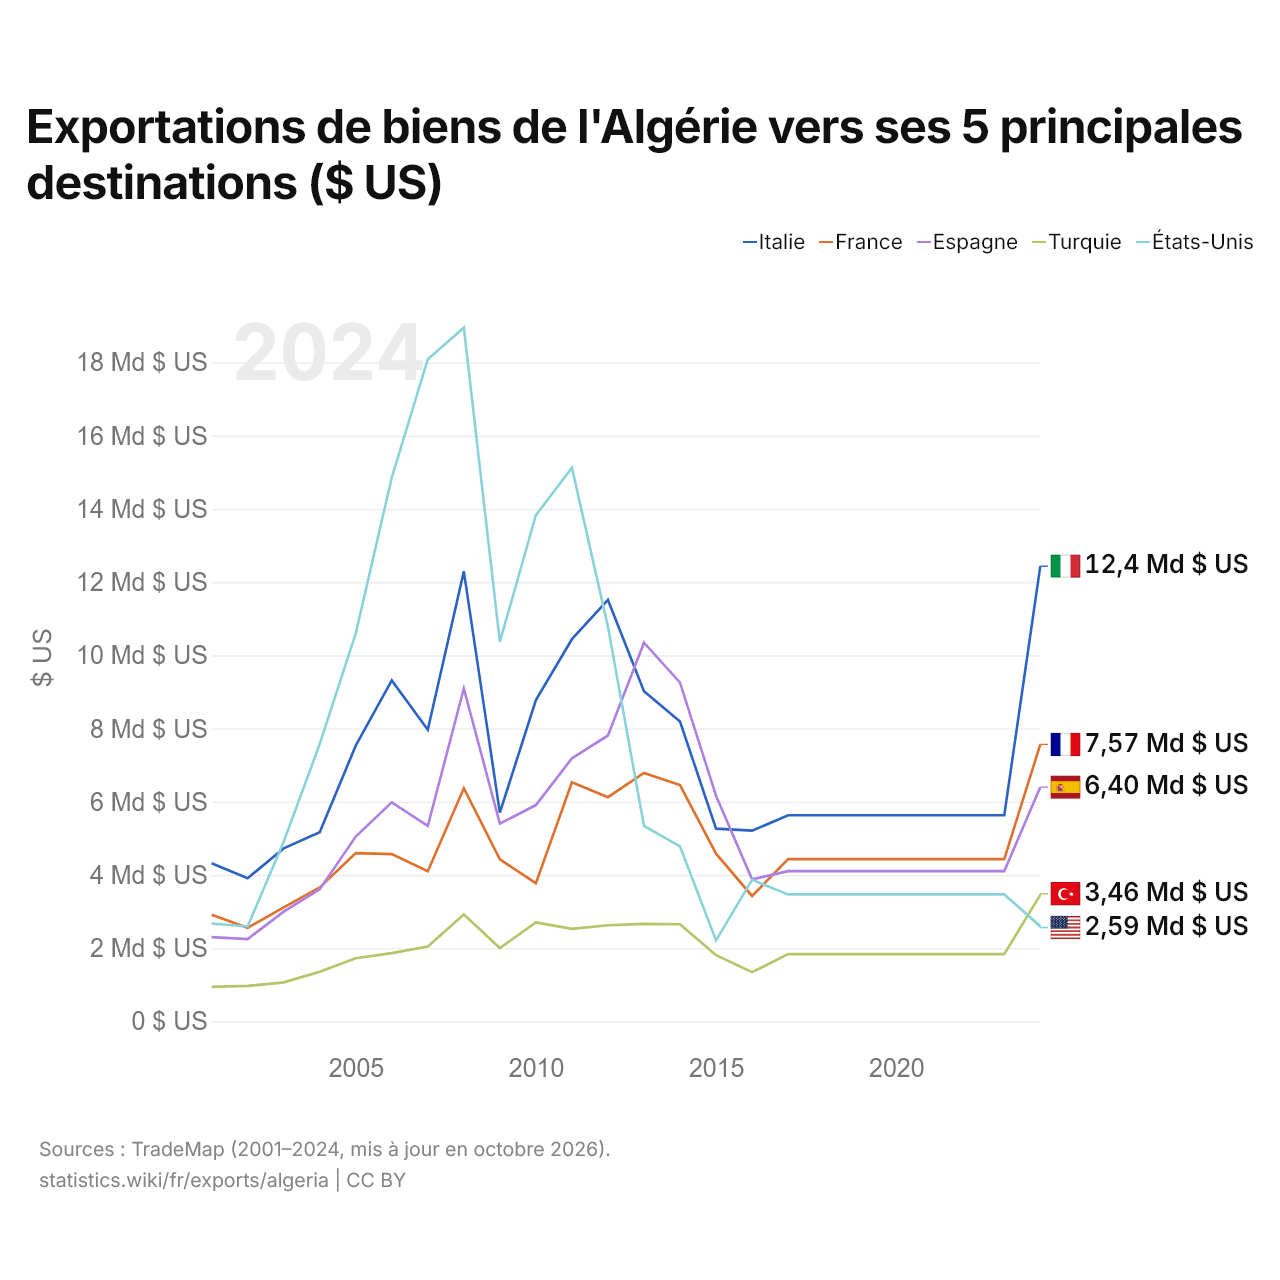
Exportations de biens de l'Algérie vers ses 5 principales destinations ($ US)
| Année | $ US | ||||
|---|---|---|---|---|---|
| Italie | France | Espagne | Turquie | États-Unis | |
| 2024 | 12 435 692 000 $ US | 7 565 153 000 $ US | 6 399 013 000 $ US | 3 455 273 000 $ US | 2 594 099 000 $ US |
| 2023 | 5 629 480 000 $ US | 4 431 262 000 $ US | 4 103 371 000 $ US | 1 837 059 000 $ US | 3 467 906 000 $ US |
| 2022 | 5 629 480 000 $ US | 4 431 262 000 $ US | 4 103 371 000 $ US | 1 837 059 000 $ US | 3 467 906 000 $ US |
| 2021 | 5 629 480 000 $ US | 4 431 262 000 $ US | 4 103 371 000 $ US | 1 837 059 000 $ US | 3 467 906 000 $ US |
| 2020 | 5 629 480 000 $ US | 4 431 262 000 $ US | 4 103 371 000 $ US | 1 837 059 000 $ US | 3 467 906 000 $ US |
| 2019 | 5 629 480 000 $ US | 4 431 262 000 $ US | 4 103 371 000 $ US | 1 837 059 000 $ US | 3 467 906 000 $ US |
| 2018 | 5 629 480 000 $ US | 4 431 262 000 $ US | 4 103 371 000 $ US | 1 837 059 000 $ US | 3 467 906 000 $ US |
| 2017 | 5 629 480 000 $ US | 4 431 262 000 $ US | 4 103 371 000 $ US | 1 837 059 000 $ US | 3 467 906 000 $ US |
| 2016 | 5 208 346 000 $ US | 3 424 139 000 $ US | 3 879 164 000 $ US | 1 344 187 000 $ US | 3 866 104 000 $ US |
| 2015 | 5 263 625 000 $ US | 4 578 427 000 $ US | 6 164 468 000 $ US | 1 806 689 000 $ US | 2 210 645 000 $ US |
| 2014 | 8 189 921 000 $ US | 6 455 945 000 $ US | 9 253 437 000 $ US | 2 652 467 000 $ US | 4 779 499 000 $ US |
| 2013 | 9 016 807 000 $ US | 6 786 095 000 $ US | 10 344 328 000 $ US | 2 660 820 000 $ US | 5 340 529 000 $ US |
| 2012 | 11 512 555 000 $ US | 6 124 176 000 $ US | 7 809 365 000 $ US | 2 624 563 000 $ US | 10 778 214 000 $ US |
| 2011 | 10 440 847 000 $ US | 6 533 567 000 $ US | 7 186 051 000 $ US | 2 524 922 000 $ US | 15 127 342 000 $ US |
| 2010 | 8 779 265 000 $ US | 3 776 057 000 $ US | 5 908 645 000 $ US | 2 703 622 000 $ US | 13 827 316 000 $ US |
| 2009 | 5 701 581 000 $ US | 4 424 345 000 $ US | 5 402 419 000 $ US | 2 002 348 000 $ US | 10 365 201 000 $ US |
| 2008 | 12 293 916 000 $ US | 6 370 446 000 $ US | 9 093 340 000 $ US | 2 919 721 000 $ US | 18 952 459 000 $ US |
| 2007 | 7 967 152 000 $ US | 4 099 711 000 $ US | 5 338 352 000 $ US | 2 043 206 000 $ US | 18 090 636 000 $ US |
| 2006 | 9 314 361 000 $ US | 4 569 914 000 $ US | 5 982 906 000 $ US | 1 864 364 000 $ US | 14 856 773 000 $ US |
| 2005 | 7 531 540 000 $ US | 4 595 319 000 $ US | 5 047 957 000 $ US | 1 725 234 000 $ US | 10 597 618 000 $ US |
| 2004 | 5 165 202 000 $ US | 3 656 189 000 $ US | 3 608 082 000 $ US | 1 356 224 000 $ US | 7 576 592 000 $ US |
| 2003 | 4 725 646 000 $ US | 3 113 228 000 $ US | 2 998 137 000 $ US | 1 065 741 000 $ US | 4 908 021 000 $ US |
| 2002 | 3 911 254 000 $ US | 2 554 279 000 $ US | 2 247 427 000 $ US | 967 032 000 $ US | 2 591 752 000 $ US |
| 2001 | 4 316 547 000 $ US | 2 913 475 000 $ US | 2 302 487 000 $ US | 940 890 000 $ US | 2 673 738 000 $ US |
Les exportations de biens s'élèvent à 12,4 milliards de dollars vers l'Italie (2024), 7,57 milliards de dollars vers la France (2024), 6,4 milliards de dollars vers l'Espagne (2024), 3,46 milliards de dollars vers la Turquie (2024) et 2,59 milliards de dollars vers les États-Unis (2024). Le premier rang des cinq destinations de l'Algérie est occupé par l'Italie depuis 2016. Le changement le plus récent dans leur ordre remonte à 2024, quand les exportations de l'Algérie vers la Turquie ont dépassé celles vers les États-Unis.
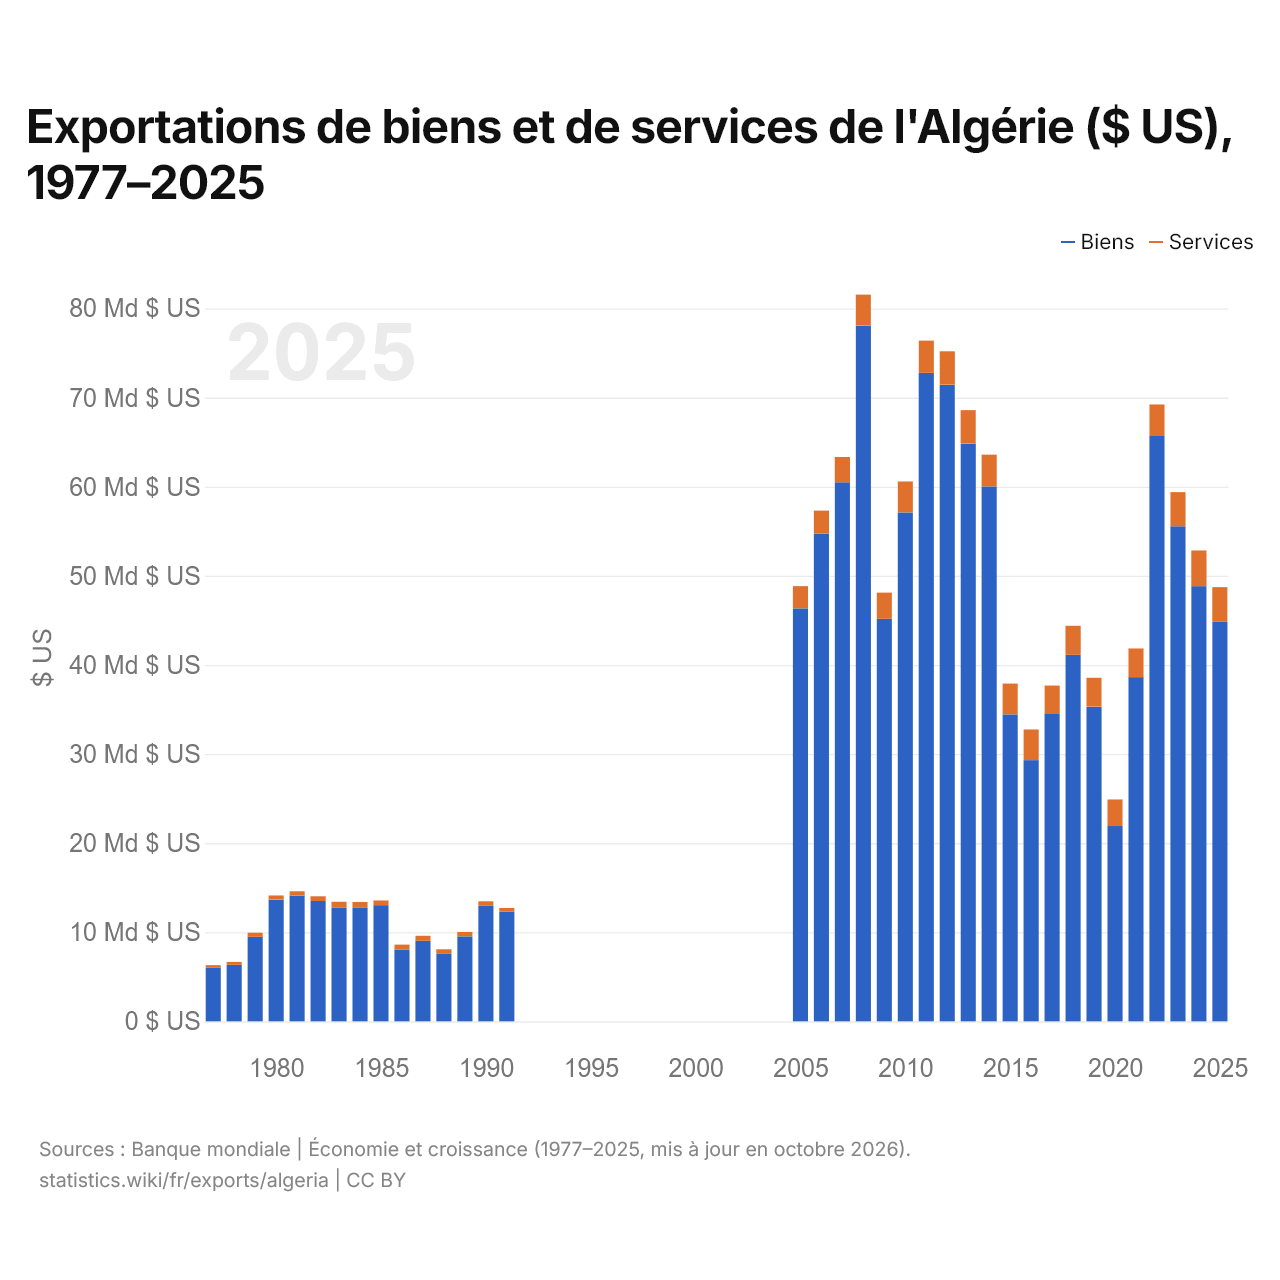
Exportations de biens et de services de l'Algérie ($ US), 1977–2025
| Année | $ US | |
|---|---|---|
| Biens | Services | |
| 2025 | 44 828 963 406 $ US | 3 895 100 391 $ US |
| 2024 | 48 832 363 820 $ US | 4 007 876 919 $ US |
| 2023 | 55 554 334 970 $ US | 3 826 865 455 $ US |
| 2022 | 65 691 533 457 $ US | 3 534 091 978 $ US |
| 2021 | 38 628 351 310 $ US | 3 217 634 296 $ US |
| 2020 | 21 914 992 637 $ US | 2 986 921 395 $ US |
| 2019 | 35 312 712 054 $ US | 3 238 634 546 $ US |
| 2018 | 41 123 518 094 $ US | 3 263 800 801 $ US |
| 2017 | 34 569 616 296 $ US | 3 111 226 276 $ US |
| 2016 | 29 316 936 939 $ US | 3 429 915 247 $ US |
| 2015 | 34 449 182 418 $ US | 3 456 144 198 $ US |
| 2014 | 60 033 584 184 $ US | 3 553 345 533 $ US |
| 2013 | 64 817 044 407 $ US | 3 772 725 254 $ US |
| 2012 | 71 438 958 670 $ US | 3 748 971 944 $ US |
| 2011 | 72 779 523 484 $ US | 3 607 795 208 $ US |
| 2010 | 57 098 374 720 $ US | 3 489 359 714 $ US |
| 2009 | 45 174 562 427 $ US | 2 934 754 182 $ US |
| 2008 | 78 062 556 459 $ US | 3 481 857 647 $ US |
| 2007 | 60 490 141 391 $ US | 2 839 210 803 $ US |
| 2006 | 54 740 000 000 $ US | 2 564 000 000 $ US |
| 2005 | 46 334 000 000 $ US | 2 507 000 000 $ US |
| 2004 | - | - |
| 2003 | - | - |
| 2002 | - | - |
| 2001 | - | - |
| 2000 | - | - |
| 1999 | - | - |
| 1998 | - | - |
| 1997 | - | - |
| 1996 | - | - |
| 1995 | - | - |
| 1994 | - | - |
| 1993 | - | - |
| 1992 | - | - |
| 1991 | 12 330 295 095 $ US | 392 846 268 $ US |
| 1990 | 12 963 761 314 $ US | 497 906 319 $ US |
| 1989 | 9 533 869 206 $ US | 495 757 519 $ US |
| 1988 | 7 620 249 883 $ US | 470 348 225 $ US |
| 1987 | 9 028 522 138 $ US | 565 390 940 $ US |
| 1986 | 8 064 535 566 $ US | 549 303 712 $ US |
| 1985 | 13 034 130 236 $ US | 531 445 165 $ US |
| 1984 | 12 791 933 179 $ US | 598 790 980 $ US |
| 1983 | 12 742 231 877 $ US | 679 293 351 $ US |
| 1982 | 13 509 235 789 $ US | 528 070 293 $ US |
| 1981 | 14 116 938 313 $ US | 473 839 393 $ US |
| 1980 | 13 651 773 968 $ US | 476 357 998 $ US |
| 1979 | 9 483 901 108 $ US | 468 174 190 $ US |
| 1978 | 6 339 796 769 $ US | 325 777 251 $ US |
| 1977 | 6 008 790 000 $ US | 287 694 605 $ US |
En 2025, les exportations de biens de l'Algérie s'élevaient à 44,8 milliards de dollars et celles de services à 3,9 milliards de dollars ; les services représentaient 8,0 % du total, contre 4,6 % en 1977.
L'Algérie dans le classement mondial des exportations, 2025
| Rang | Pays | Exportations | Part mondiale | |
|---|---|---|---|---|
| 63 |
 Biélorussie |
51,4 Md $US | 0,15 % | |
| 64 |
 Bangladesh |
50,7 Md $US | 0,15 % | |
| 65 |
 Croatie |
50,4 Md $US | 0,14 % | |
| 66 |
 Algérie |
48,3 Md $US | 0,14 % | |
| 67 |
 Bahreïn |
43,4 Md $US | 0,12 % | |
| 68 |
 Équateur |
41,0 Md $US | 0,12 % | |
| 69 |
 Pakistan |
40,7 Md $US | 0,12 % | vs Pakistan |
Exportations de biens et services de l'Algérie, % du PIB, 1960–2025
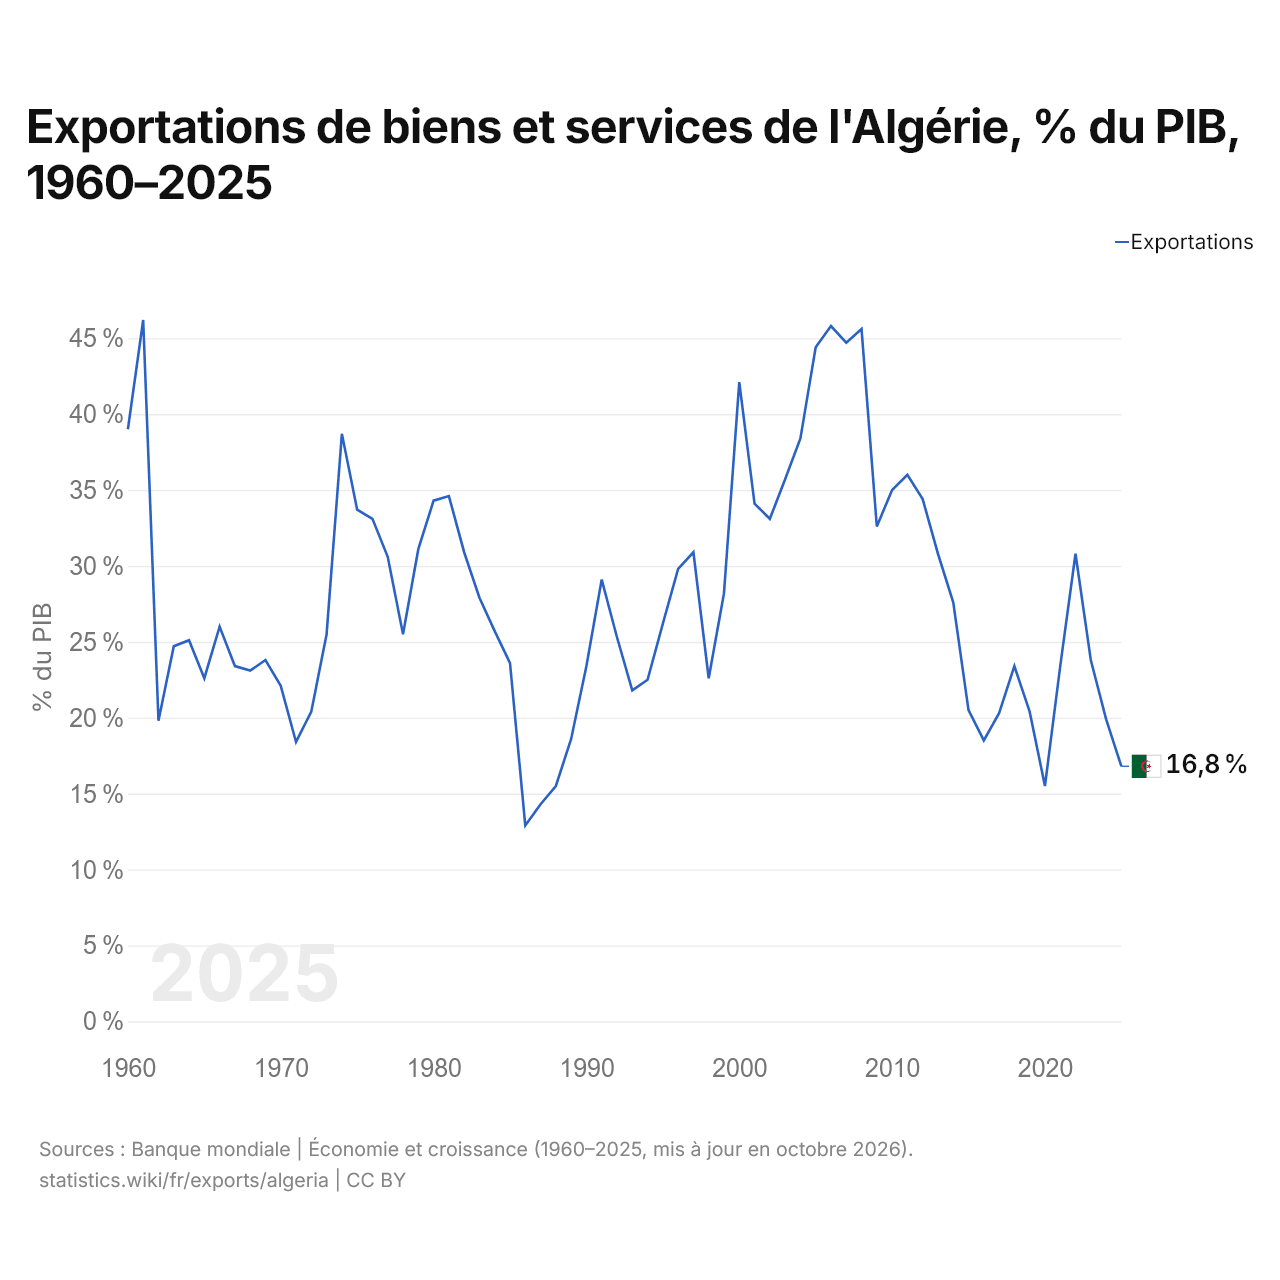
En 2025, les exportations de biens et services de l'Algérie équivalaient à 16,8 % de son PIB, contre 39,0 % en 1960. La part la plus élevée a été de 46,2 %, en 1961.
Comparer les exportations de l'Algérie avec celles d'autres pays
Sources :
- Banque mondiale | Économie et croissance (1960–2025, mis à jour en octobre 2026)
- TradeMap (2001–2024, mis à jour en octobre 2026)
Creative Commons Attribution (CC BY) : vous pouvez copier, partager, adapter et réutiliser ce contenu, y compris à des fins commerciales, à condition de citer statistics.wiki et d’indiquer les modifications apportées. Les sources citées ci-dessus peuvent avoir leurs propres conditions de licence.