
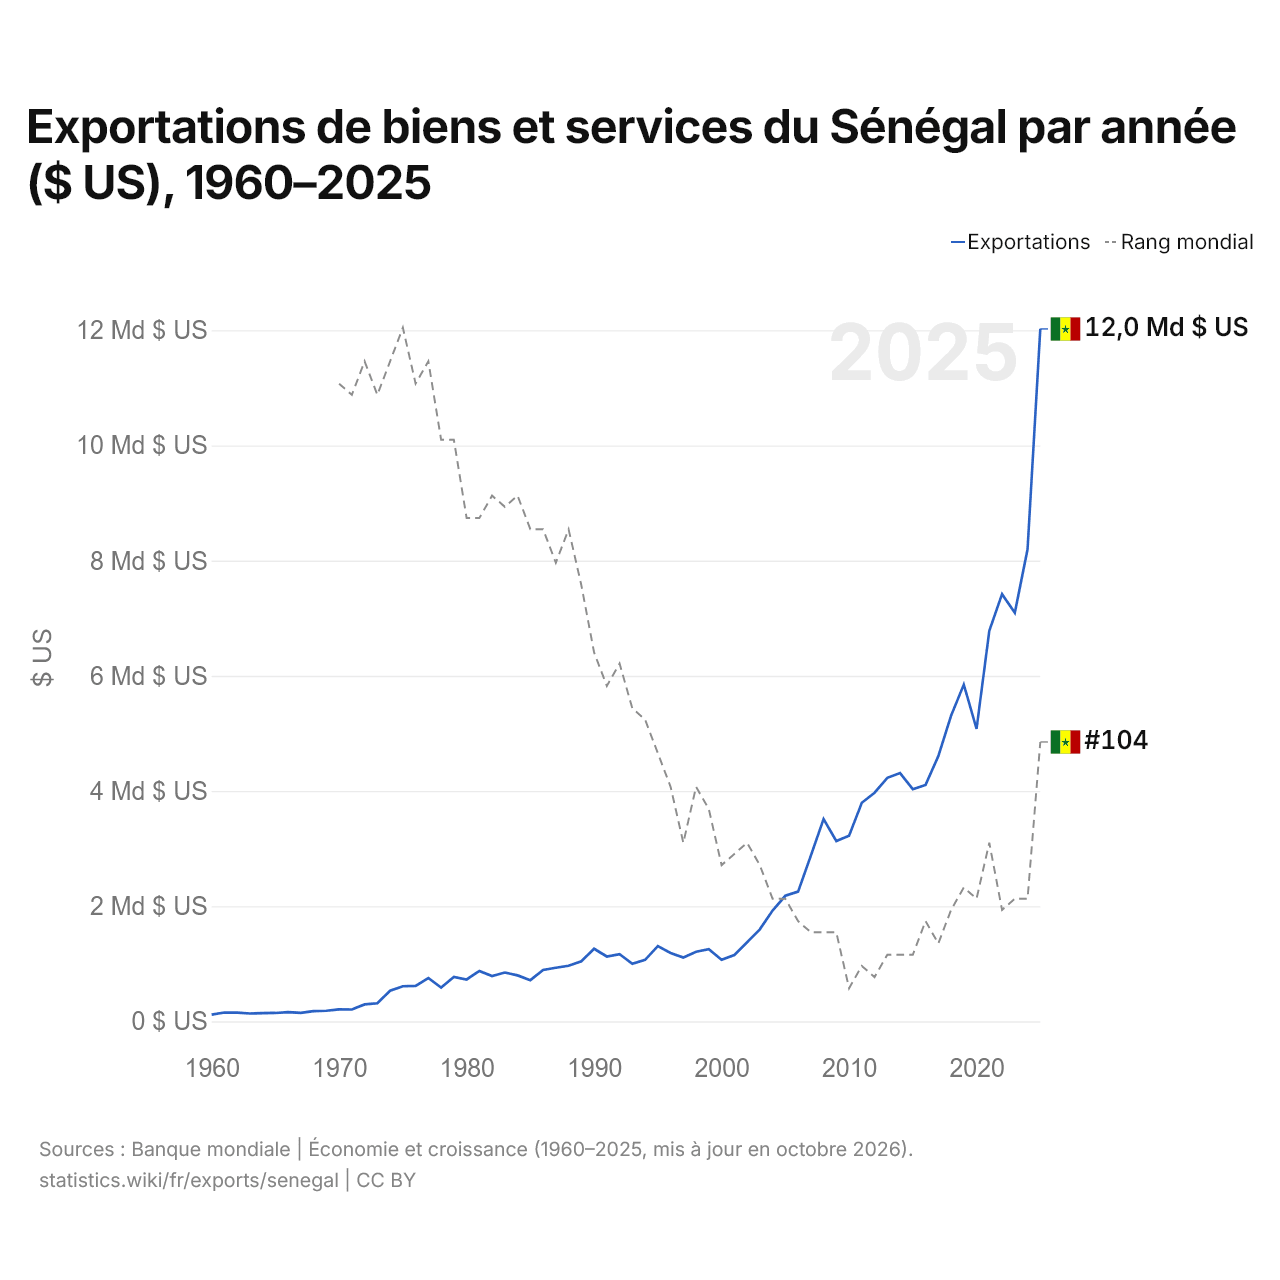
Exportations de biens et services du Sénégal par année ($ US), 1960–2025
| Année | $ US | Rang mondial |
|---|---|---|
| Exportations | Rang mondial | |
| 2025 | 12 022 634 774 $ US | #104 |
| 2024 | 8 197 606 373 $ US | #118 |
| 2023 | 7 092 836 397 $ US | #118 |
| 2022 | 7 417 917 497 $ US | #119 |
| 2021 | 6 781 011 709 $ US | #113 |
| 2020 | 5 077 951 817 $ US | #118 |
| 2019 | 5 847 051 726 $ US | #117 |
| 2018 | 5 305 072 987 $ US | #119 |
| 2017 | 4 604 563 712 $ US | #122 |
| 2016 | 4 105 254 723 $ US | #120 |
| 2015 | 4 030 818 416 $ US | #123 |
| 2014 | 4 311 504 601 $ US | #123 |
| 2013 | 4 228 273 485 $ US | #123 |
| 2012 | 3 969 170 142 $ US | #125 |
| 2011 | 3 795 074 624 $ US | #124 |
| 2010 | 3 221 238 634 $ US | #126 |
| 2009 | 3 131 307 996 $ US | #121 |
| 2008 | 3 513 433 452 $ US | #121 |
| 2007 | 2 876 425 982 $ US | #121 |
| 2006 | 2 252 093 122 $ US | #120 |
| 2005 | 2 180 519 353 $ US | #118 |
| 2004 | 1 924 839 548 $ US | #118 |
| 2003 | 1 597 488 034 $ US | #115 |
| 2002 | 1 374 437 539 $ US | #113 |
| 2001 | 1 151 929 255 $ US | #114 |
| 2000 | 1 068 191 180 $ US | #115 |
| 1999 | 1 252 919 321 $ US | #110 |
| 1998 | 1 209 065 012 $ US | #108 |
| 1997 | 1 107 580 224 $ US | #113 |
| 1996 | 1 186 269 197 $ US | #108 |
| 1995 | 1 306 823 704 $ US | #105 |
| 1994 | 1 068 412 067 $ US | #102 |
| 1993 | 998 657 342 $ US | #101 |
| 1992 | 1 164 623 532 $ US | #97 |
| 1991 | 1 125 698 820 $ US | #99 |
| 1990 | 1 260 610 906 $ US | #96 |
| 1989 | 1 043 007 675 $ US | #90 |
| 1988 | 964 374 937 $ US | #85 |
| 1987 | 929 471 806 $ US | #88 |
| 1986 | 892 982 437 $ US | #85 |
| 1985 | 715 458 892 $ US | #85 |
| 1984 | 797 845 321 $ US | #82 |
| 1983 | 847 007 035 $ US | #83 |
| 1982 | 787 460 425 $ US | #82 |
| 1981 | 874 415 800 $ US | #84 |
| 1980 | 726 560 625 $ US | #84 |
| 1979 | 769 692 159 $ US | #77 |
| 1978 | 586 873 674 $ US | #77 |
| 1977 | 752 595 833 $ US | #70 |
| 1976 | 616 306 341 $ US | #72 |
| 1975 | 609 915 545 $ US | #67 |
| 1974 | 531 016 257 $ US | #70 |
| 1973 | 314 124 736 $ US | #73 |
| 1972 | 293 958 430 $ US | #70 |
| 1971 | 205 321 733 $ US | #73 |
| 1970 | 208 798 743 $ US | #72 |
| 1969 | 183 032 590 $ US | - |
| 1968 | 177 216 109 $ US | - |
| 1967 | 145 983 547 $ US | - |
| 1966 | 158 693 960 $ US | - |
| 1965 | 145 436 128 $ US | - |
| 1964 | 142 348 126 $ US | - |
| 1963 | 135 516 436 $ US | - |
| 1962 | 151 058 846 $ US | - |
| 1961 | 153 701 751 $ US | - |
| 1960 | 115 539 820 $ US | - |
En 2025, les exportations de biens et services du Sénégal s'élevaient à 12 milliards de dollars, contre 116 millions de dollars en 1960. Elles se classaient au 104e rang mondial, en hausse par rapport au 118e rang en 2024. Leur meilleur rang a été le 67e, occupé pour la dernière fois en 1975.
En 2025, les exportations de biens et services du Sénégal étaient les 15es plus élevées de 50 pays situés en Afrique. Les importations de biens et services du Sénégal s'élevaient à 14,3 milliards de dollars en 2025, au 105e rang mondial. En 2025, les importations du Sénégal dépassaient ses exportations de 2,25 milliards de dollars, soit un déficit commercial.
Exportations de biens du Sénégal par catégorie, 2025
Exportations de biens, 2025: 9,97 Md $US
En 2025, la première catégorie des exportations de biens du Sénégal était « pétrole, gaz, minerais et autres matières premières », avec 55,2 %, suivie de « métaux précieux, pierres précieuses, bijoux, montres, instruments de musique et art », avec 16,9 %.
Destinations des exportations de biens du Sénégal : les 10 premières, 2025
| Rang | Pays | Exportations de biens | Part | |
|---|---|---|---|---|
| 1 |
 Mali |
1,60 Md $US | 16,1 % | vs Mali |
| 2 |
 Suisse |
1,12 Md $US | 11,2 % | vs Suisse |
| 3 |
 Pays-Bas |
916 M $US | 9,18 % | |
| 4 |
 Chine |
848 M $US | 8,5 % | |
| 5 |
 Inde |
682 M $US | 6,84 % | |
| 6 |
 Espagne |
648 M $US | 6,5 % | |
| 7 |
 Italie |
625 M $US | 6,26 % | |
| 8 |
 États-Unis |
374 M $US | 3,75 % | |
| 9 |
 Australie |
353 M $US | 3,54 % | |
| 10 |
 Royaume-Uni |
274 M $US | 2,75 % | |
| Autres partenaires et non précisés | 2,53 Md $US | 25,4 % |
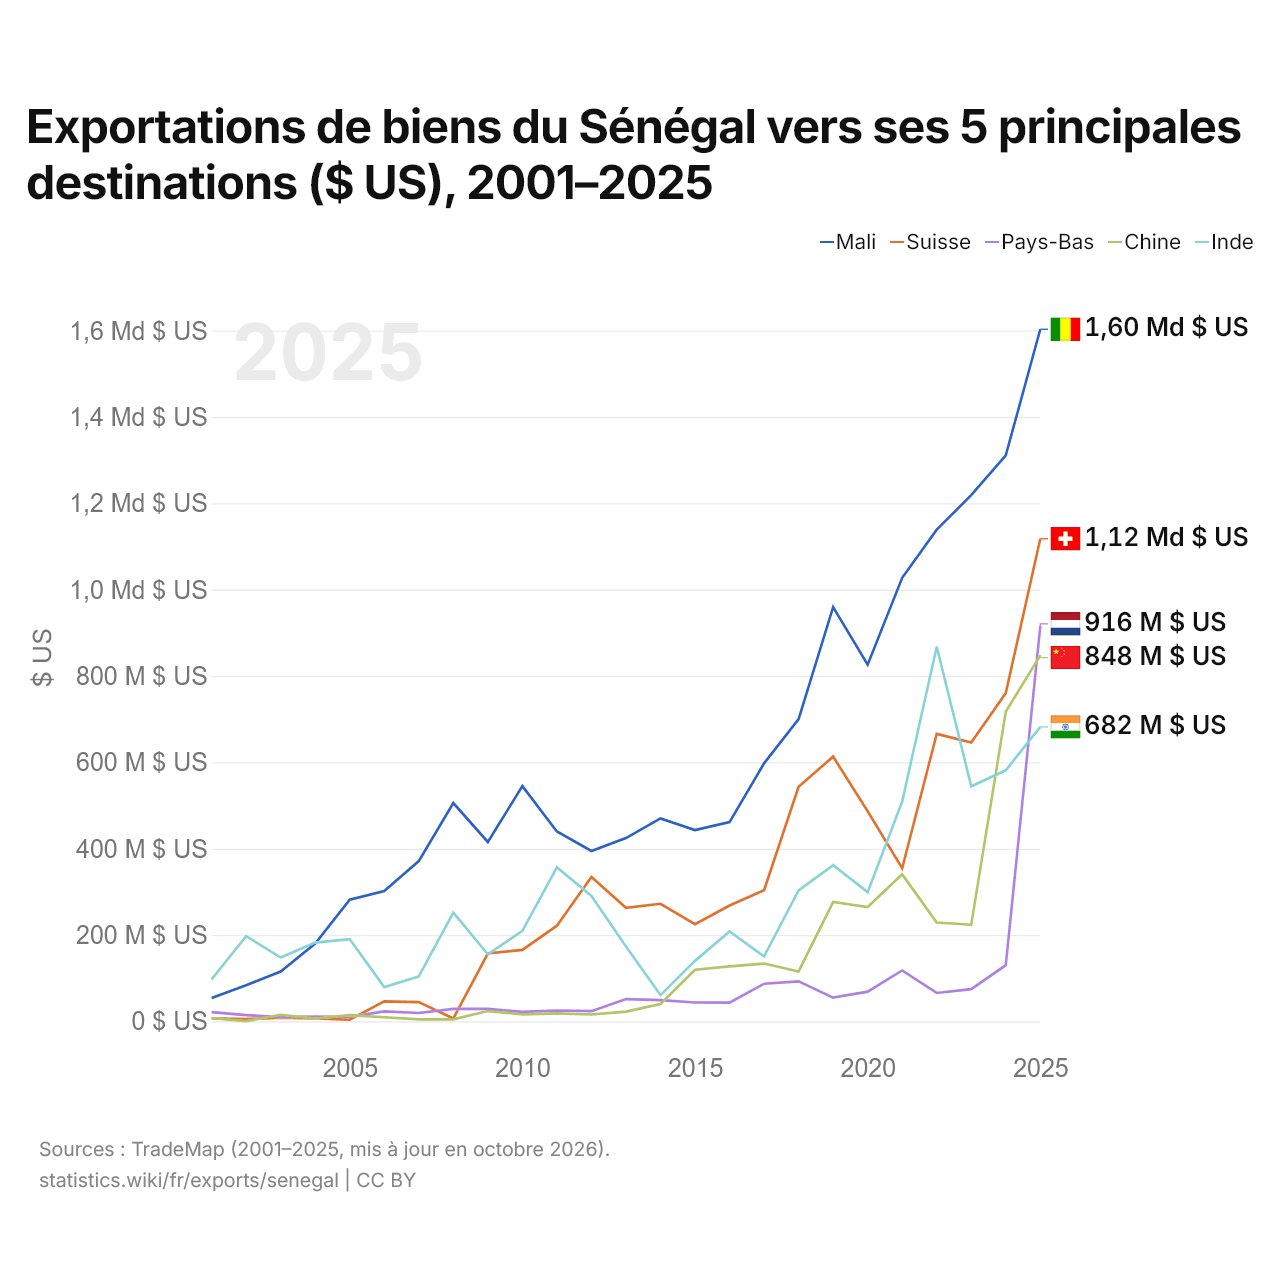
Exportations de biens du Sénégal vers ses 5 principales destinations ($ US), 2001–2025
| Année | $ US | ||||
|---|---|---|---|---|---|
| Mali | Suisse | Pays-Bas | Chine | Inde | |
| 2025 | 1 602 919 000 $ US | 1 117 827 000 $ US | 915 501 000 $ US | 847 602 000 $ US | 681 948 000 $ US |
| 2024 | 1 310 707 000 $ US | 760 181 000 $ US | 130 094 000 $ US | 716 867 000 $ US | 581 366 000 $ US |
| 2023 | 1 218 695 000 $ US | 645 697 000 $ US | 74 573 000 $ US | 223 770 000 $ US | 544 373 000 $ US |
| 2022 | 1 138 796 000 $ US | 665 866 000 $ US | 65 724 000 $ US | 228 745 000 $ US | 867 739 000 $ US |
| 2021 | 1 027 273 000 $ US | 354 383 000 $ US | 117 859 000 $ US | 340 440 000 $ US | 509 129 000 $ US |
| 2020 | 826 131 000 $ US | 486 479 000 $ US | 68 813 000 $ US | 264 722 000 $ US | 299 223 000 $ US |
| 2019 | 959 429 000 $ US | 613 135 000 $ US | 54 863 000 $ US | 276 314 000 $ US | 361 686 000 $ US |
| 2018 | 700 114 000 $ US | 543 103 000 $ US | 92 680 000 $ US | 115 573 000 $ US | 303 225 000 $ US |
| 2017 | 597 522 000 $ US | 303 745 000 $ US | 87 191 000 $ US | 133 810 000 $ US | 150 366 000 $ US |
| 2016 | 461 336 000 $ US | 268 398 000 $ US | 43 462 000 $ US | 127 230 000 $ US | 208 086 000 $ US |
| 2015 | 443 151 000 $ US | 225 045 000 $ US | 43 661 000 $ US | 119 626 000 $ US | 140 040 000 $ US |
| 2014 | 469 989 000 $ US | 272 269 000 $ US | 49 258 000 $ US | 40 002 000 $ US | 60 770 000 $ US |
| 2013 | 424 432 000 $ US | 263 070 000 $ US | 51 614 000 $ US | 22 429 000 $ US | 173 372 000 $ US |
| 2012 | 394 428 000 $ US | 334 153 000 $ US | 23 494 000 $ US | 15 820 000 $ US | 290 606 000 $ US |
| 2011 | 439 571 000 $ US | 221 476 000 $ US | 25 055 000 $ US | 18 603 000 $ US | 356 601 000 $ US |
| 2010 | 544 845 000 $ US | 165 454 000 $ US | 22 085 000 $ US | 16 142 000 $ US | 209 480 000 $ US |
| 2009 | 415 317 000 $ US | 157 145 000 $ US | 28 941 000 $ US | 23 791 000 $ US | 155 203 000 $ US |
| 2008 | 505 532 000 $ US | 6 519 000 $ US | 28 885 000 $ US | 4 716 000 $ US | 251 981 000 $ US |
| 2007 | 371 031 000 $ US | 44 565 000 $ US | 19 228 000 $ US | 4 529 000 $ US | 103 958 000 $ US |
| 2006 | 301 812 000 $ US | 46 354 000 $ US | 22 980 000 $ US | 9 512 000 $ US | 79 189 000 $ US |
| 2005 | 281 801 000 $ US | 3 621 000 $ US | 10 529 000 $ US | 14 474 000 $ US | 190 181 000 $ US |
| 2004 | 180 058 000 $ US | 6 710 000 $ US | 11 272 000 $ US | 6 389 000 $ US | 182 454 000 $ US |
| 2003 | 115 260 000 $ US | 8 602 000 $ US | 9 820 000 $ US | 15 310 000 $ US | 147 616 000 $ US |
| 2002 | 83 790 000 $ US | 5 077 000 $ US | 14 434 000 $ US | 555 000 $ US | 197 390 000 $ US |
| 2001 | 54 222 000 $ US | 6 793 000 $ US | 21 277 000 $ US | 7 499 000 $ US | 97 163 000 $ US |
En 2025, les exportations de biens s'élevaient à 1,6 milliard de dollars vers le Mali, 1,12 milliard de dollars vers la Suisse, 916 millions de dollars vers les Pays-Bas, 848 millions de dollars vers la Chine et 682 millions de dollars vers l'Inde. Le premier rang des cinq destinations du Sénégal est occupé par le Mali depuis 2005. Le changement le plus récent dans leur ordre remonte à 2025, quand les exportations du Sénégal vers les Pays-Bas ont dépassé celles vers la Chine.
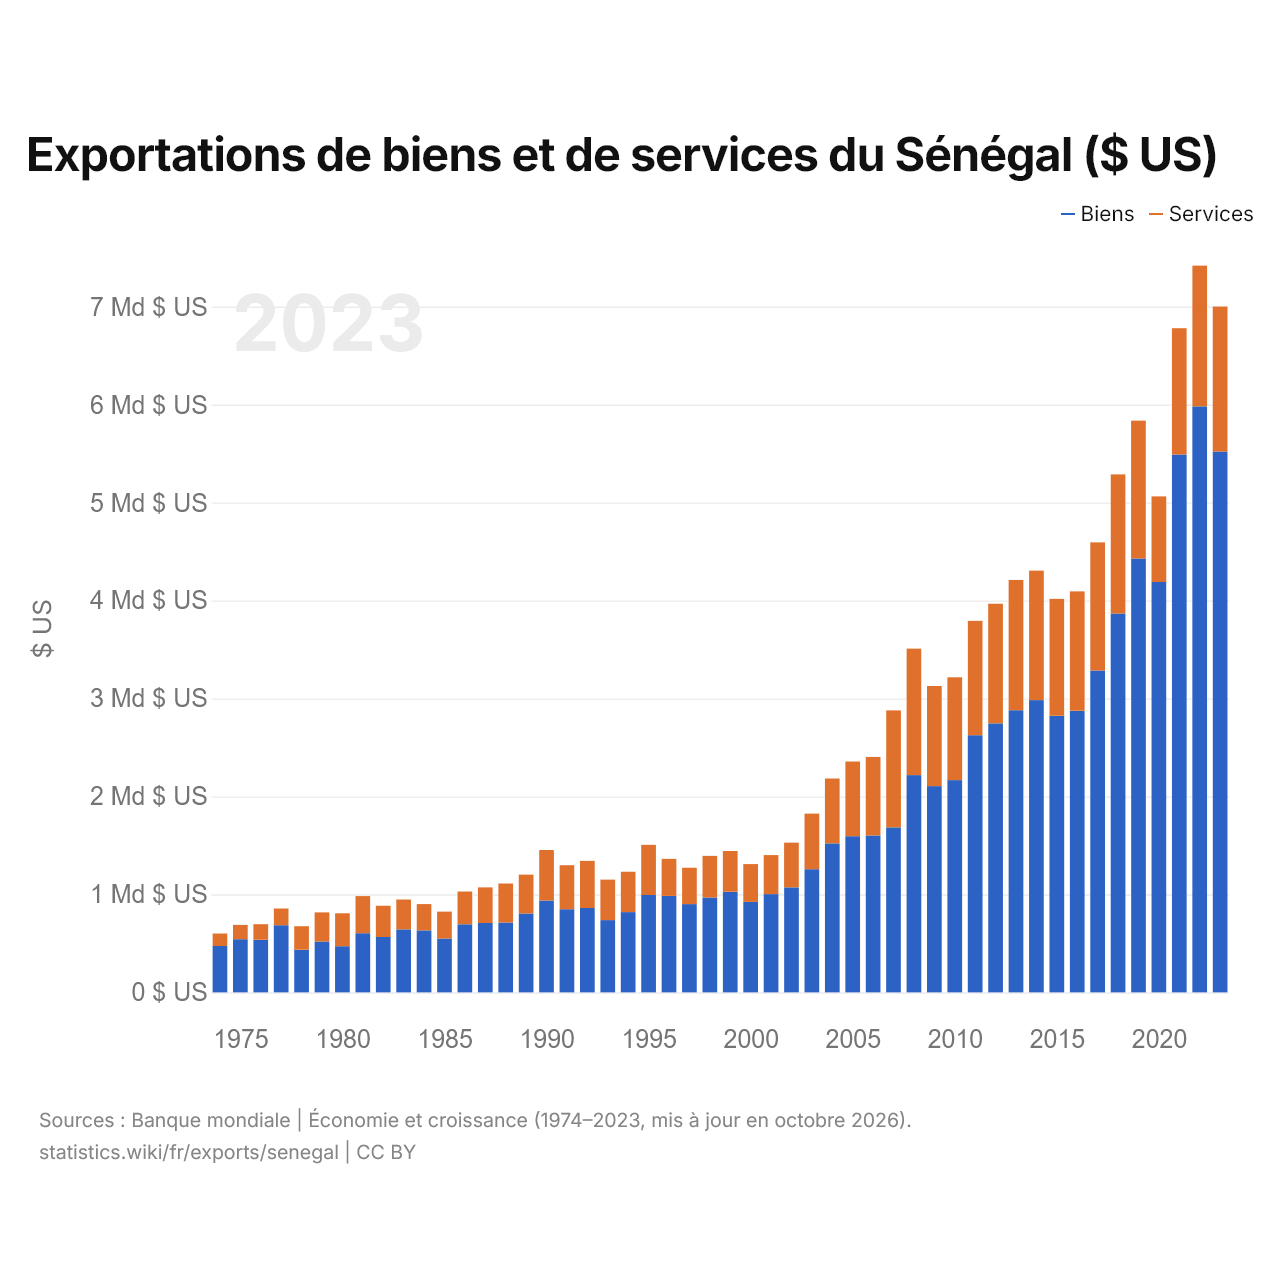
Exportations de biens et de services du Sénégal ($ US)
| Année | $ US | |
|---|---|---|
| Biens | Services | |
| 2023 | 5 520 414 704 $ US | 1 480 427 185 $ US |
| 2022 | 5 981 874 795 $ US | 1 436 042 939 $ US |
| 2021 | 5 490 564 409 $ US | 1 288 979 886 $ US |
| 2020 | 4 188 513 934 $ US | 874 241 722 $ US |
| 2019 | 4 428 041 980 $ US | 1 407 606 448 $ US |
| 2018 | 3 866 092 163 $ US | 1 420 945 598 $ US |
| 2017 | 3 285 684 204 $ US | 1 307 594 720 $ US |
| 2016 | 2 874 563 718 $ US | 1 218 606 914 $ US |
| 2015 | 2 823 307 634 $ US | 1 193 644 176 $ US |
| 2014 | 2 982 723 255 $ US | 1 322 489 633 $ US |
| 2013 | 2 880 115 759 $ US | 1 329 434 946 $ US |
| 2012 | 2 745 985 143 $ US | 1 221 128 685 $ US |
| 2011 | 2 624 466 009 $ US | 1 168 266 346 $ US |
| 2010 | 2 166 456 004 $ US | 1 049 284 601 $ US |
| 2009 | 2 105 302 670 $ US | 1 021 830 151 $ US |
| 2008 | 2 217 286 790 $ US | 1 290 784 633 $ US |
| 2007 | 1 683 730 103 $ US | 1 193 961 014 $ US |
| 2006 | 1 601 223 141 $ US | 801 683 493 $ US |
| 2005 | 1 593 583 070 $ US | 762 074 210 $ US |
| 2004 | 1 520 347 388 $ US | 662 288 662 $ US |
| 2003 | 1 256 582 760 $ US | 567 972 861 $ US |
| 2002 | 1 071 902 584 $ US | 456 063 093 $ US |
| 2001 | 1 002 915 502 $ US | 398 403 767 $ US |
| 2000 | 923 297 148 $ US | 386 210 813 $ US |
| 1999 | 1 026 743 076 $ US | 416 063 507 $ US |
| 1998 | 967 420 092 $ US | 425 227 978 $ US |
| 1997 | 900 585 203 $ US | 371 196 452 $ US |
| 1996 | 984 217 785 $ US | 378 279 896 $ US |
| 1995 | 993 311 757 $ US | 512 492 851 $ US |
| 1994 | 818 779 098 $ US | 412 334 409 $ US |
| 1993 | 736 820 523 $ US | 413 896 498 $ US |
| 1992 | 860 623 561 $ US | 481 390 053 $ US |
| 1991 | 848 543 558 $ US | 448 624 249 $ US |
| 1990 | 937 910 488 $ US | 514 756 245 $ US |
| 1989 | 804 148 357 $ US | 397 732 599 $ US |
| 1988 | 713 182 039 $ US | 398 088 666 $ US |
| 1987 | 707 501 271 $ US | 363 553 104 $ US |
| 1986 | 694 530 464 $ US | 334 473 074 $ US |
| 1985 | 548 075 449 $ US | 276 296 980 $ US |
| 1984 | 632 534 120 $ US | 268 379 016 $ US |
| 1983 | 642 119 677 $ US | 306 009 954 $ US |
| 1982 | 564 535 819 $ US | 319 713 941 $ US |
| 1981 | 603 426 650 $ US | 379 602 726 $ US |
| 1980 | 470 182 739 $ US | 336 710 288 $ US |
| 1979 | 517 577 797 $ US | 298 606 191 $ US |
| 1978 | 434 732 782 $ US | 240 410 331 $ US |
| 1977 | 685 323 245 $ US | 169 936 720 $ US |
| 1976 | 536 512 805 $ US | 159 489 103 $ US |
| 1975 | 542 571 165 $ US | 145 581 530 $ US |
| 1974 | 472 612 356 $ US | 127 292 920 $ US |
Les exportations de biens du Sénégal s'élèvent à 5,52 milliards de dollars (2023) et celles de services à 1,48 milliard de dollars ; les services représentent 21,1 % du total, contre 21,2 % en 1974.
Le Sénégal dans le classement mondial des exportations, 2025







Exportations de biens et services du Sénégal, % du PIB, 1960–2025
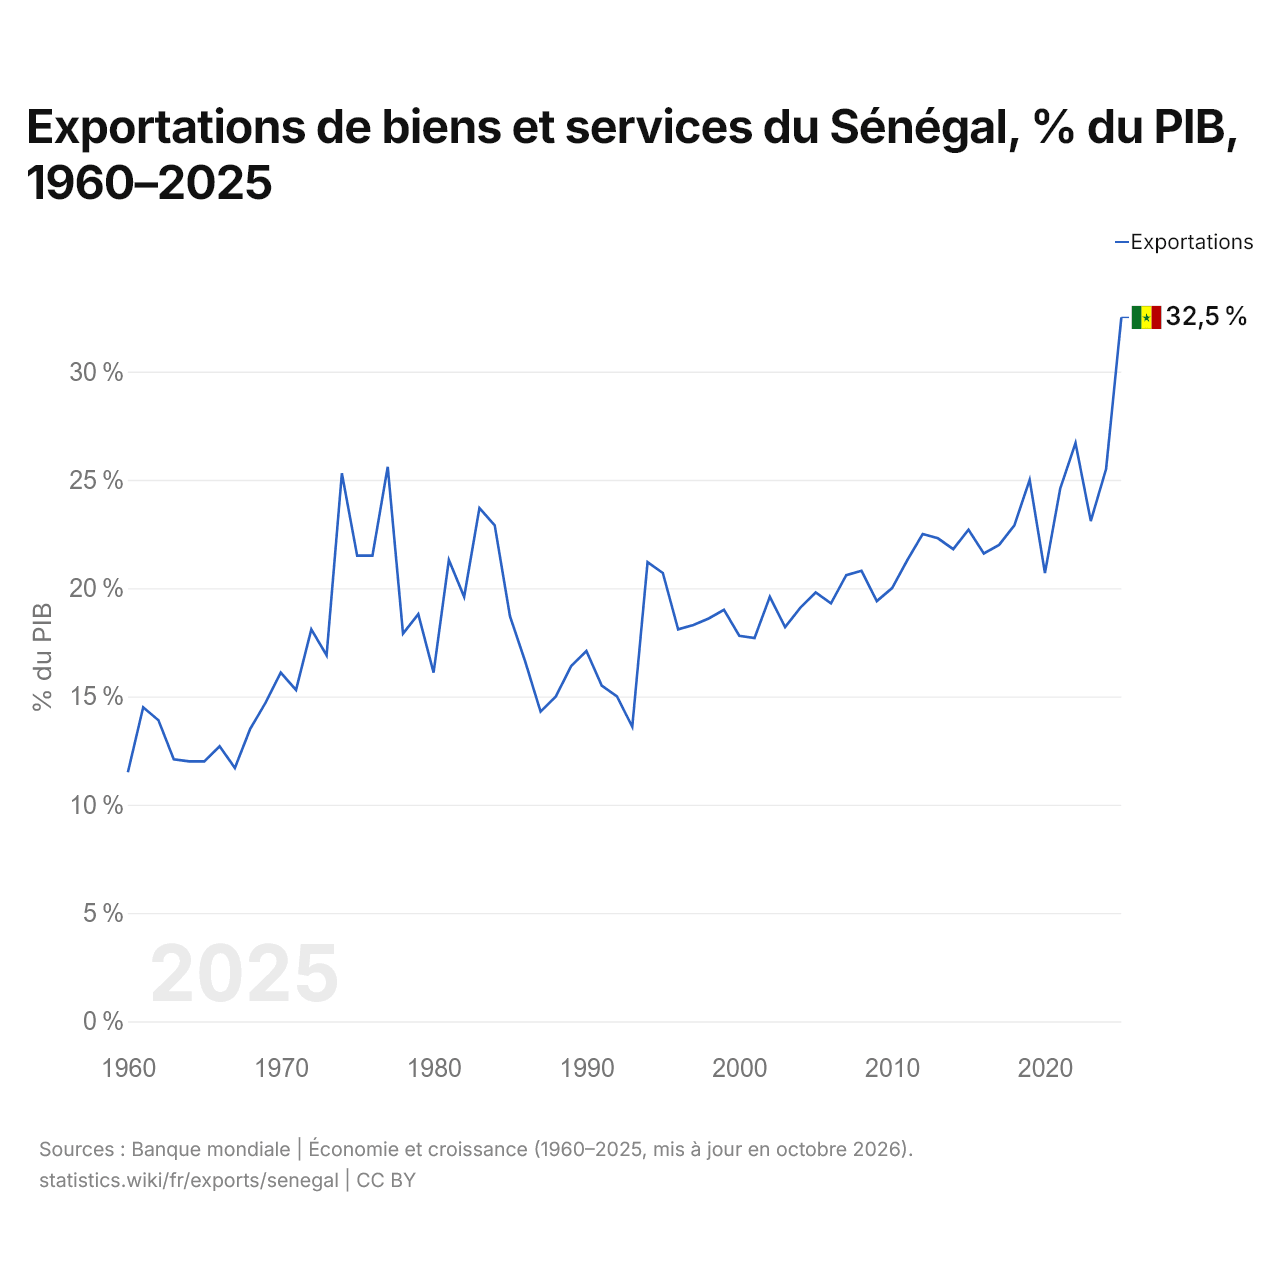
En 2025, les exportations de biens et services du Sénégal équivalaient à 32,5 % de son PIB, contre 11,5 % en 1960.
Comparer les exportations du Sénégal avec celles d'autres pays
Sources :
- Banque mondiale | Économie et croissance (1960–2025, mis à jour en octobre 2026)
- TradeMap (2001–2025, mis à jour en octobre 2026)
Creative Commons Attribution (CC BY) : vous pouvez copier, partager, adapter et réutiliser ce contenu, y compris à des fins commerciales, à condition de citer statistics.wiki et d’indiquer les modifications apportées. Les sources citées ci-dessus peuvent avoir leurs propres conditions de licence.