
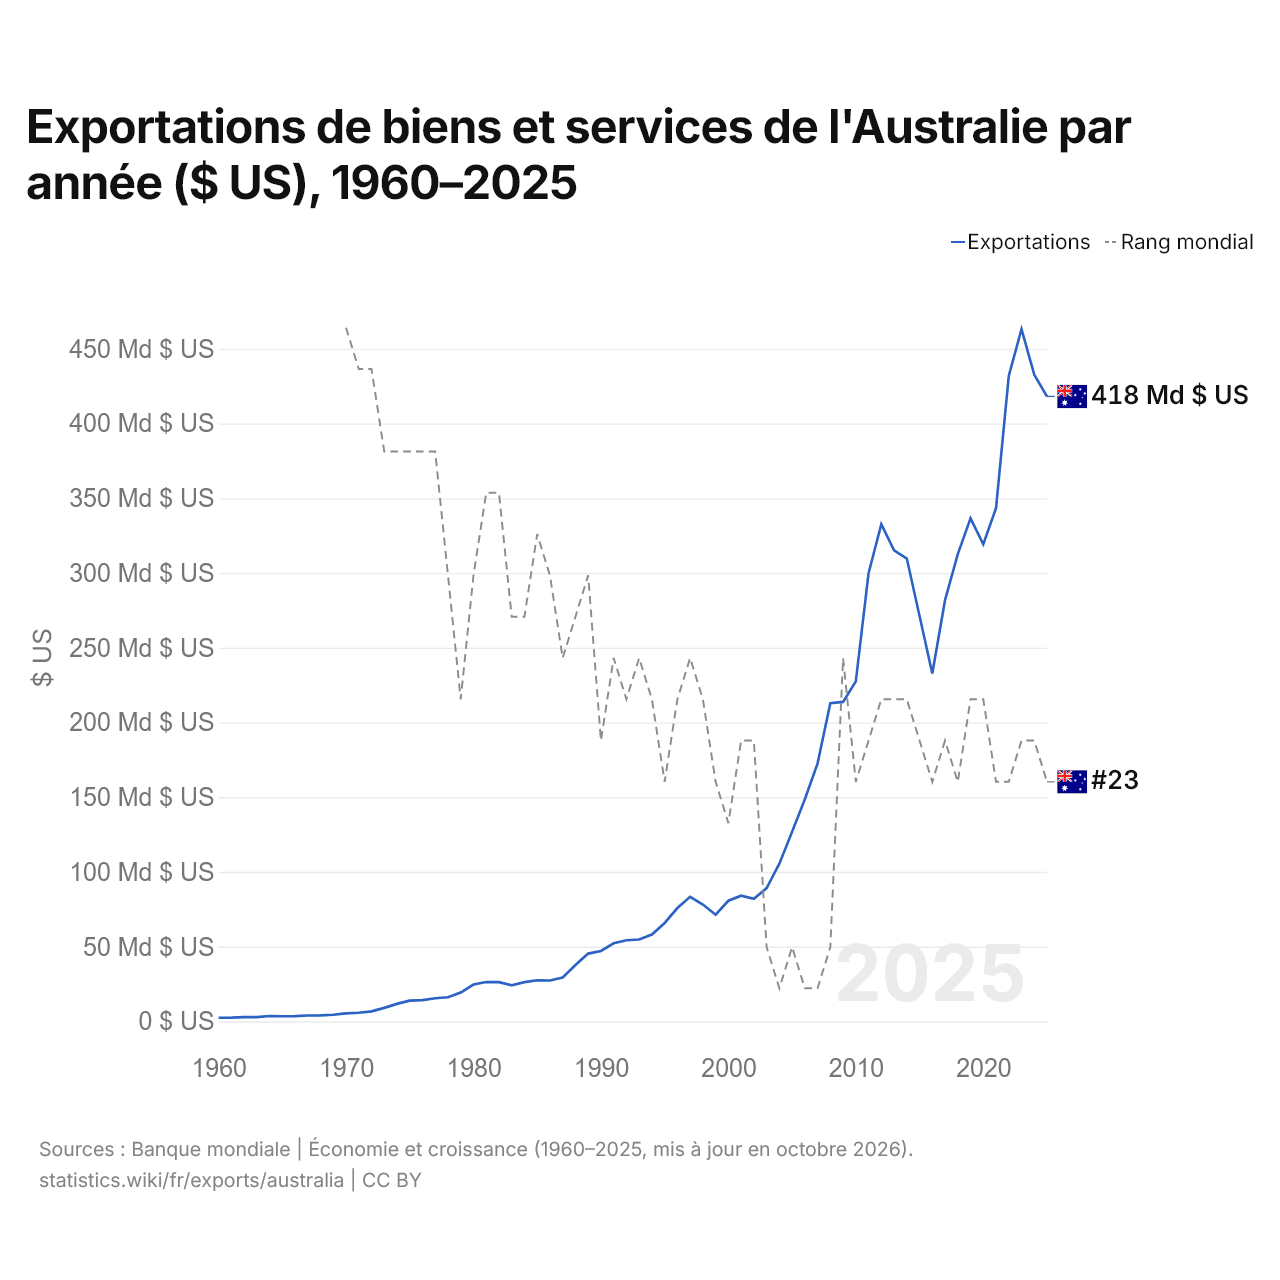
Exportations de biens et services de l'Australie par année ($ US), 1960–2025
| Année | $ US | Rang mondial |
|---|---|---|
| Exportations | Rang mondial | |
| 2025 | 418 055 624 771 $ US | #23 |
| 2024 | 432 605 705 549 $ US | #22 |
| 2023 | 463 117 015 978 $ US | #22 |
| 2022 | 431 732 710 876 $ US | #23 |
| 2021 | 343 364 164 706 $ US | #23 |
| 2020 | 319 174 580 744 $ US | #21 |
| 2019 | 336 477 593 836 $ US | #21 |
| 2018 | 312 605 804 111 $ US | #23 |
| 2017 | 281 774 035 050 $ US | #22 |
| 2016 | 232 663 011 513 $ US | #23 |
| 2015 | 271 152 836 561 $ US | #22 |
| 2014 | 309 621 975 145 $ US | #21 |
| 2013 | 315 055 128 030 $ US | #21 |
| 2012 | 332 613 569 103 $ US | #21 |
| 2011 | 299 823 615 768 $ US | #22 |
| 2010 | 227 427 026 265 $ US | #23 |
| 2009 | 213 717 313 260 $ US | #20 |
| 2008 | 212 794 797 279 $ US | #27 |
| 2007 | 172 570 464 003 $ US | #28 |
| 2006 | 148 587 374 345 $ US | #28 |
| 2005 | 126 785 667 302 $ US | #27 |
| 2004 | 105 490 823 730 $ US | #28 |
| 2003 | 89 138 031 450 $ US | #27 |
| 2002 | 82 033 782 310 $ US | #22 |
| 2001 | 84 096 722 017 $ US | #22 |
| 2000 | 80 695 888 525 $ US | #24 |
| 1999 | 71 285 875 423 $ US | #23 |
| 1998 | 78 166 587 533 $ US | #21 |
| 1997 | 83 327 463 879 $ US | #20 |
| 1996 | 75 814 054 769 $ US | #21 |
| 1995 | 65 793 733 294 $ US | #23 |
| 1994 | 58 015 219 647 $ US | #21 |
| 1993 | 54 747 048 904 $ US | #20 |
| 1992 | 54 226 800 318 $ US | #21 |
| 1991 | 52 248 569 798 $ US | #20 |
| 1990 | 47 071 479 854 $ US | #22 |
| 1989 | 45 333 960 857 $ US | #18 |
| 1988 | 37 674 402 361 $ US | #19 |
| 1987 | 29 290 629 963 $ US | #20 |
| 1986 | 27 321 628 428 $ US | #18 |
| 1985 | 27 497 313 397 $ US | #17 |
| 1984 | 26 235 903 975 $ US | #19 |
| 1983 | 24 060 337 550 $ US | #19 |
| 1982 | 26 231 932 031 $ US | #16 |
| 1981 | 26 334 610 473 $ US | #16 |
| 1980 | 24 616 155 989 $ US | #18 |
| 1979 | 19 275 247 075 $ US | #21 |
| 1978 | 16 122 883 554 $ US | #18 |
| 1977 | 15 449 644 414 $ US | #15 |
| 1976 | 14 184 298 827 $ US | #15 |
| 1975 | 13 874 095 316 $ US | #15 |
| 1974 | 11 680 176 861 $ US | #15 |
| 1973 | 9 019 859 065 $ US | #15 |
| 1972 | 6 663 551 402 $ US | #13 |
| 1971 | 5 715 360 914 $ US | #13 |
| 1970 | 5 354 720 857 $ US | #12 |
| 1969 | 4 378 080 700 $ US | - |
| 1968 | 4 016 320 643 $ US | - |
| 1967 | 3 915 520 626 $ US | - |
| 1966 | 3 525 760 564 $ US | - |
| 1965 | 3 428 320 549 $ US | - |
| 1964 | 3 549 280 568 $ US | - |
| 1963 | 2 796 640 447 $ US | - |
| 1962 | 2 773 120 444 $ US | - |
| 1961 | 2 437 120 390 $ US | - |
| 1960 | 2 413 600 386 $ US | - |
En 2025, les exportations de biens et services de l'Australie s'élevaient à 418 milliards de dollars, contre 2,41 milliards de dollars en 1960. Le maximum a été de 463 milliards de dollars, en 2023. Elles se classaient au 23e rang mondial, en baisse par rapport au 22e rang en 2024. Leur meilleur rang a été le 12e, occupé pour la dernière fois en 1970.
En 2025, les exportations de biens et services de l'Australie étaient les plus élevées de 12 pays situés en Océanie. Les importations de biens et services de l'Australie s'élevaient à 407 milliards de dollars en 2025, au 22e rang mondial. En 2025, les exportations de l'Australie dépassaient ses importations de 10,6 milliards de dollars, soit un excédent commercial.
Exportations de biens de l'Australie par catégorie, 2025
Exportations de biens, 2025: 344 Md $US
En 2025, la première catégorie des exportations de biens de l'Australie était « pétrole, gaz, minerais et autres matières premières », avec 58,3 %, suivie de « métaux précieux, pierres précieuses, bijoux, montres, instruments de musique et art », avec 12,1 %.
Destinations des exportations de biens de l'Australie : les 10 premières, 2025
| Rang | Pays | Exportations de biens | Part | |
|---|---|---|---|---|
| 1 |
 Chine |
103 Md $US | 30 % | vs Chine |
| 2 |
 Japon |
26,2 Md $US | 7,64 % | vs Japon |
| 3 |
 États-Unis |
25,6 Md $US | 7,46 % | vs USA |
| 4 |
 Corée du Sud |
20,1 Md $US | 5,86 % | vs Corée du Sud |
| 5 |
 Royaume-Uni |
13,9 Md $US | 4,05 % | vs R.-U. |
| 6 |
 Inde |
13,7 Md $US | 4 % | vs Inde |
| 7 |
 Nouvelle-Zélande |
8,55 Md $US | 2,49 % | vs Nouvelle-Zélande |
| 8 |
 Indonésie |
7,48 Md $US | 2,18 % | vs Indonésie |
| 9 |
 Vietnam |
6,65 Md $US | 1,94 % | vs Vietnam |
| 10 |
 Singapour |
5,93 Md $US | 1,73 % | |
| Autres partenaires et non précisés | 112 Md $US | 32,6 % |
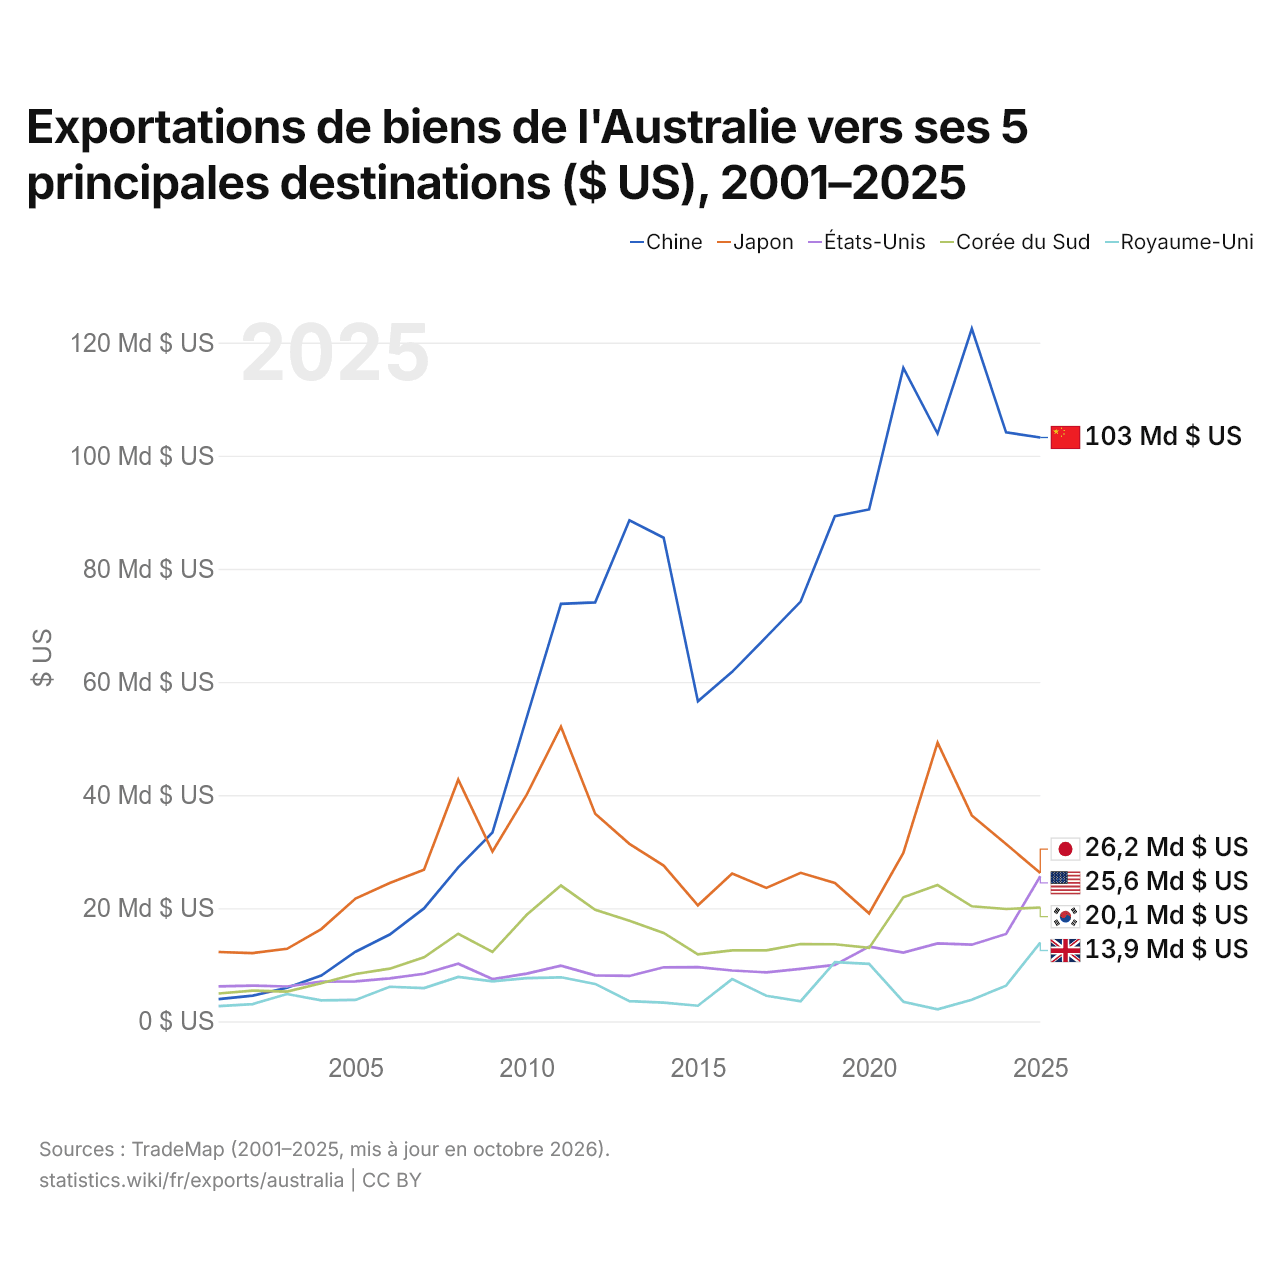
Exportations de biens de l'Australie vers ses 5 principales destinations ($ US), 2001–2025
| Année | $ US | ||||
|---|---|---|---|---|---|
| Chine | Japon | États-Unis | Corée du Sud | Royaume-Uni | |
| 2025 | 103 223 427 000 $ US | 26 240 938 000 $ US | 25 645 730 000 $ US | 20 129 876 000 $ US | 13 931 896 000 $ US |
| 2024 | 104 138 158 000 $ US | 31 342 929 000 $ US | 15 449 343 000 $ US | 19 856 694 000 $ US | 6 311 007 000 $ US |
| 2023 | 122 459 628 000 $ US | 36 405 133 000 $ US | 13 555 158 000 $ US | 20 339 350 000 $ US | 3 807 396 000 $ US |
| 2022 | 103 920 337 000 $ US | 49 272 456 000 $ US | 13 772 502 000 $ US | 24 098 455 000 $ US | 2 118 689 000 $ US |
| 2021 | 115 535 934 000 $ US | 29 776 841 000 $ US | 12 164 966 000 $ US | 21 924 841 000 $ US | 3 459 784 000 $ US |
| 2020 | 90 502 920 000 $ US | 19 092 549 000 $ US | 13 210 937 000 $ US | 12 981 797 000 $ US | 10 168 716 000 $ US |
| 2019 | 89 293 723 000 $ US | 24 449 585 000 $ US | 9 972 768 000 $ US | 13 634 598 000 $ US | 10 469 524 000 $ US |
| 2018 | 74 213 035 000 $ US | 26 254 707 000 $ US | 9 285 137 000 $ US | 13 664 818 000 $ US | 3 548 011 000 $ US |
| 2017 | 67 978 379 000 $ US | 23 588 895 000 $ US | 8 649 374 000 $ US | 12 534 907 000 $ US | 4 517 784 000 $ US |
| 2016 | 61 786 054 000 $ US | 26 126 547 000 $ US | 8 987 814 000 $ US | 12 532 702 000 $ US | 7 461 559 000 $ US |
| 2015 | 56 591 742 000 $ US | 20 513 321 000 $ US | 9 578 448 000 $ US | 11 832 343 000 $ US | 2 760 701 000 $ US |
| 2014 | 85 491 901 000 $ US | 27 530 319 000 $ US | 9 553 113 000 $ US | 15 636 701 000 $ US | 3 300 601 000 $ US |
| 2013 | 88 576 822 000 $ US | 31 380 575 000 $ US | 8 025 729 000 $ US | 17 796 231 000 $ US | 3 560 539 000 $ US |
| 2012 | 74 070 143 000 $ US | 36 704 497 000 $ US | 8 121 395 000 $ US | 19 709 157 000 $ US | 6 617 517 000 $ US |
| 2011 | 73 804 137 000 $ US | 52 088 076 000 $ US | 9 844 791 000 $ US | 24 008 837 000 $ US | 7 784 569 000 $ US |
| 2010 | 53 740 403 000 $ US | 40 088 027 000 $ US | 8 430 741 000 $ US | 18 829 448 000 $ US | 7 638 634 000 $ US |
| 2009 | 33 389 244 000 $ US | 30 014 166 000 $ US | 7 467 441 000 $ US | 12 281 989 000 $ US | 7 076 845 000 $ US |
| 2008 | 27 225 182 000 $ US | 42 731 585 000 $ US | 10 184 268 000 $ US | 15 485 802 000 $ US | 7 844 216 000 $ US |
| 2007 | 19 967 514 000 $ US | 26 801 196 000 $ US | 8 417 110 000 $ US | 11 306 985 000 $ US | 5 883 783 000 $ US |
| 2006 | 15 356 473 000 $ US | 24 446 820 000 $ US | 7 583 157 000 $ US | 9 310 297 000 $ US | 6 114 960 000 $ US |
| 2005 | 12 302 482 000 $ US | 21 703 964 000 $ US | 7 069 127 000 $ US | 8 359 627 000 $ US | 3 788 421 000 $ US |
| 2004 | 8 094 988 000 $ US | 16 314 189 000 $ US | 7 009 495 000 $ US | 6 740 744 000 $ US | 3 713 921 000 $ US |
| 2003 | 5 922 091 000 $ US | 12 820 287 000 $ US | 6 158 398 000 $ US | 5 267 086 000 $ US | 4 822 895 000 $ US |
| 2002 | 4 557 231 000 $ US | 12 064 746 000 $ US | 6 308 652 000 $ US | 5 431 902 000 $ US | 3 051 556 000 $ US |
| 2001 | 3 917 959 000 $ US | 12 255 377 000 $ US | 6 170 683 000 $ US | 4 925 112 000 $ US | 2 685 677 000 $ US |
En 2025, les exportations de biens s'élevaient à 103 milliards de dollars vers la Chine, 26,2 milliards de dollars vers le Japon, 25,6 milliards de dollars vers les États-Unis, 20,1 milliards de dollars vers la Corée du Sud et 13,9 milliards de dollars vers le Royaume-Uni. Le premier rang des cinq destinations de l'Australie est occupé par la Chine depuis 2009. Le changement le plus récent dans leur ordre remonte à 2025, quand les exportations de l'Australie vers les États-Unis ont dépassé celles vers la Corée du Sud.
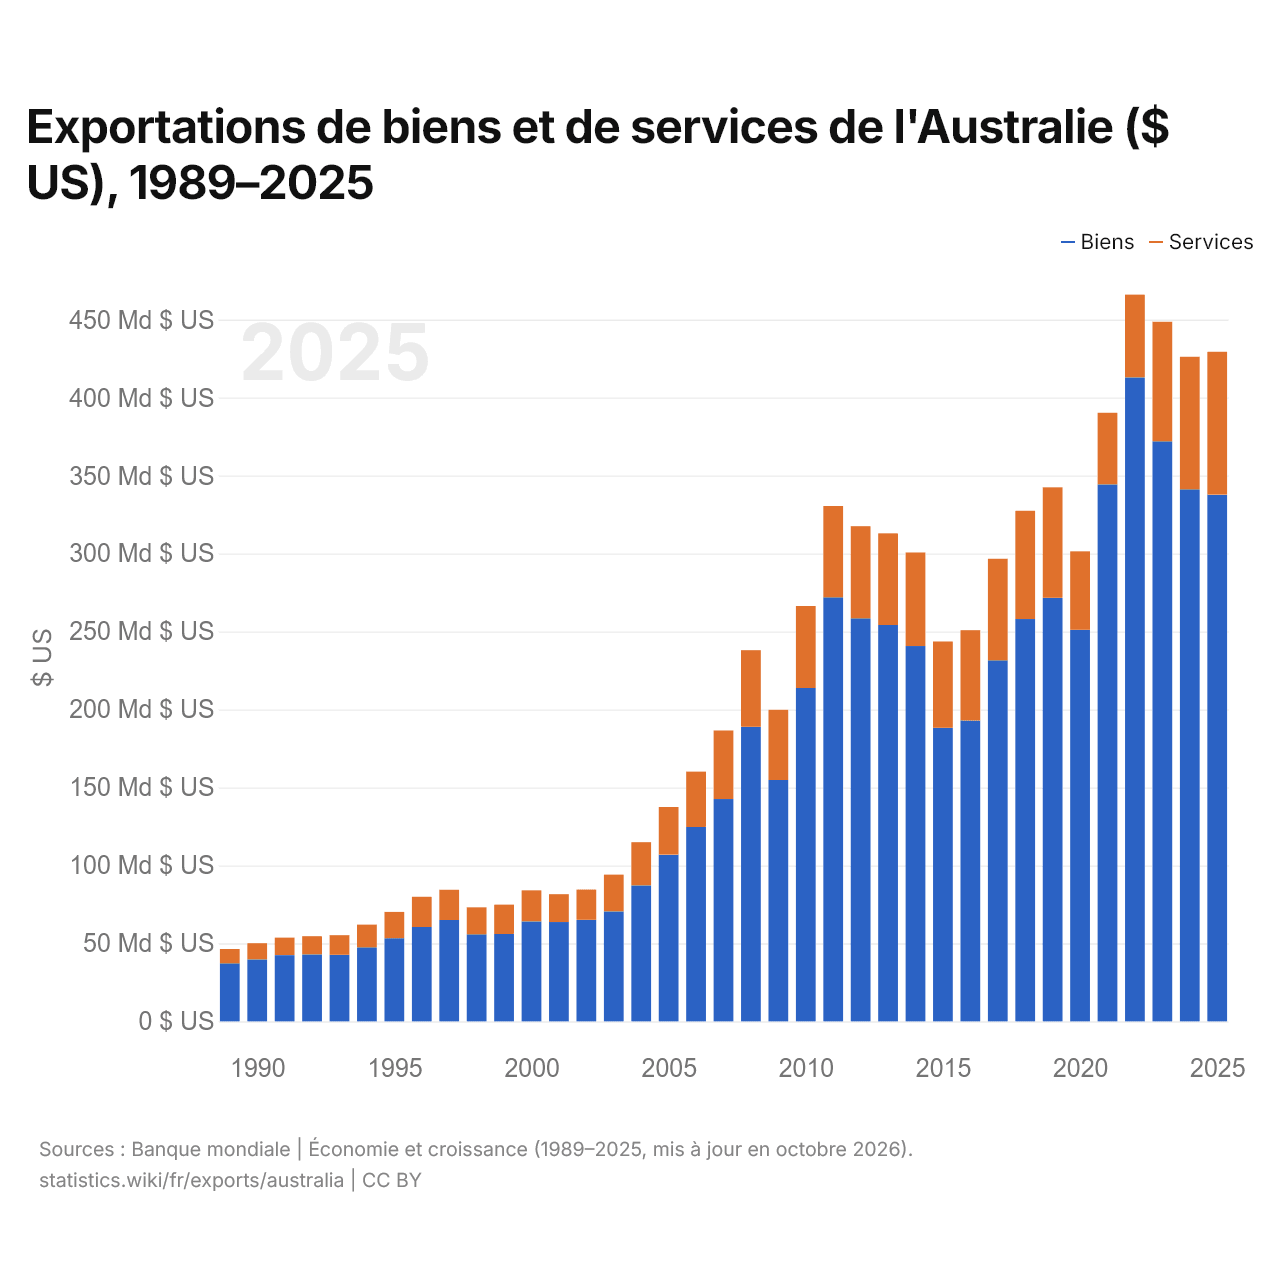
Exportations de biens et de services de l'Australie ($ US), 1989–2025
| Année | $ US | |
|---|---|---|
| Biens | Services | |
| 2025 | 337 734 902 306 $ US | 91 591 916 759 $ US |
| 2024 | 341 126 570 981 $ US | 85 052 885 323 $ US |
| 2023 | 371 938 847 152 $ US | 76 671 102 330 $ US |
| 2022 | 412 861 526 404 $ US | 53 101 301 315 $ US |
| 2021 | 344 278 468 366 $ US | 45 907 449 260 $ US |
| 2020 | 251 052 261 633 $ US | 50 301 958 668 $ US |
| 2019 | 271 565 457 146 $ US | 70 871 751 720 $ US |
| 2018 | 257 957 671 512 $ US | 69 388 949 449 $ US |
| 2017 | 231 536 493 449 $ US | 65 067 545 802 $ US |
| 2016 | 192 876 229 206 $ US | 57 956 689 999 $ US |
| 2015 | 188 212 275 427 $ US | 55 357 848 484 $ US |
| 2014 | 240 655 811 680 $ US | 59 980 820 484 $ US |
| 2013 | 254 150 511 058 $ US | 58 726 346 174 $ US |
| 2012 | 258 406 678 147 $ US | 59 119 370 699 $ US |
| 2011 | 271 914 827 382 $ US | 58 524 026 439 $ US |
| 2010 | 213 809 938 353 $ US | 52 470 566 559 $ US |
| 2009 | 154 782 195 643 $ US | 45 009 719 716 $ US |
| 2008 | 188 951 334 706 $ US | 49 052 709 836 $ US |
| 2007 | 142 513 291 538 $ US | 43 983 758 609 $ US |
| 2006 | 124 640 948 584 $ US | 35 520 069 351 $ US |
| 2005 | 106 941 616 297 $ US | 30 507 274 277 $ US |
| 2004 | 87 128 030 619 $ US | 27 773 796 063 $ US |
| 2003 | 70 510 644 519 $ US | 23 577 955 517 $ US |
| 2002 | 65 090 759 267 $ US | 19 406 921 271 $ US |
| 2001 | 63 666 859 386 $ US | 17 908 832 809 $ US |
| 2000 | 64 039 984 645 $ US | 19 949 364 218 $ US |
| 1999 | 56 029 835 314 $ US | 18 790 323 068 $ US |
| 1998 | 55 848 921 246 $ US | 17 285 069 769 $ US |
| 1997 | 64 969 123 661 $ US | 19 424 471 083 $ US |
| 1996 | 60 515 586 486 $ US | 19 327 286 476 $ US |
| 1995 | 53 307 054 295 $ US | 16 875 530 201 $ US |
| 1994 | 47 436 944 947 $ US | 14 599 961 680 $ US |
| 1993 | 42 716 537 707 $ US | 12 574 272 323 $ US |
| 1992 | 42 915 586 221 $ US | 11 657 325 373 $ US |
| 1991 | 42 447 458 921 $ US | 11 188 489 168 $ US |
| 1990 | 39 732 496 801 $ US | 10 379 231 510 $ US |
| 1989 | 37 237 292 830 $ US | 9 101 138 891 $ US |
En 2025, les exportations de biens de l'Australie s'élevaient à 338 milliards de dollars et celles de services à 91,6 milliards de dollars ; les services représentaient 21,3 % du total, contre 19,6 % en 1989.
L'Australie dans le classement mondial des exportations, 2025
| Rang | Pays | Exportations | Part mondiale | |
|---|---|---|---|---|
| 20 |
 Pologne |
517 Md $US | 1,48 % | |
| 21 |
Vietnam
|
506 Md $US | 1,45 % | vs Vietnam |
| 22 |
 Russie |
466 Md $US | 1,34 % | vs Russie |
| 23 |
 Australie |
418 Md $US | 1,2 % | |
| 24 |
 Thaïlande |
411 Md $US | 1,18 % | |
| 25 |
 Brésil |
406 Md $US | 1,16 % | vs Brésil |
| 26 |
 Turquie |
397 Md $US | 1,14 % | vs Turquie |
Exportations de biens et services de l'Australie, % du PIB, 1960–2025
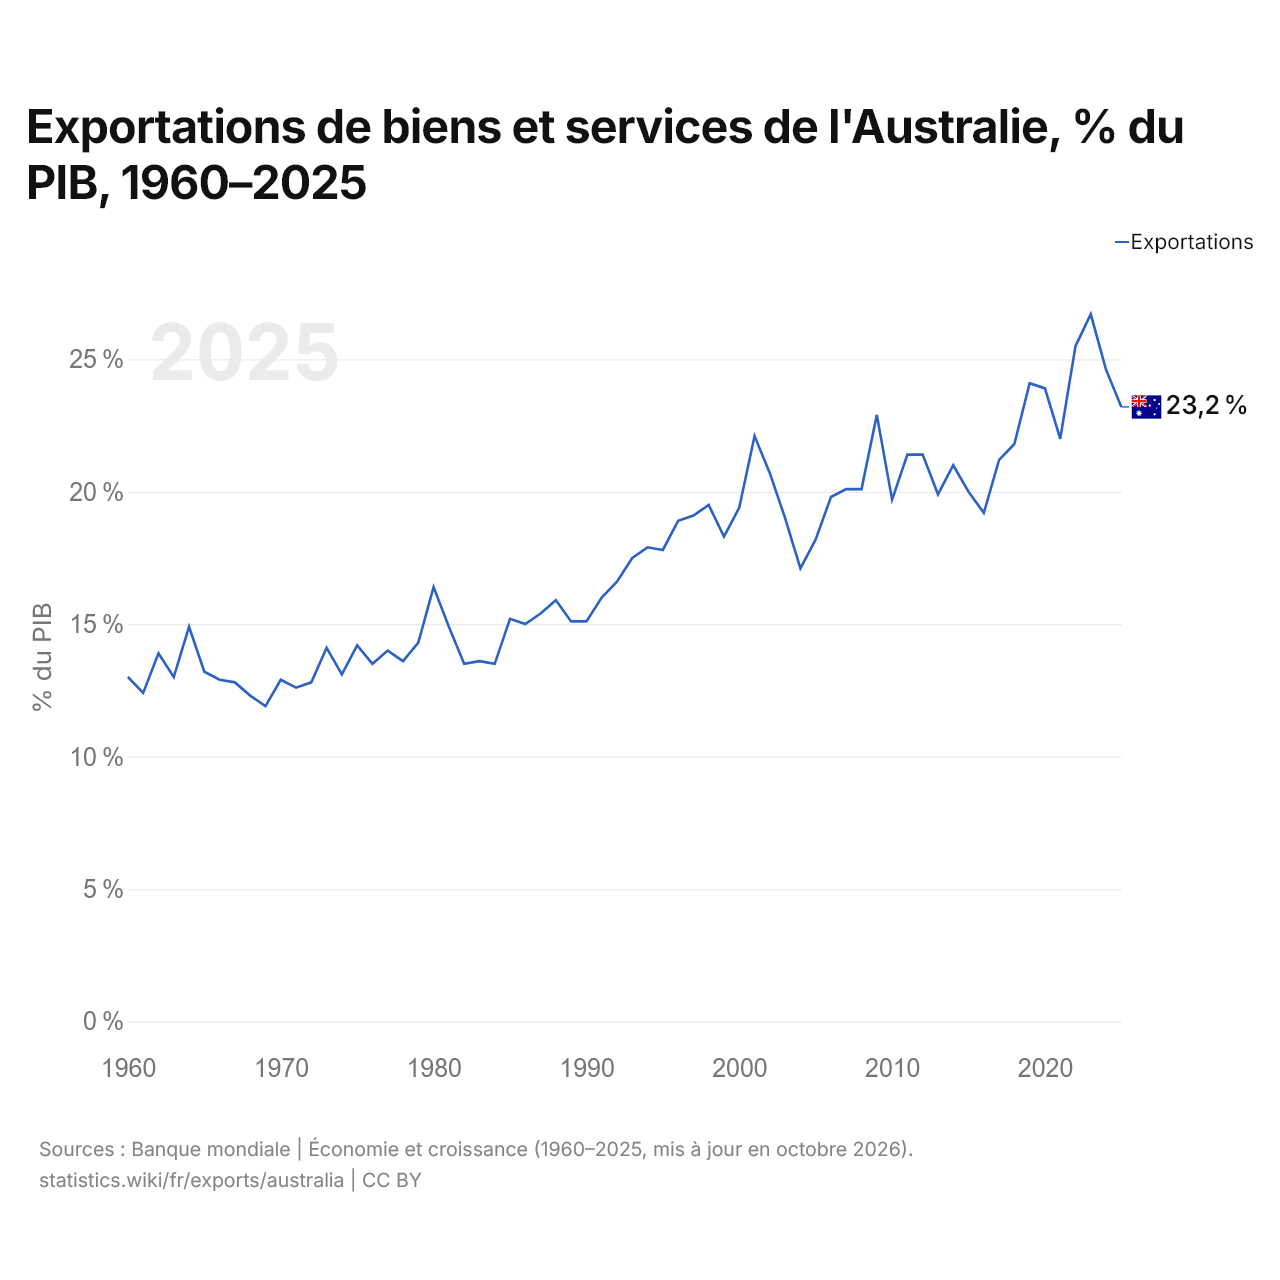
En 2025, les exportations de biens et services de l'Australie équivalaient à 23,2 % de son PIB, contre 13,0 % en 1960. La part la plus élevée a été de 26,7 %, en 2023.
Comparer les exportations de l'Australie avec celles d'autres pays
Sources :
- TradeMap (2001–2025, mis à jour en octobre 2026)
- Banque mondiale | Économie et croissance (1960–2025, mis à jour en octobre 2026)
Creative Commons Attribution (CC BY) : vous pouvez copier, partager, adapter et réutiliser ce contenu, y compris à des fins commerciales, à condition de citer statistics.wiki et d’indiquer les modifications apportées. Les sources citées ci-dessus peuvent avoir leurs propres conditions de licence.