
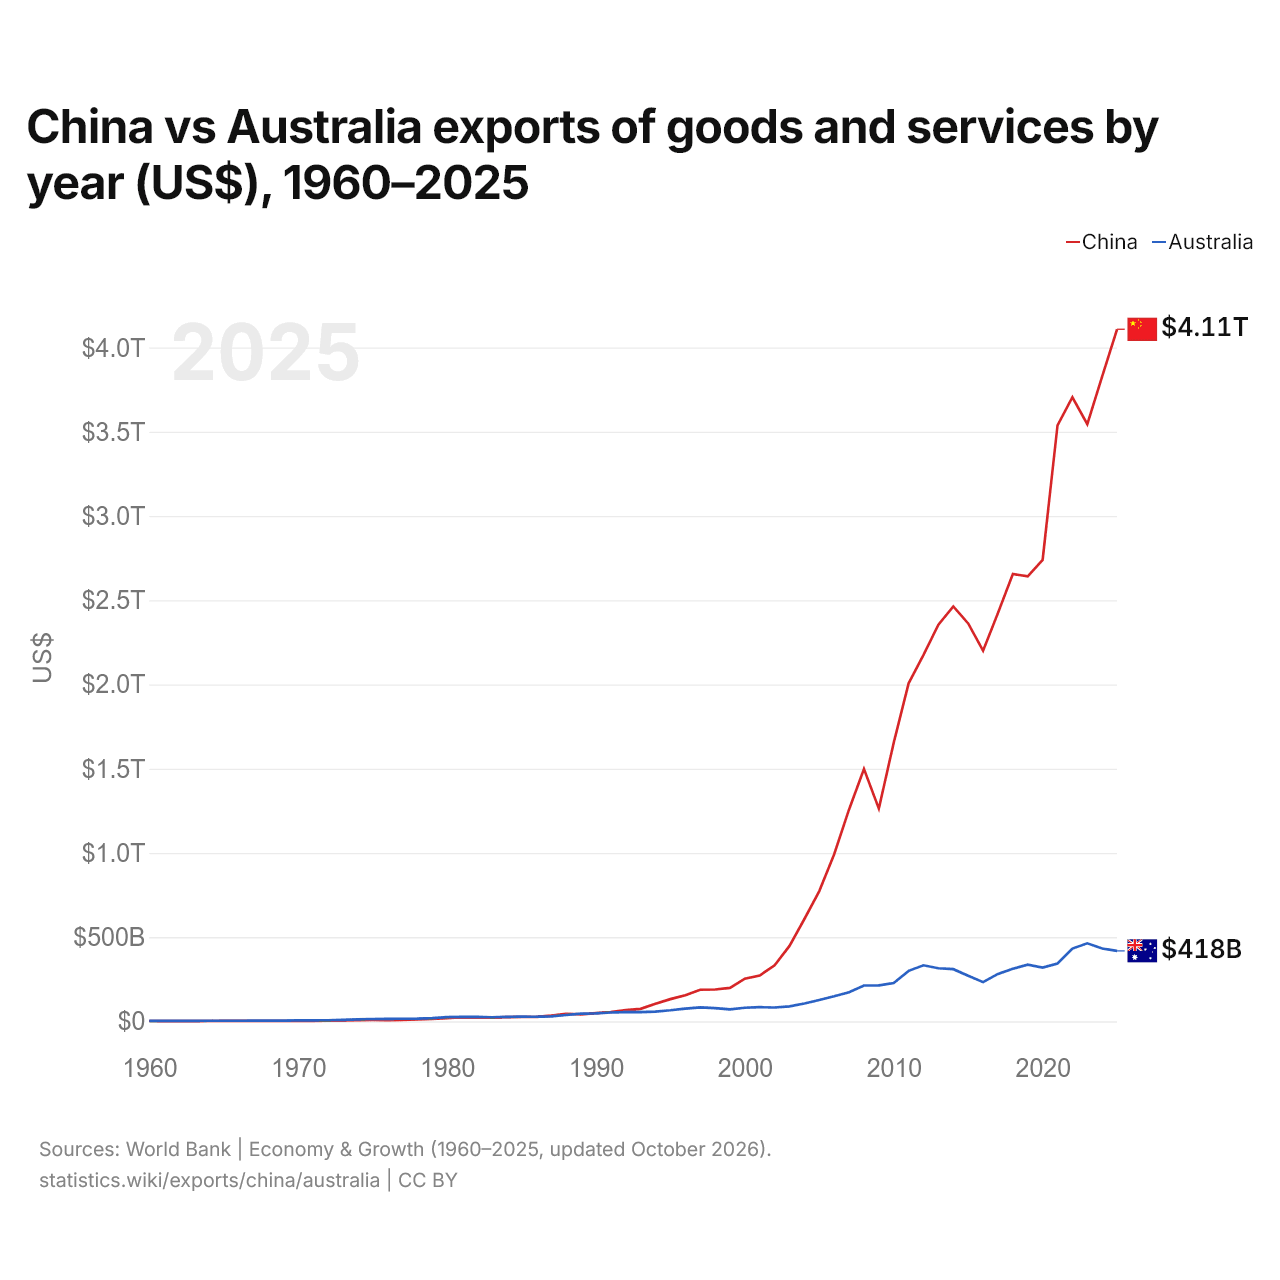
Chine vs Australie : exportations de biens et services par année ($ US), 1960–2025
| Année | $ US | |
|---|---|---|
 Chine |
 Australie |
|
| 2025 | 4 108 470 555 118 $ US | 418 055 624 771 $ US |
| 2024 | 3 828 873 971 972 $ US | 432 605 705 549 $ US |
| 2023 | 3 544 871 083 631 $ US | 463 117 015 978 $ US |
| 2022 | 3 705 070 541 733 $ US | 431 732 710 876 $ US |
| 2021 | 3 537 510 275 664 $ US | 343 364 164 706 $ US |
| 2020 | 2 739 785 089 628 $ US | 319 174 580 744 $ US |
| 2019 | 2 641 188 436 776 $ US | 336 477 593 836 $ US |
| 2018 | 2 655 609 176 087 $ US | 312 605 804 111 $ US |
| 2017 | 2 424 216 052 098 $ US | 281 774 035 050 $ US |
| 2016 | 2 199 974 853 570 $ US | 232 663 011 513 $ US |
| 2015 | 2 362 097 053 275 $ US | 271 152 836 561 $ US |
| 2014 | 2 462 825 804 851 $ US | 309 621 975 145 $ US |
| 2013 | 2 354 264 539 609 $ US | 315 055 128 030 $ US |
| 2012 | 2 175 069 254 664 $ US | 332 613 569 103 $ US |
| 2011 | 2 006 308 960 976 $ US | 299 823 615 768 $ US |
| 2010 | 1 654 823 329 664 $ US | 227 427 026 265 $ US |
| 2009 | 1 262 664 161 020 $ US | 213 717 313 260 $ US |
| 2008 | 1 497 868 782 940 $ US | 212 794 797 279 $ US |
| 2007 | 1 258 056 795 941 $ US | 172 570 464 003 $ US |
| 2006 | 991 731 387 761 $ US | 148 587 374 345 $ US |
| 2005 | 773 339 005 397 $ US | 126 785 667 302 $ US |
| 2004 | 607 356 934 125 $ US | 105 490 823 730 $ US |
| 2003 | 447 958 253 782 $ US | 89 138 031 450 $ US |
| 2002 | 333 002 310 923 $ US | 82 033 782 310 $ US |
| 2001 | 272 060 010 516 $ US | 84 096 722 017 $ US |
| 2000 | 253 092 089 737 $ US | 80 695 888 525 $ US |
| 1999 | 198 699 399 635 $ US | 71 285 875 423 $ US |
| 1998 | 188 750 394 176 $ US | 78 166 587 533 $ US |
| 1997 | 187 447 040 000 $ US | 83 327 463 879 $ US |
| 1996 | 154 811 877 000 $ US | 75 814 054 769 $ US |
| 1995 | 131 858 826 000 $ US | 65 793 733 294 $ US |
| 1994 | 104 607 445 198 $ US | 58 015 219 647 $ US |
| 1993 | 74 280 328 750 $ US | 54 747 048 904 $ US |
| 1992 | 66 847 400 129 $ US | 54 226 800 318 $ US |
| 1991 | 55 542 659 170 $ US | 52 248 569 798 $ US |
| 1990 | 49 129 758 920 $ US | 47 071 479 854 $ US |
| 1989 | 41 190 793 490 $ US | 45 333 960 857 $ US |
| 1988 | 44 923 701 330 $ US | 37 674 402 361 $ US |
| 1987 | 34 072 853 910 $ US | 29 290 629 963 $ US |
| 1986 | 26 202 580 690 $ US | 27 321 628 428 $ US |
| 1985 | 25 801 403 274 $ US | 27 497 313 397 $ US |
| 1984 | 24 764 305 081 $ US | 26 235 903 975 $ US |
| 1983 | 21 956 304 449 $ US | 24 060 337 550 $ US |
| 1982 | 22 600 124 795 $ US | 26 231 932 031 $ US |
| 1981 | 24 369 970 000 $ US | 26 334 610 473 $ US |
| 1980 | 19 405 720 000 $ US | 24 616 155 989 $ US |
| 1979 | 13 962 640 000 $ US | 19 275 247 075 $ US |
| 1978 | 10 801 140 000 $ US | 16 122 883 554 $ US |
| 1977 | 8 271 070 000 $ US | 15 449 644 414 $ US |
| 1976 | 7 440 600 000 $ US | 14 184 298 827 $ US |
| 1975 | 7 974 570 000 $ US | 13 874 095 316 $ US |
| 1974 | 7 213 067 000 $ US | 11 680 176 861 $ US |
| 1973 | 5 959 279 000 $ US | 9 019 859 065 $ US |
| 1972 | 3 537 210 000 $ US | 6 663 551 402 $ US |
| 1971 | 2 710 416 000 $ US | 5 715 360 914 $ US |
| 1970 | 2 274 220 000 $ US | 5 354 720 857 $ US |
| 1969 | 2 214 390 000 $ US | 4 378 080 700 $ US |
| 1968 | 2 114 700 000 $ US | 4 016 320 643 $ US |
| 1967 | 2 155 880 000 $ US | 3 915 520 626 $ US |
| 1966 | 2 370 600 000 $ US | 3 525 760 564 $ US |
| 1965 | 2 246 600 000 $ US | 3 428 320 549 $ US |
| 1964 | 1 938 860 000 $ US | 3 549 280 568 $ US |
| 1963 | 1 666 350 000 $ US | 2 796 640 447 $ US |
| 1962 | 1 505 370 000 $ US | 2 773 120 444 $ US |
| 1961 | 1 505 610 000 $ US | 2 437 120 390 $ US |
| 1960 | 1 883 060 000 $ US | 2 413 600 386 $ US |
En 2025, les exportations de biens et services de la Chine s'élevaient à 4,11 billions de dollars et celles de l'Australie à 418 milliards de dollars : celles de la Chine étaient 9,8 fois plus élevées. En 1960, les exportations de l'Australie étaient supérieures de 28 % : 1,88 milliard de dollars pour la Chine et 2,41 milliards de dollars pour l'Australie.
Les exportations de biens et services de la Chine sont supérieures à celles de l'Australie chaque année depuis 1990.
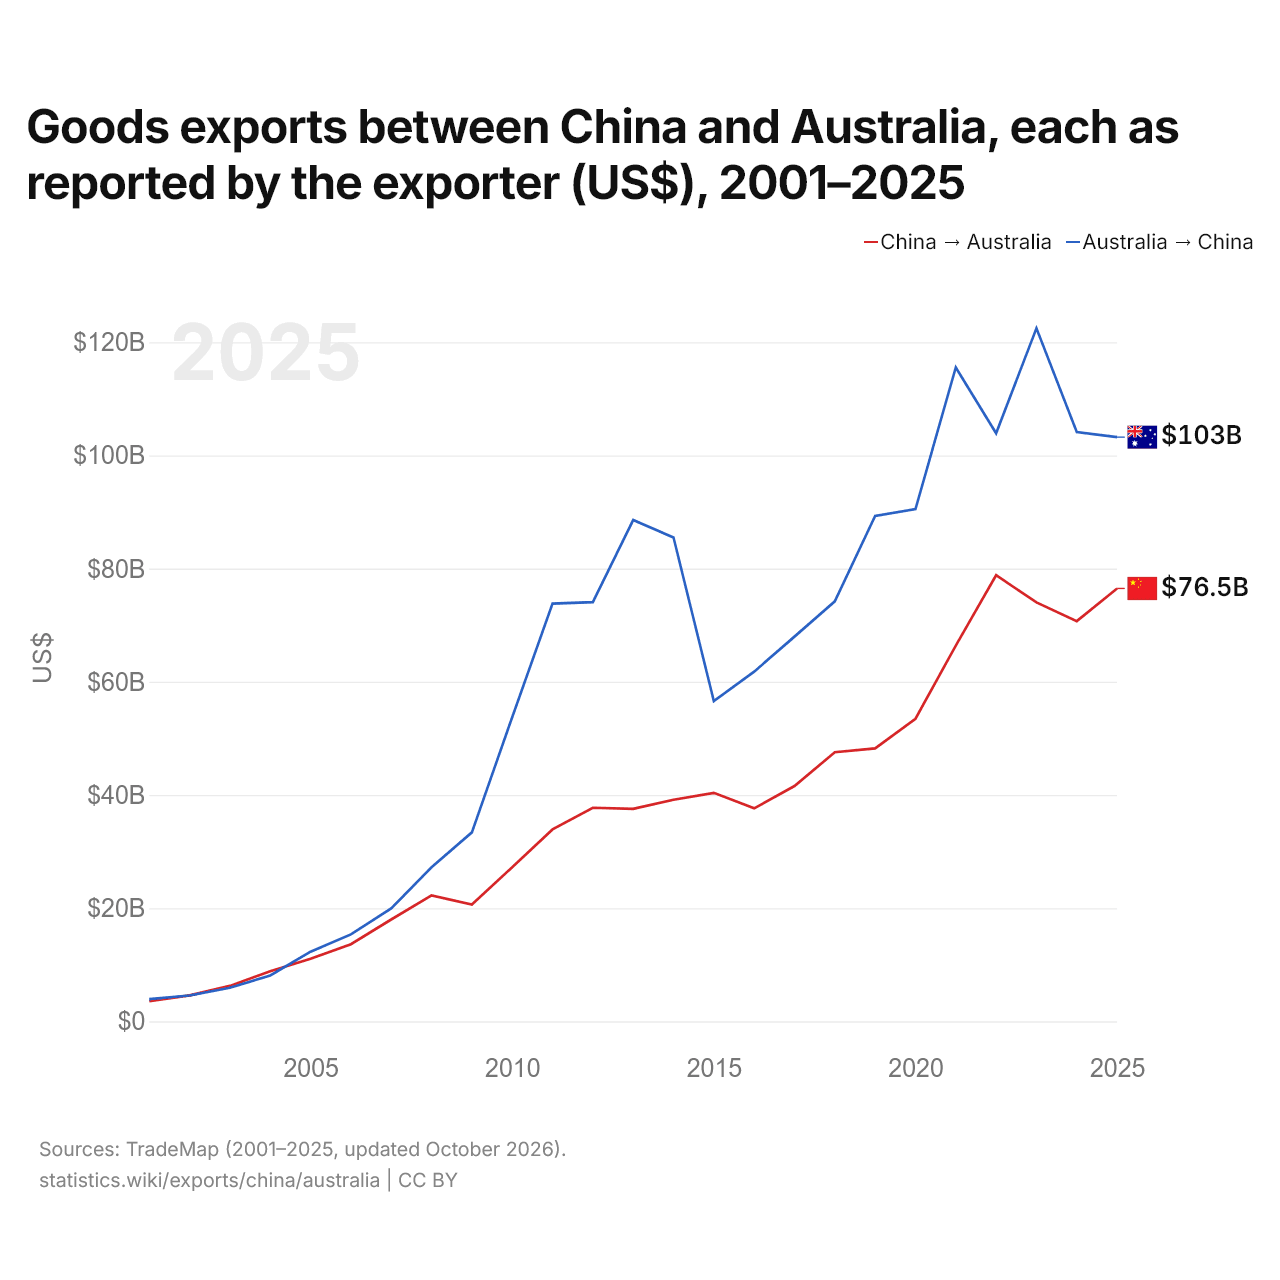
Exportations de biens entre la Chine et l'Australie, selon chaque exportateur ($ US), 2001–2025
| Année | $ US | |
|---|---|---|
| Chine → Australie | Australie → Chine | |
| 2025 | 76 493 417 000 $ US | 103 223 427 000 $ US |
| 2024 | 70 714 587 000 $ US | 104 138 158 000 $ US |
| 2023 | 74 022 144 000 $ US | 122 459 628 000 $ US |
| 2022 | 78 827 036 000 $ US | 103 920 337 000 $ US |
| 2021 | 66 383 683 000 $ US | 115 535 934 000 $ US |
| 2020 | 53 468 167 000 $ US | 90 502 920 000 $ US |
| 2019 | 48 229 554 000 $ US | 89 293 723 000 $ US |
| 2018 | 47 547 551 000 $ US | 74 213 035 000 $ US |
| 2017 | 41 582 543 000 $ US | 67 978 379 000 $ US |
| 2016 | 37 634 374 000 $ US | 61 786 054 000 $ US |
| 2015 | 40 378 582 000 $ US | 56 591 742 000 $ US |
| 2014 | 39 145 950 000 $ US | 85 491 901 000 $ US |
| 2013 | 37 554 163 000 $ US | 88 576 822 000 $ US |
| 2012 | 37 734 920 000 $ US | 74 070 143 000 $ US |
| 2011 | 33 910 013 000 $ US | 73 804 137 000 $ US |
| 2010 | 27 220 264 000 $ US | 53 740 403 000 $ US |
| 2009 | 20 645 567 000 $ US | 33 389 244 000 $ US |
| 2008 | 22 247 264 000 $ US | 27 225 182 000 $ US |
| 2007 | 17 996 590 000 $ US | 19 967 514 000 $ US |
| 2006 | 13 624 882 000 $ US | 15 356 473 000 $ US |
| 2005 | 11 061 501 000 $ US | 12 302 482 000 $ US |
| 2004 | 8 838 251 000 $ US | 8 094 988 000 $ US |
| 2003 | 6 263 579 000 $ US | 5 922 091 000 $ US |
| 2002 | 4 585 039 000 $ US | 4 557 231 000 $ US |
| 2001 | 3 569 446 000 $ US | 3 917 959 000 $ US |
En 2025, les exportations de biens de la Chine vers l'Australie, selon la Chine, s'élevaient à 76,5 milliards de dollars, et celles de l'Australie vers la Chine, selon l'Australie, à 103 milliards de dollars : 35 % de plus pour celles de l'Australie. En 2001, elles s'élevaient à 3,57 milliards de dollars pour la Chine et à 3,92 milliards de dollars pour l'Australie.
Chine vs Australie : chiffres des exportations
|
Chine
|
Australie
|
|
|---|---|---|
| Exportations | 4,11 Bn $US (2025) | 418 Md $US (2025) |
| Rang mondial | 1/176 | 23/176 |
| Part mondiale | 11,8 % | 1,2 % |
| % du PIB | 21,1 % | 23,2 % |
| Première catégorie de biens | Machines, électronique et véhicules (53,9 %, 2025) | Pétrole, gaz, minerais et autres matières premières (58,3 %, 2025) |
| Première destination des biens | États-Unis (11,1 %, 2025) | Chine (30 %, 2025) |
Comparer les exportations de 2 pays au choix
Sources :
- Banque mondiale | Économie et croissance (1960–2025, mis à jour en octobre 2026)
- TradeMap (2001–2025, mis à jour en octobre 2026)
Creative Commons Attribution (CC BY) : vous pouvez copier, partager, adapter et réutiliser ce contenu, y compris à des fins commerciales, à condition de citer statistics.wiki et d’indiquer les modifications apportées. Les sources citées ci-dessus peuvent avoir leurs propres conditions de licence.