
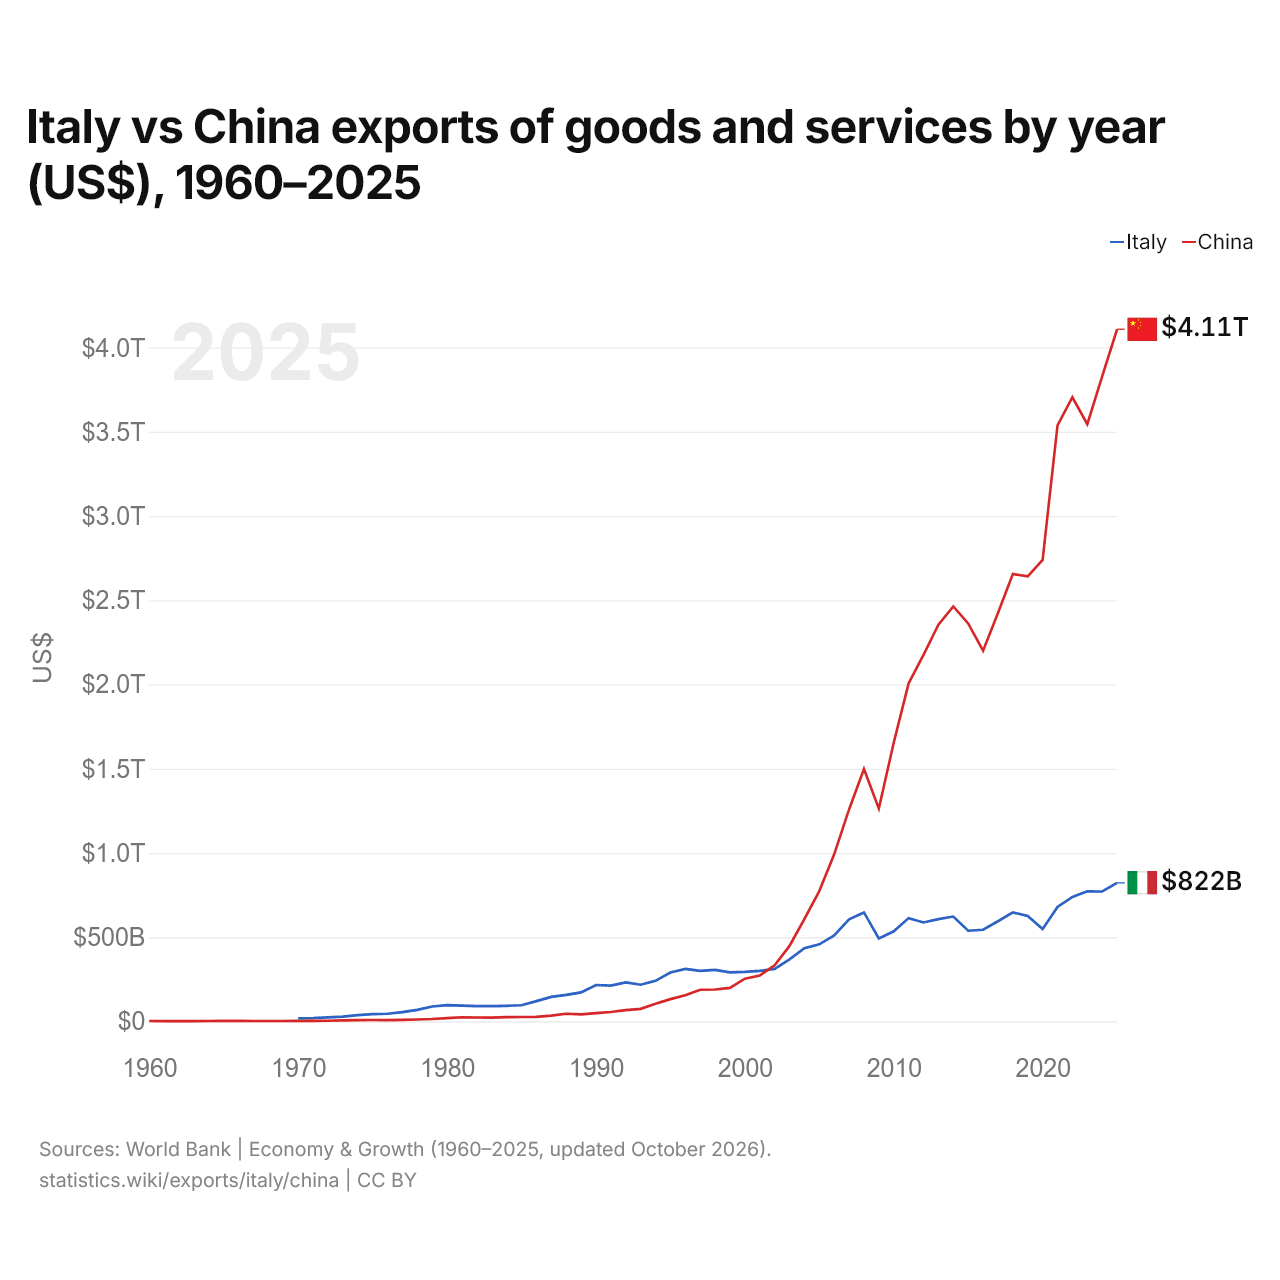
Italie vs Chine : exportations de biens et services par année ($ US), 1960–2025
| Année | $ US | |
|---|---|---|
 Italie |
 Chine |
|
| 2025 | 822 290 762 950 $ US | 4 108 470 555 118 $ US |
| 2024 | 770 685 525 117 $ US | 3 828 873 971 972 $ US |
| 2023 | 772 202 263 040 $ US | 3 544 871 083 631 $ US |
| 2022 | 738 509 644 129 $ US | 3 705 070 541 733 $ US |
| 2021 | 679 294 123 498 $ US | 3 537 510 275 664 $ US |
| 2020 | 547 940 256 805 $ US | 2 739 785 089 628 $ US |
| 2019 | 625 065 757 186 $ US | 2 641 188 436 776 $ US |
| 2018 | 646 909 638 535 $ US | 2 655 609 176 087 $ US |
| 2017 | 593 973 032 350 $ US | 2 424 216 052 098 $ US |
| 2016 | 543 464 412 394 $ US | 2 199 974 853 570 $ US |
| 2015 | 537 833 599 948 $ US | 2 362 097 053 275 $ US |
| 2014 | 622 037 943 986 $ US | 2 462 825 804 851 $ US |
| 2013 | 606 723 898 231 $ US | 2 354 264 539 609 $ US |
| 2012 | 587 109 493 950 $ US | 2 175 069 254 664 $ US |
| 2011 | 612 801 201 125 $ US | 2 006 308 960 976 $ US |
| 2010 | 534 489 188 500 $ US | 1 654 823 329 664 $ US |
| 2009 | 492 210 347 985 $ US | 1 262 664 161 020 $ US |
| 2008 | 646 508 511 780 $ US | 1 497 868 782 940 $ US |
| 2007 | 605 527 905 413 $ US | 1 258 056 795 941 $ US |
| 2006 | 510 265 819 331 $ US | 991 731 387 761 $ US |
| 2005 | 457 141 717 038 $ US | 773 339 005 397 $ US |
| 2004 | 433 747 867 068 $ US | 607 356 934 125 $ US |
| 2003 | 367 620 453 605 $ US | 447 958 253 782 $ US |
| 2002 | 311 627 059 267 $ US | 333 002 310 923 $ US |
| 2001 | 299 586 464 835 $ US | 272 060 010 516 $ US |
| 2000 | 293 867 190 140 $ US | 253 092 089 737 $ US |
| 1999 | 290 576 914 389 $ US | 198 699 399 635 $ US |
| 1998 | 305 612 021 858 $ US | 188 750 394 176 $ US |
| 1997 | 299 911 323 329 $ US | 187 447 040 000 $ US |
| 1996 | 311 106 412 348 $ US | 154 811 877 000 $ US |
| 1995 | 289 818 376 322 $ US | 131 858 826 000 $ US |
| 1994 | 240 410 654 419 $ US | 104 607 445 198 $ US |
| 1993 | 217 241 821 090 $ US | 74 280 328 750 $ US |
| 1992 | 230 753 561 665 $ US | 66 847 400 129 $ US |
| 1991 | 212 306 182 301 $ US | 55 542 659 170 $ US |
| 1990 | 215 684 612 153 $ US | 49 129 758 920 $ US |
| 1989 | 171 957 047 700 $ US | 41 190 793 490 $ US |
| 1988 | 156 726 916 096 $ US | 44 923 701 330 $ US |
| 1987 | 144 899 858 082 $ US | 34 072 853 910 $ US |
| 1986 | 119 777 358 098 $ US | 26 202 580 690 $ US |
| 1985 | 95 474 838 252 $ US | 25 801 403 274 $ US |
| 1984 | 91 976 627 728 $ US | 24 764 305 081 $ US |
| 1983 | 90 083 429 373 $ US | 21 956 304 449 $ US |
| 1982 | 90 239 862 563 $ US | 22 600 124 795 $ US |
| 1981 | 93 313 282 235 $ US | 24 369 970 000 $ US |
| 1980 | 96 339 527 470 $ US | 19 405 720 000 $ US |
| 1979 | 88 125 534 840 $ US | 13 962 640 000 $ US |
| 1978 | 68 300 727 812 $ US | 10 801 140 000 $ US |
| 1977 | 55 073 254 334 $ US | 8 271 070 000 $ US |
| 1976 | 45 043 912 538 $ US | 7 440 600 000 $ US |
| 1975 | 42 652 568 209 $ US | 7 974 570 000 $ US |
| 1974 | 36 967 362 310 $ US | 7 213 067 000 $ US |
| 1973 | 28 263 779 475 $ US | 5 959 279 000 $ US |
| 1972 | 23 697 035 193 $ US | 3 537 210 000 $ US |
| 1971 | 19 424 023 096 $ US | 2 710 416 000 $ US |
| 1970 | 17 194 739 777 $ US | 2 274 220 000 $ US |
| 1969 | - | 2 214 390 000 $ US |
| 1968 | - | 2 114 700 000 $ US |
| 1967 | - | 2 155 880 000 $ US |
| 1966 | - | 2 370 600 000 $ US |
| 1965 | - | 2 246 600 000 $ US |
| 1964 | - | 1 938 860 000 $ US |
| 1963 | - | 1 666 350 000 $ US |
| 1962 | - | 1 505 370 000 $ US |
| 1961 | - | 1 505 610 000 $ US |
| 1960 | - | 1 883 060 000 $ US |
En 2025, les exportations de biens et services de l'Italie s'élevaient à 822 milliards de dollars et celles de la Chine à 4,11 billions de dollars : celles de la Chine étaient 5,0 fois plus élevées. En 1970, les exportations de l'Italie étaient 7,6 fois plus élevées : 17,2 milliards de dollars pour l'Italie et 2,27 milliards de dollars pour la Chine.
Les exportations de biens et services de la Chine sont supérieures à celles de l'Italie chaque année depuis 2002.
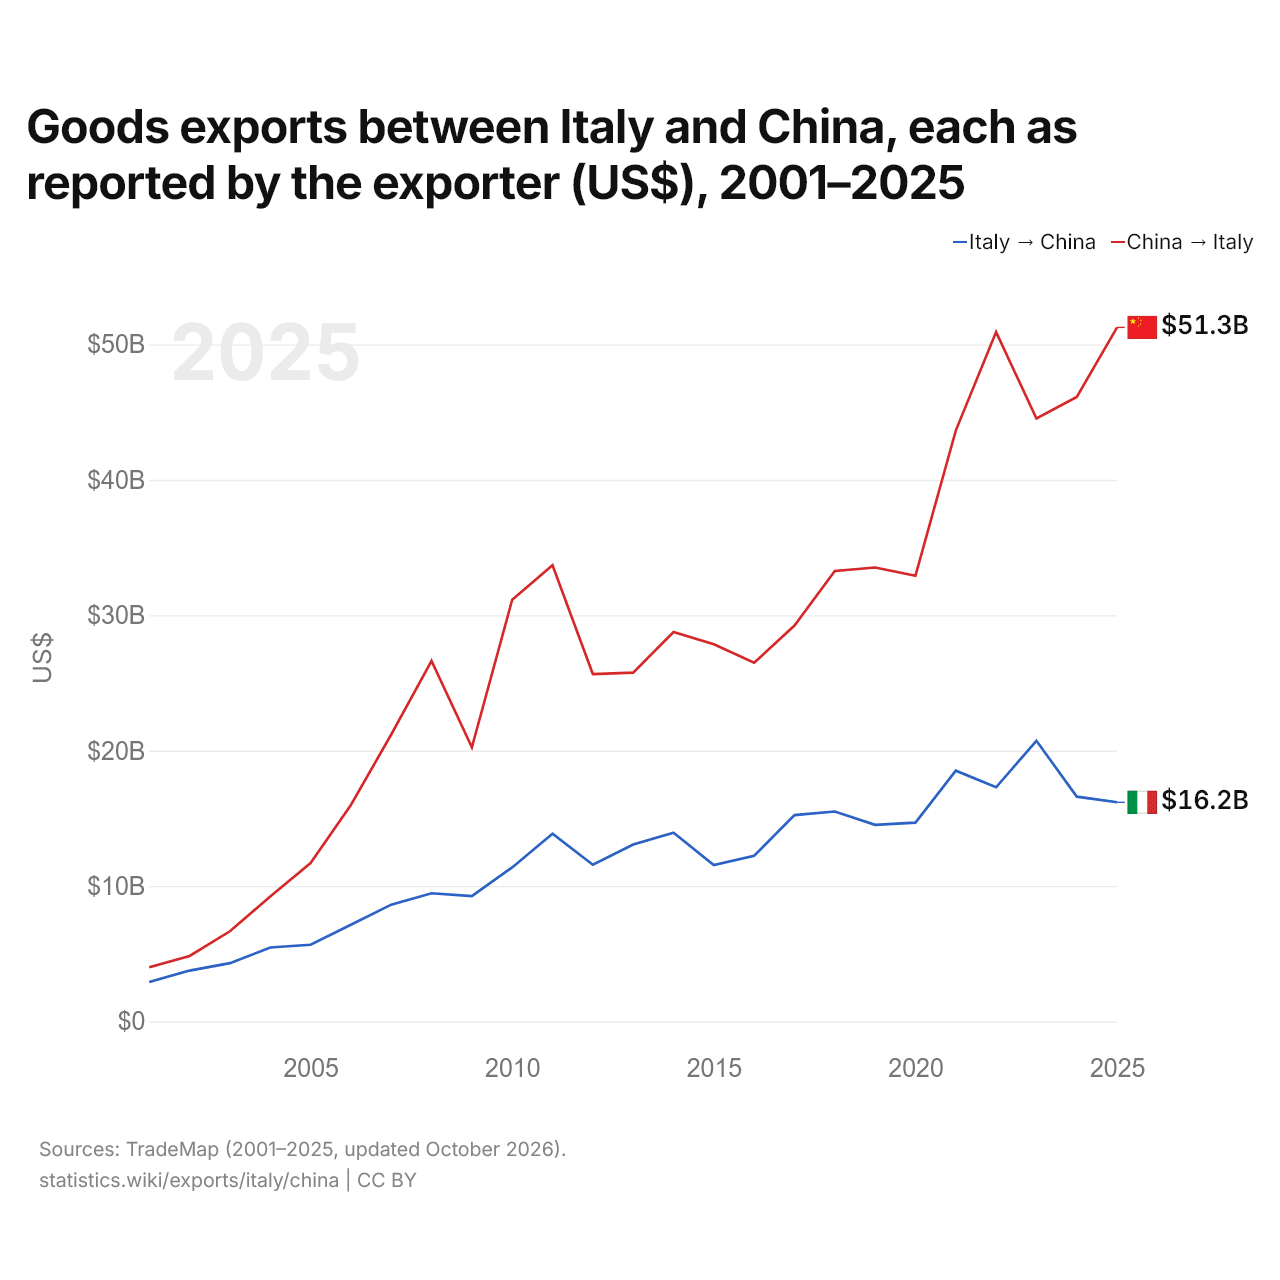
Exportations de biens entre l'Italie et la Chine, selon chaque exportateur ($ US), 2001–2025
| Année | $ US | |
|---|---|---|
| Italie → Chine | Chine → Italie | |
| 2025 | 16 182 160 000 $ US | 51 263 522 000 $ US |
| 2024 | 16 598 217 000 $ US | 46 128 475 000 $ US |
| 2023 | 20 728 304 000 $ US | 44 536 571 000 $ US |
| 2022 | 17 290 636 000 $ US | 50 917 821 000 $ US |
| 2021 | 18 518 366 000 $ US | 43 640 497 000 $ US |
| 2020 | 14 678 167 000 $ US | 32 921 603 000 $ US |
| 2019 | 14 519 418 000 $ US | 33 523 791 000 $ US |
| 2018 | 15 502 545 000 $ US | 33 266 948 000 $ US |
| 2017 | 15 237 841 000 $ US | 29 234 031 000 $ US |
| 2016 | 12 234 173 000 $ US | 26 488 828 000 $ US |
| 2015 | 11 542 515 000 $ US | 27 852 875 000 $ US |
| 2014 | 13 931 561 000 $ US | 28 759 230 000 $ US |
| 2013 | 13 068 832 000 $ US | 25 754 655 000 $ US |
| 2012 | 11 567 294 000 $ US | 25 657 525 000 $ US |
| 2011 | 13 859 845 000 $ US | 33 694 562 000 $ US |
| 2010 | 11 370 047 000 $ US | 31 145 158 000 $ US |
| 2009 | 9 246 315 000 $ US | 20 244 613 000 $ US |
| 2008 | 9 460 529 000 $ US | 26 631 139 000 $ US |
| 2007 | 8 619 928 000 $ US | 21 189 388 000 $ US |
| 2006 | 7 139 124 000 $ US | 15 977 188 000 $ US |
| 2005 | 5 658 605 000 $ US | 11 690 507 000 $ US |
| 2004 | 5 451 982 000 $ US | 9 224 391 000 $ US |
| 2003 | 4 296 244 000 $ US | 6 652 754 000 $ US |
| 2002 | 3 750 222 000 $ US | 4 827 785 000 $ US |
| 2001 | 2 903 965 000 $ US | 3 991 938 000 $ US |
En 2025, les exportations de biens de l'Italie vers la Chine, selon l'Italie, s'élevaient à 16,2 milliards de dollars, et celles de la Chine vers l'Italie, selon la Chine, à 51,3 milliards de dollars : 3,2 fois plus pour celles de la Chine. En 2001, elles s'élevaient à 2,9 milliards de dollars pour l'Italie et à 3,99 milliards de dollars pour la Chine.
Italie vs Chine : chiffres des exportations
|
Italie
|
Chine
|
|
|---|---|---|
| Exportations | 822 Md $US (2025) | 4,11 Bn $US (2025) |
| Rang mondial | 12/176 | 1/176 |
| Part mondiale | 2,36 % | 11,8 % |
| % du PIB | 32,2 % | 21,1 % |
| Première catégorie de biens | Machines, électronique et véhicules (34,9 %, 2025) | Machines, électronique et véhicules (53,9 %, 2025) |
| Première destination des biens | Allemagne (11,2 %, 2025) | États-Unis (11,1 %, 2025) |
Comparer les exportations de 2 pays au choix
Sources :
- Banque mondiale | Économie et croissance (1960–2025, mis à jour en octobre 2026)
- TradeMap (2001–2025, mis à jour en octobre 2026)
Creative Commons Attribution (CC BY) : vous pouvez copier, partager, adapter et réutiliser ce contenu, y compris à des fins commerciales, à condition de citer statistics.wiki et d’indiquer les modifications apportées. Les sources citées ci-dessus peuvent avoir leurs propres conditions de licence.