
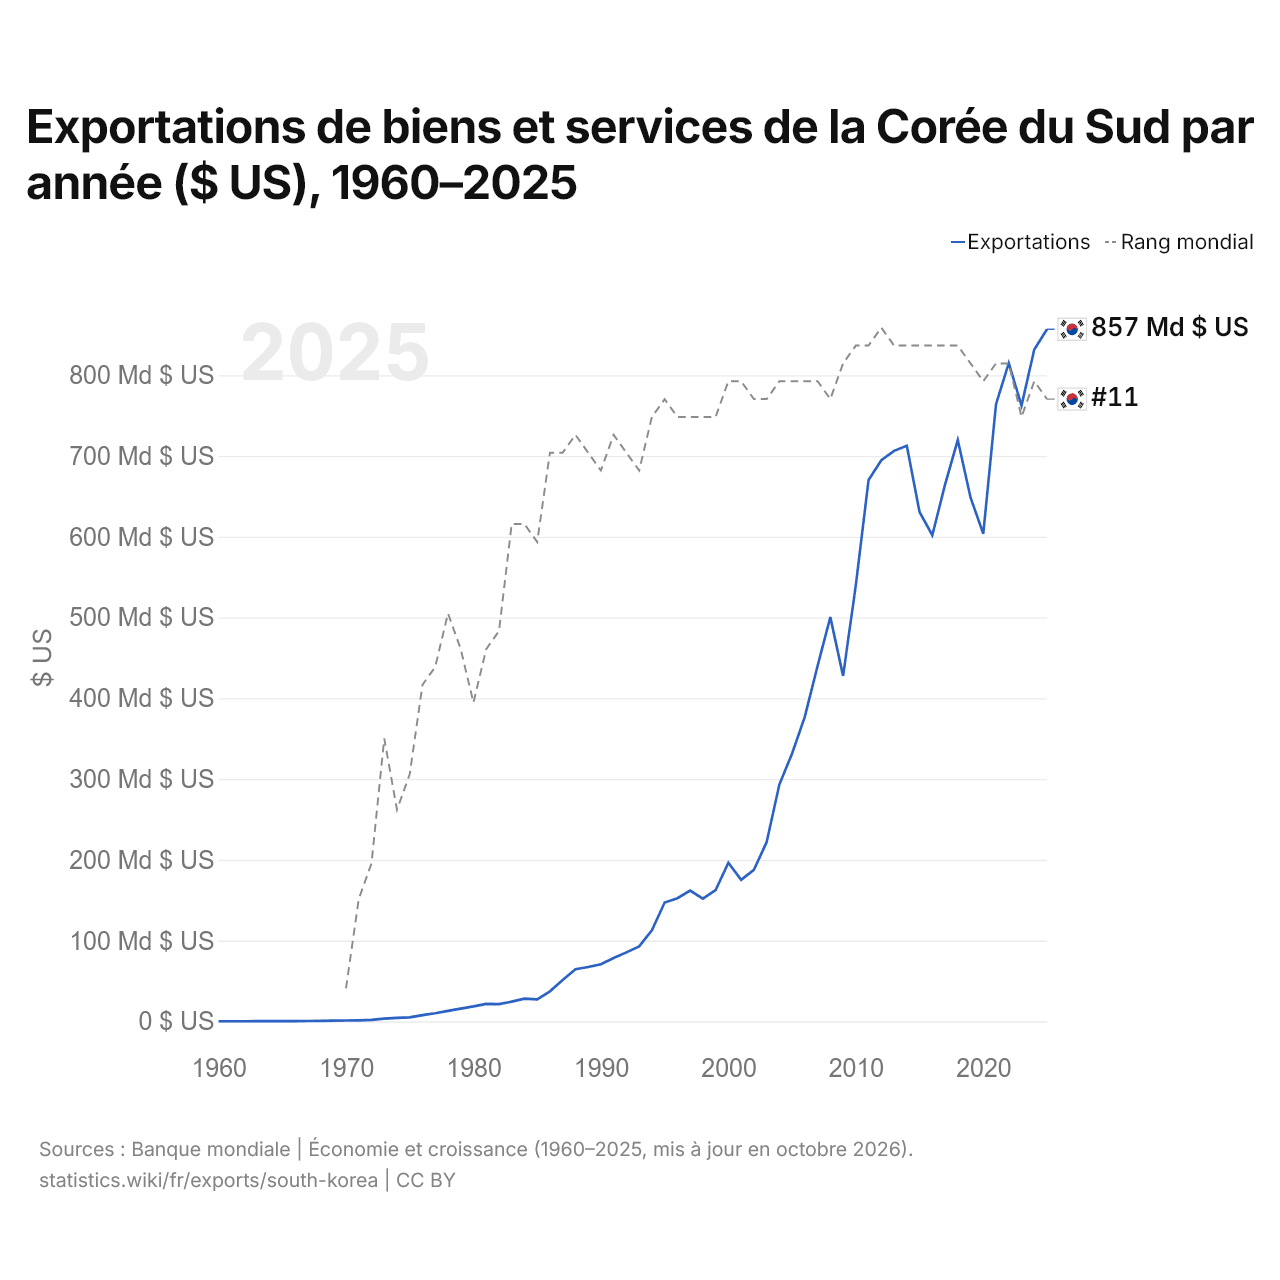
Exportations de biens et services de la Corée du Sud par année ($ US), 1960–2025
| Année | $ US | Rang mondial |
|---|---|---|
| Exportations | Rang mondial | |
| 2025 | 856 855 674 924 $ US | #11 |
| 2024 | 831 889 172 091 $ US | #10 |
| 2023 | 762 299 062 736 $ US | #12 |
| 2022 | 815 019 022 384 $ US | #9 |
| 2021 | 764 083 221 346 $ US | #9 |
| 2020 | 603 713 417 774 $ US | #10 |
| 2019 | 648 610 576 583 $ US | #9 |
| 2018 | 719 710 064 860 $ US | #8 |
| 2017 | 664 392 456 663 $ US | #8 |
| 2016 | 601 861 440 814 $ US | #8 |
| 2015 | 630 586 518 886 $ US | #8 |
| 2014 | 712 570 950 952 $ US | #8 |
| 2013 | 706 343 252 061 $ US | #8 |
| 2012 | 694 692 887 431 $ US | #7 |
| 2011 | 670 299 926 920 $ US | #8 |
| 2010 | 540 016 342 978 $ US | #8 |
| 2009 | 427 737 777 325 $ US | #9 |
| 2008 | 500 458 646 625 $ US | #11 |
| 2007 | 440 034 853 641 $ US | #10 |
| 2006 | 377 241 080 635 $ US | #10 |
| 2005 | 331 627 733 441 $ US | #10 |
| 2004 | 293 159 147 249 $ US | #10 |
| 2003 | 221 795 023 926 $ US | #11 |
| 2002 | 187 653 181 634 $ US | #11 |
| 2001 | 175 166 805 500 $ US | #10 |
| 2000 | 196 359 987 002 $ US | #10 |
| 1999 | 162 507 811 339 $ US | #12 |
| 1998 | 151 914 103 577 $ US | #12 |
| 1997 | 161 870 964 161 $ US | #12 |
| 1996 | 152 440 172 724 $ US | #12 |
| 1995 | 147 104 275 488 $ US | #11 |
| 1994 | 112 641 201 186 $ US | #12 |
| 1993 | 92 739 264 964 $ US | #15 |
| 1992 | 85 350 581 848 $ US | #14 |
| 1991 | 78 353 503 011 $ US | #13 |
| 1990 | 70 587 774 855 $ US | #15 |
| 1989 | 67 308 972 534 $ US | #14 |
| 1988 | 64 594 460 211 $ US | #13 |
| 1987 | 51 281 992 055 $ US | #14 |
| 1986 | 37 166 083 048 $ US | #14 |
| 1985 | 27 098 802 326 $ US | #19 |
| 1984 | 28 063 621 761 $ US | #18 |
| 1983 | 24 343 720 766 $ US | #18 |
| 1982 | 21 331 058 721 $ US | #24 |
| 1981 | 21 668 115 701 $ US | #25 |
| 1980 | 18 451 432 875 $ US | #28 |
| 1979 | 15 748 140 496 $ US | #25 |
| 1978 | 12 936 570 248 $ US | #23 |
| 1977 | 9 969 834 711 $ US | #26 |
| 1976 | 7 605 165 289 $ US | #27 |
| 1975 | 4 908 057 851 $ US | #32 |
| 1974 | 4 324 150 591 $ US | #34 |
| 1973 | 3 309 134 300 $ US | #30 |
| 1972 | 1 795 139 760 $ US | #37 |
| 1971 | 1 251 053 227 $ US | #39 |
| 1970 | 1 026 868 601 $ US | #44 |
| 1969 | 814 822 835 $ US | - |
| 1968 | 620 651 015 $ US | - |
| 1967 | 442 486 545 $ US | - |
| 1966 | 331 690 238 $ US | - |
| 1965 | 222 596 929 $ US | - |
| 1964 | 171 618 267 $ US | - |
| 1963 | 157 692 308 $ US | - |
| 1962 | 109 230 769 $ US | - |
| 1961 | 97 762 912 $ US | - |
| 1960 | 104 554 455 $ US | - |
En 2025, les exportations de biens et services de la Corée du Sud s'élevaient à 857 milliards de dollars, contre 105 millions de dollars en 1960. Le minimum a été de 97,8 millions de dollars, en 1961. Elles se classaient au 11e rang mondial, en baisse par rapport au 10e rang en 2024. Leur meilleur rang a été le 7e, occupé pour la dernière fois en 2012.
En 2025, les exportations de biens et services de la Corée du Sud étaient les 5es plus élevées de 44 pays situés en Asie. Les importations de biens et services de la Corée du Sud s'élevaient à 760 milliards de dollars en 2025, au 11e rang mondial. En 2025, les exportations de la Corée du Sud dépassaient ses importations de 96,7 milliards de dollars, soit un excédent commercial.
Exportations de biens de la Corée du Sud par catégorie, 2025
Exportations de biens, 2025: 709 Md $US
En 2025, la première catégorie des exportations de biens de la Corée du Sud était « machines, électronique et véhicules », avec 65,3 %, suivie de « produits chimiques, pharmaceutiques et plastiques », avec 12,1 %.
Destinations des exportations de biens de la Corée du Sud : les 10 premières, 2025
| Rang | Pays | Exportations de biens | Part | |
|---|---|---|---|---|
| 1 |
 Chine |
131 Md $US | 18,4 % | vs Chine |
| 2 |
 États-Unis |
123 Md $US | 17,4 % | |
| 3 |
 Vietnam |
62,8 Md $US | 8,85 % | vs Vietnam |
| 4 |
 Japon |
28,3 Md $US | 3,99 % | vs Japon |
| 5 |
 Singapour |
19,6 Md $US | 2,76 % | vs Singapour |
| 6 |
 Inde |
19,2 Md $US | 2,71 % | vs Inde |
| 7 |
 Australie |
14,2 Md $US | 2 % | vs Australie |
| 8 |
 Malaisie |
12,4 Md $US | 1,74 % | vs Malaisie |
| 9 |
 Mexique |
12,1 Md $US | 1,7 % | vs Mexique |
| 10 |
 Philippines |
11,6 Md $US | 1,64 % | vs Philippines |
| Autres partenaires et non précisés | 275 Md $US | 38,8 % |
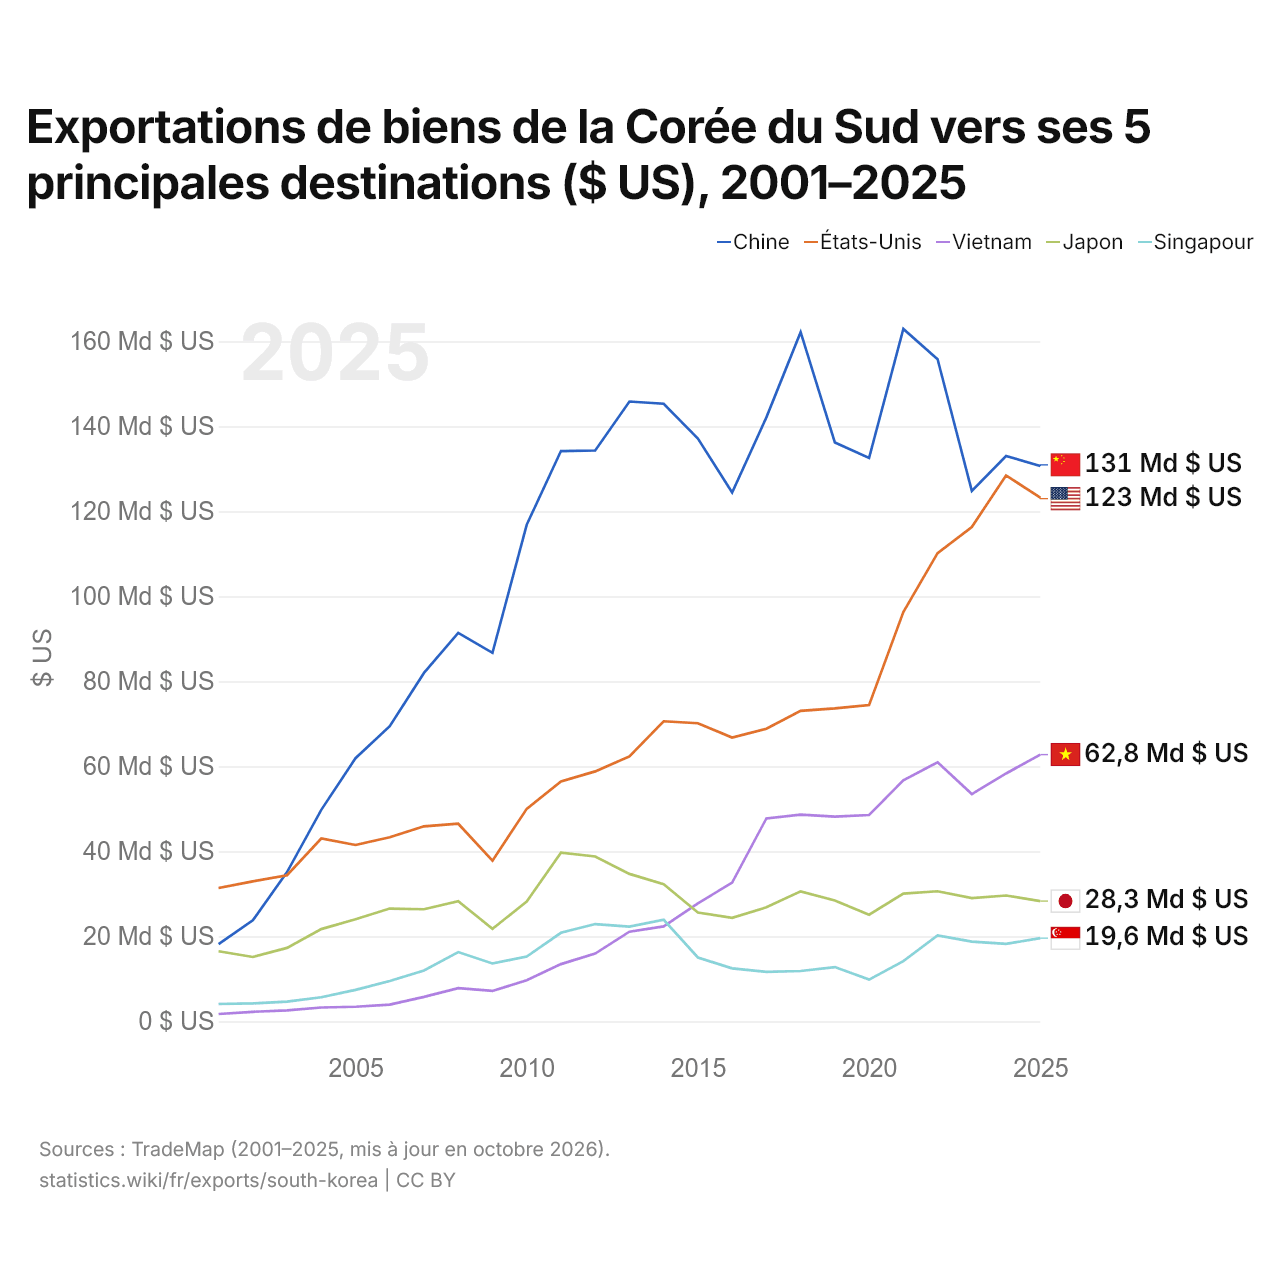
Exportations de biens de la Corée du Sud vers ses 5 principales destinations ($ US), 2001–2025
| Année | $ US | ||||
|---|---|---|---|---|---|
| Chine | États-Unis | Vietnam | Japon | Singapour | |
| 2025 | 130 649 061 000 $ US | 123 248 726 000 $ US | 62 766 065 000 $ US | 28 295 236 000 $ US | 19 564 486 000 $ US |
| 2024 | 133 036 262 000 $ US | 128 436 279 000 $ US | 58 321 315 000 $ US | 29 606 670 000 $ US | 18 216 058 000 $ US |
| 2023 | 124 817 682 000 $ US | 116 322 826 000 $ US | 53 479 535 000 $ US | 29 000 615 000 $ US | 18 751 990 000 $ US |
| 2022 | 155 789 389 000 $ US | 110 177 328 000 $ US | 60 963 680 000 $ US | 30 606 277 000 $ US | 20 205 410 000 $ US |
| 2021 | 162 919 707 000 $ US | 96 313 665 000 $ US | 56 729 065 000 $ US | 30 063 124 000 $ US | 14 175 201 000 $ US |
| 2020 | 132 555 008 000 $ US | 74 439 935 000 $ US | 48 542 972 000 $ US | 25 092 517 000 $ US | 9 825 658 000 $ US |
| 2019 | 136 213 398 000 $ US | 73 626 605 000 $ US | 48 177 684 000 $ US | 28 412 058 000 $ US | 12 769 446 000 $ US |
| 2018 | 162 157 595 000 $ US | 73 059 980 000 $ US | 48 628 513 000 $ US | 30 574 271 000 $ US | 11 850 451 000 $ US |
| 2017 | 142 115 180 000 $ US | 68 854 696 000 $ US | 47 749 153 000 $ US | 26 827 473 000 $ US | 11 648 845 000 $ US |
| 2016 | 124 432 718 000 $ US | 66 757 968 000 $ US | 32 650 609 000 $ US | 24 356 592 000 $ US | 12 459 151 000 $ US |
| 2015 | 137 140 476 000 $ US | 70 129 929 000 $ US | 27 773 261 000 $ US | 25 596 263 000 $ US | 15 022 313 000 $ US |
| 2014 | 145 327 744 000 $ US | 70 597 707 000 $ US | 22 332 858 000 $ US | 32 247 849 000 $ US | 23 905 656 000 $ US |
| 2013 | 145 836 767 000 $ US | 62 330 016 000 $ US | 21 087 589 000 $ US | 34 693 728 000 $ US | 22 279 598 000 $ US |
| 2012 | 134 322 396 000 $ US | 58 806 901 000 $ US | 15 945 972 000 $ US | 38 795 946 000 $ US | 22 887 916 000 $ US |
| 2011 | 134 185 009 000 $ US | 56 421 431 000 $ US | 13 464 922 000 $ US | 39 679 480 000 $ US | 20 839 005 000 $ US |
| 2010 | 116 837 804 000 $ US | 49 991 458 000 $ US | 9 652 073 000 $ US | 28 176 255 000 $ US | 15 244 200 000 $ US |
| 2009 | 86 703 245 000 $ US | 37 802 594 000 $ US | 7 149 477 000 $ US | 21 770 815 000 $ US | 13 616 994 000 $ US |
| 2008 | 91 388 900 000 $ US | 46 500 676 000 $ US | 7 804 807 000 $ US | 28 252 423 000 $ US | 16 292 970 000 $ US |
| 2007 | 81 985 131 000 $ US | 45 883 922 000 $ US | 5 760 054 000 $ US | 26 370 189 000 $ US | 11 949 481 000 $ US |
| 2006 | 69 459 177 000 $ US | 43 320 311 000 $ US | 3 927 476 000 $ US | 26 533 922 000 $ US | 9 489 300 000 $ US |
| 2005 | 61 914 973 000 $ US | 41 499 402 000 $ US | 3 431 654 000 $ US | 24 027 420 000 $ US | 7 406 633 000 $ US |
| 2004 | 49 763 175 000 $ US | 43 026 562 000 $ US | 3 255 574 000 $ US | 21 701 330 000 $ US | 5 653 508 000 $ US |
| 2003 | 35 109 715 000 $ US | 34 368 717 000 $ US | 2 561 234 000 $ US | 17 276 115 000 $ US | 4 635 988 000 $ US |
| 2002 | 23 753 231 000 $ US | 32 942 695 000 $ US | 2 240 187 000 $ US | 15 140 351 000 $ US | 4 221 468 000 $ US |
| 2001 | 18 186 814 000 $ US | 31 357 343 000 $ US | 1 731 557 000 $ US | 16 502 319 000 $ US | 4 079 566 000 $ US |
En 2025, les exportations de biens s'élevaient à 131 milliards de dollars vers la Chine, 123 milliards de dollars vers les États-Unis, 62,8 milliards de dollars vers le Vietnam, 28,3 milliards de dollars vers le Japon et 19,6 milliards de dollars vers Singapour. Le premier rang des cinq destinations de la Corée du Sud est occupé par la Chine depuis 2003. Le changement le plus récent dans leur ordre remonte à 2015, quand les exportations de la Corée du Sud vers le Vietnam ont dépassé celles vers le Japon.
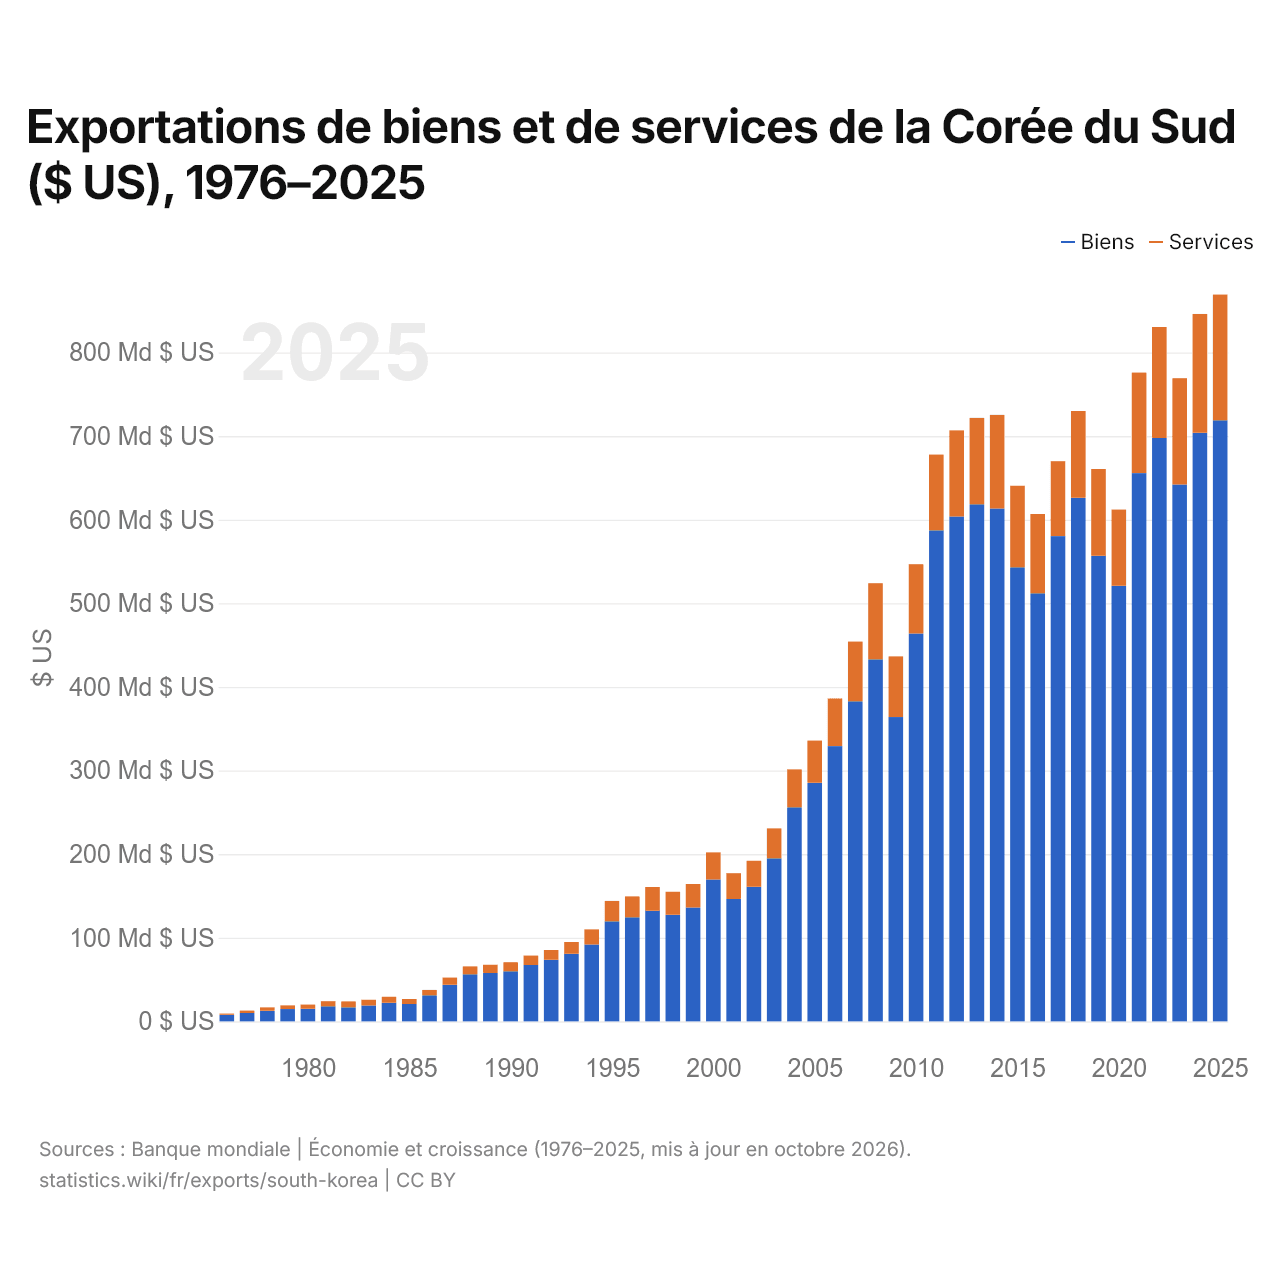
Exportations de biens et de services de la Corée du Sud ($ US), 1976–2025
| Année | $ US | |
|---|---|---|
| Biens | Services | |
| 2025 | 718 942 500 000 $ US | 150 143 500 000 $ US |
| 2024 | 703 974 800 000 $ US | 142 034 000 000 $ US |
| 2023 | 642 117 200 000 $ US | 127 041 500 000 $ US |
| 2022 | 697 755 100 000 $ US | 132 681 500 000 $ US |
| 2021 | 655 640 100 000 $ US | 120 174 100 000 $ US |
| 2020 | 520 831 800 000 $ US | 91 232 500 000 $ US |
| 2019 | 556 667 900 000 $ US | 103 838 900 000 $ US |
| 2018 | 626 266 500 000 $ US | 103 677 500 000 $ US |
| 2017 | 580 310 200 000 $ US | 89 701 300 000 $ US |
| 2016 | 511 926 100 000 $ US | 94 809 100 000 $ US |
| 2015 | 543 082 500 000 $ US | 97 498 600 000 $ US |
| 2014 | 613 396 500 000 $ US | 111 902 300 000 $ US |
| 2013 | 618 393 300 000 $ US | 103 324 200 000 $ US |
| 2012 | 603 664 800 000 $ US | 103 134 300 000 $ US |
| 2011 | 587 213 000 000 $ US | 90 559 700 000 $ US |
| 2010 | 463 834 700 000 $ US | 82 948 700 000 $ US |
| 2009 | 363 931 100 000 $ US | 72 541 300 000 $ US |
| 2008 | 432 909 600 000 $ US | 91 045 400 000 $ US |
| 2007 | 382 802 800 000 $ US | 71 413 000 000 $ US |
| 2006 | 329 110 900 000 $ US | 57 012 000 000 $ US |
| 2005 | 285 262 000 000 $ US | 50 537 700 000 $ US |
| 2004 | 256 053 700 000 $ US | 45 284 600 000 $ US |
| 2003 | 194 911 800 000 $ US | 35 760 500 000 $ US |
| 2002 | 160 956 000 000 $ US | 31 023 100 000 $ US |
| 2001 | 146 419 600 000 $ US | 30 776 600 000 $ US |
| 2000 | 169 523 600 000 $ US | 32 556 400 000 $ US |
| 1999 | 136 030 600 000 $ US | 28 226 600 000 $ US |
| 1998 | 127 539 000 000 $ US | 27 430 600 000 $ US |
| 1997 | 132 366 700 000 $ US | 28 253 600 000 $ US |
| 1996 | 124 427 400 000 $ US | 24 970 200 000 $ US |
| 1995 | 119 577 700 000 $ US | 24 424 600 000 $ US |
| 1994 | 91 980 100 000 $ US | 18 038 500 000 $ US |
| 1993 | 80 789 600 000 $ US | 14 078 900 000 $ US |
| 1992 | 73 489 000 000 $ US | 11 772 300 000 $ US |
| 1991 | 67 400 800 000 $ US | 11 197 200 000 $ US |
| 1990 | 59 861 300 000 $ US | 10 792 200 000 $ US |
| 1989 | 57 861 500 000 $ US | 9 848 100 000 $ US |
| 1988 | 56 353 000 000 $ US | 9 339 600 000 $ US |
| 1987 | 43 708 300 000 $ US | 8 559 600 000 $ US |
| 1986 | 31 160 000 000 $ US | 6 399 800 000 $ US |
| 1985 | 20 771 500 000 $ US | 5 948 300 000 $ US |
| 1984 | 22 346 100 000 $ US | 6 952 200 000 $ US |
| 1983 | 19 001 200 000 $ US | 6 862 200 000 $ US |
| 1982 | 16 687 300 000 $ US | 7 174 700 000 $ US |
| 1981 | 18 014 500 000 $ US | 6 147 300 000 $ US |
| 1980 | 15 015 300 000 $ US | 5 026 200 000 $ US |
| 1979 | 14 705 000 000 $ US | 4 392 000 000 $ US |
| 1978 | 12 711 000 000 $ US | 4 059 000 000 $ US |
| 1977 | 10 046 000 000 $ US | 2 784 000 000 $ US |
| 1976 | 7 814 000 000 $ US | 1 527 000 000 $ US |
En 2025, les exportations de biens de la Corée du Sud s'élevaient à 719 milliards de dollars et celles de services à 150 milliards de dollars ; les services représentaient 17,3 % du total, contre 16,3 % en 1976.
La Corée du Sud dans le classement mondial des exportations, 2025





Exportations de biens et services de la Corée du Sud, % du PIB, 1960–2025
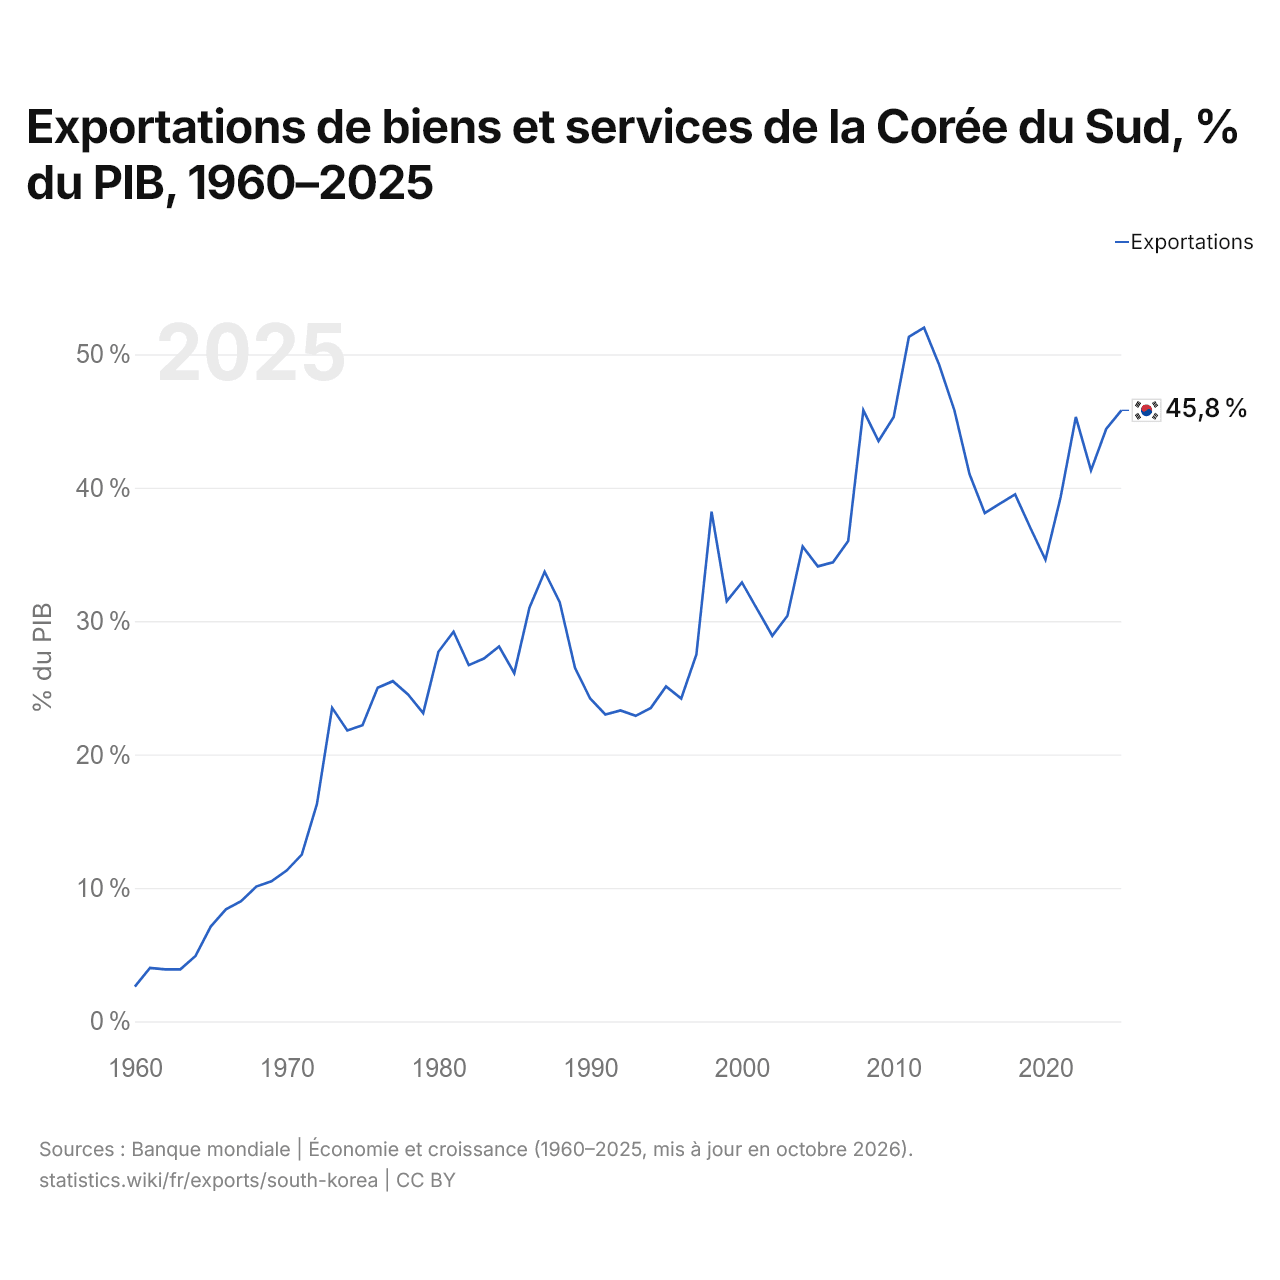
En 2025, les exportations de biens et services de la Corée du Sud équivalaient à 45,8 % de son PIB, contre 2,6 % en 1960. La part la plus élevée a été de 52,0 %, en 2012.
Comparer les exportations de la Corée du Sud avec celles d'autres pays
Sources :
- TradeMap (2001–2025, mis à jour en octobre 2026)
- Banque mondiale | Économie et croissance (1960–2025, mis à jour en octobre 2026)
Creative Commons Attribution (CC BY) : vous pouvez copier, partager, adapter et réutiliser ce contenu, y compris à des fins commerciales, à condition de citer statistics.wiki et d’indiquer les modifications apportées. Les sources citées ci-dessus peuvent avoir leurs propres conditions de licence.