
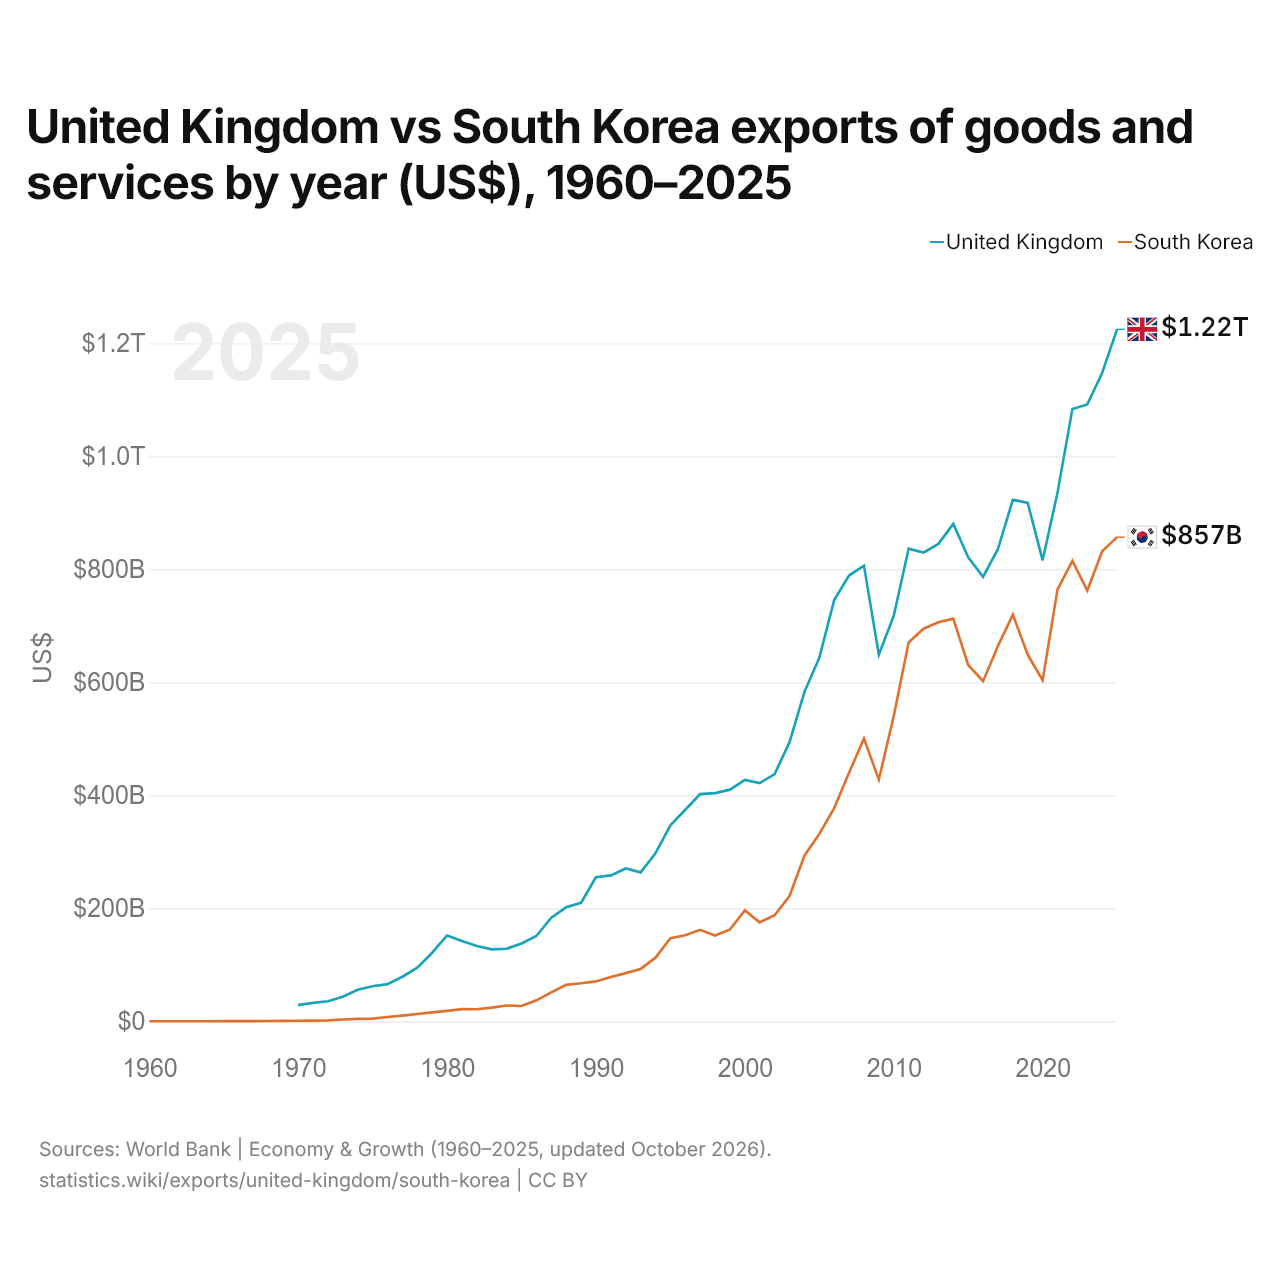
Royaume-Uni vs Corée du Sud : exportations de biens et services par année ($ US), 1960–2025
| Année | $ US | |
|---|---|---|
 Royaume-Uni |
 Corée du Sud |
|
| 2025 | 1 224 670 037 745 $ US | 856 855 674 924 $ US |
| 2024 | 1 147 692 057 155 $ US | 831 889 172 091 $ US |
| 2023 | 1 091 653 856 201 $ US | 762 299 062 736 $ US |
| 2022 | 1 083 593 172 366 $ US | 815 019 022 384 $ US |
| 2021 | 935 667 446 175 $ US | 764 083 221 346 $ US |
| 2020 | 815 801 724 784 $ US | 603 713 417 774 $ US |
| 2019 | 917 433 768 894 $ US | 648 610 576 583 $ US |
| 2018 | 922 834 772 428 $ US | 719 710 064 860 $ US |
| 2017 | 836 020 370 556 $ US | 664 392 456 663 $ US |
| 2016 | 786 640 412 454 $ US | 601 861 440 814 $ US |
| 2015 | 821 200 386 072 $ US | 630 586 518 886 $ US |
| 2014 | 880 315 812 063 $ US | 712 570 950 952 $ US |
| 2013 | 844 879 329 622 $ US | 706 343 252 061 $ US |
| 2012 | 829 500 825 757 $ US | 694 692 887 431 $ US |
| 2011 | 836 521 134 498 $ US | 670 299 926 920 $ US |
| 2010 | 717 722 225 202 $ US | 540 016 342 978 $ US |
| 2009 | 648 817 572 831 $ US | 427 737 777 325 $ US |
| 2008 | 806 393 382 353 $ US | 500 458 646 625 $ US |
| 2007 | 788 841 536 615 $ US | 440 034 853 641 $ US |
| 2006 | 745 508 739 650 $ US | 377 241 080 635 $ US |
| 2005 | 643 121 818 182 $ US | 331 627 733 441 $ US |
| 2004 | 582 770 047 602 $ US | 293 159 147 249 $ US |
| 2003 | 494 048 979 592 $ US | 221 795 023 926 $ US |
| 2002 | 437 455 035 971 $ US | 187 653 181 634 $ US |
| 2001 | 421 484 093 853 $ US | 175 166 805 500 $ US |
| 2000 | 427 199 273 718 $ US | 196 359 987 002 $ US |
| 1999 | 409 995 146 416 $ US | 162 507 811 339 $ US |
| 1998 | 403 935 077 840 $ US | 151 914 103 577 $ US |
| 1997 | 402 043 222 004 $ US | 161 870 964 161 $ US |
| 1996 | 374 382 215 289 $ US | 152 440 172 724 $ US |
| 1995 | 346 673 504 813 $ US | 147 104 275 488 $ US |
| 1994 | 297 415 469 850 $ US | 112 641 201 186 $ US |
| 1993 | 263 563 318 836 $ US | 92 739 264 964 $ US |
| 1992 | 270 419 575 290 $ US | 85 350 581 848 $ US |
| 1991 | 258 221 350 970 $ US | 78 353 503 011 $ US |
| 1990 | 255 032 436 080 $ US | 70 587 774 855 $ US |
| 1989 | 209 856 063 482 $ US | 67 308 972 534 $ US |
| 1988 | 201 778 537 887 $ US | 64 594 460 211 $ US |
| 1987 | 183 446 283 706 $ US | 51 281 992 055 $ US |
| 1986 | 150 993 144 239 $ US | 37 166 083 048 $ US |
| 1985 | 137 913 634 497 $ US | 27 098 802 326 $ US |
| 1984 | 128 434 115 456 $ US | 28 063 621 761 $ US |
| 1983 | 127 464 198 878 $ US | 24 343 720 766 $ US |
| 1982 | 133 411 221 174 $ US | 21 331 058 721 $ US |
| 1981 | 141 969 931 672 $ US | 21 668 115 701 $ US |
| 1980 | 151 948 940 274 $ US | 18 451 432 875 $ US |
| 1979 | 121 453 807 709 $ US | 15 748 140 496 $ US |
| 1978 | 95 076 914 669 $ US | 12 936 570 248 $ US |
| 1977 | 78 871 843 712 $ US | 9 969 834 711 $ US |
| 1976 | 65 841 913 747 $ US | 7 605 165 289 $ US |
| 1975 | 62 053 345 133 $ US | 4 908 057 851 $ US |
| 1974 | 55 864 677 419 $ US | 4 324 150 591 $ US |
| 1973 | 43 672 359 138 $ US | 3 309 134 300 $ US |
| 1972 | 35 438 523 976 $ US | 1 795 139 760 $ US |
| 1971 | 32 761 433 439 $ US | 1 251 053 227 $ US |
| 1970 | 28 794 190 065 $ US | 1 026 868 601 $ US |
| 1969 | - | 814 822 835 $ US |
| 1968 | - | 620 651 015 $ US |
| 1967 | - | 442 486 545 $ US |
| 1966 | - | 331 690 238 $ US |
| 1965 | - | 222 596 929 $ US |
| 1964 | - | 171 618 267 $ US |
| 1963 | - | 157 692 308 $ US |
| 1962 | - | 109 230 769 $ US |
| 1961 | - | 97 762 912 $ US |
| 1960 | - | 104 554 455 $ US |
En 2025, les exportations de biens et services du Royaume-Uni s'élevaient à 1,22 billion de dollars et celles de la Corée du Sud à 857 milliards de dollars : celles du Royaume-Uni étaient supérieures de 43 %. En 1970, les exportations du Royaume-Uni étaient 28 fois plus élevées : 28,8 milliards de dollars pour le Royaume-Uni et 1,03 milliard de dollars pour la Corée du Sud.
Les exportations de biens et services du Royaume-Uni sont supérieures à celles de la Corée du Sud chaque année depuis 1970.
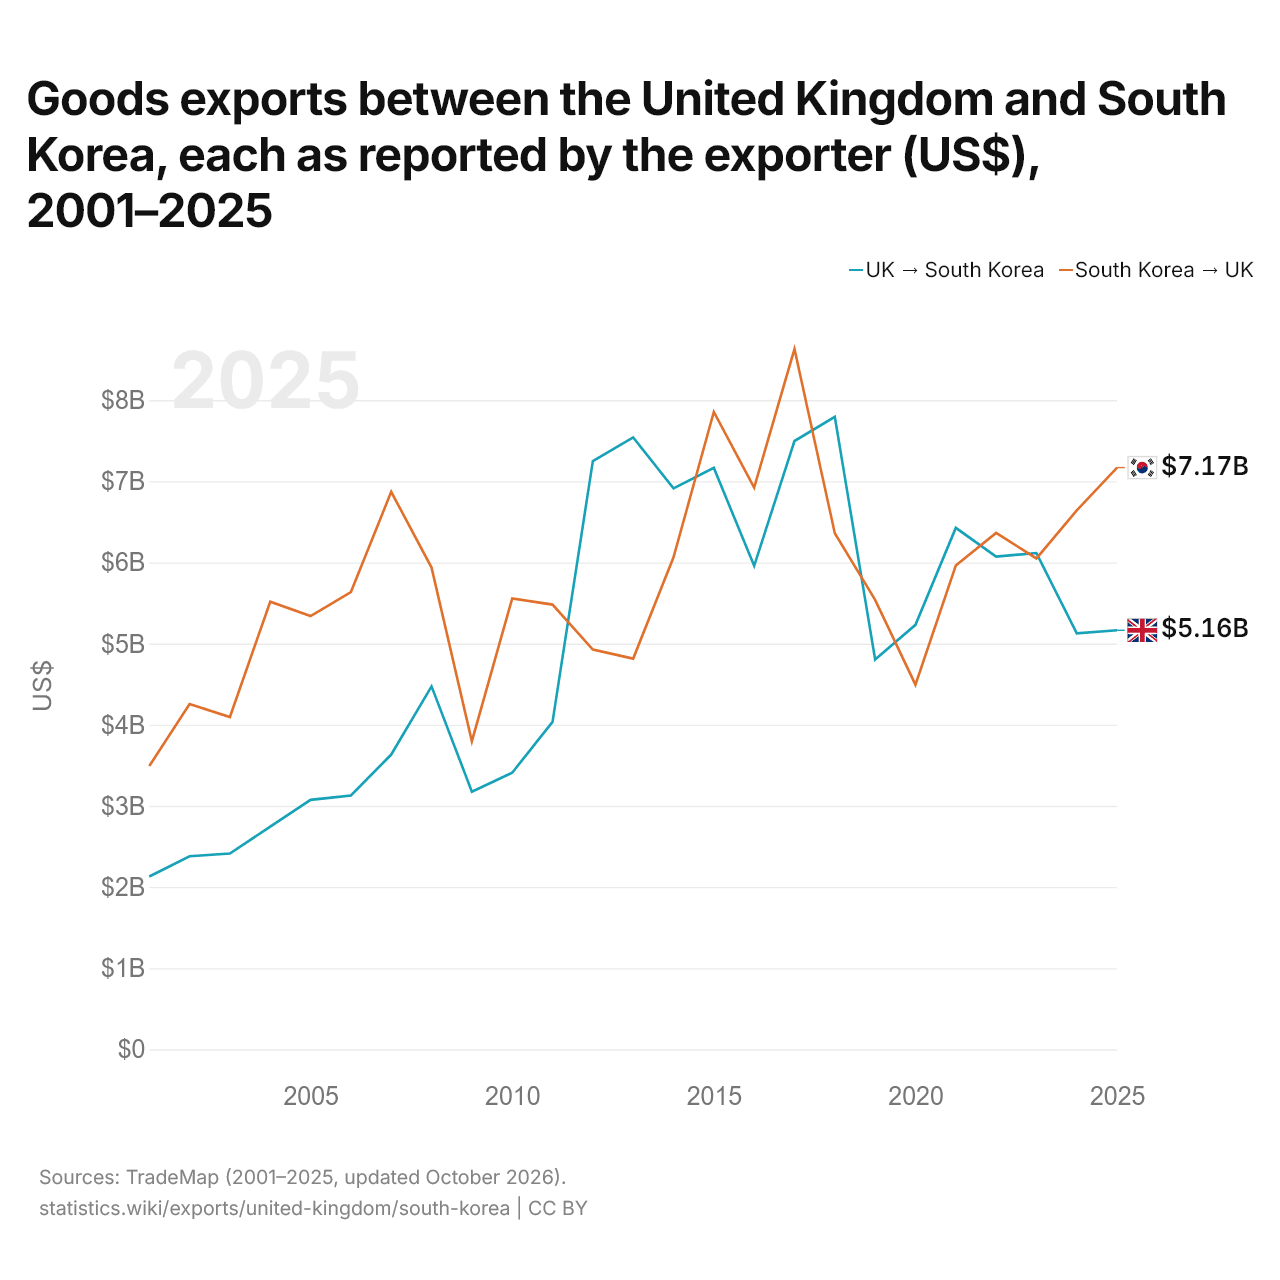
Exportations de biens entre le Royaume-Uni et la Corée du Sud, selon chaque exportateur ($ US), 2001–2025
| Année | $ US | |
|---|---|---|
| Royaume-Uni → Corée du Sud | Corée du Sud → Royaume-Uni | |
| 2025 | 5 163 688 000 $ US | 7 168 502 000 $ US |
| 2024 | 5 125 832 000 $ US | 6 642 319 000 $ US |
| 2023 | 6 115 562 000 $ US | 6 049 230 000 $ US |
| 2022 | 6 071 976 000 $ US | 6 364 526 000 $ US |
| 2021 | 6 425 762 000 $ US | 5 961 283 000 $ US |
| 2020 | 5 230 364 000 $ US | 4 492 995 000 $ US |
| 2019 | 4 804 211 000 $ US | 5 539 148 000 $ US |
| 2018 | 7 794 535 000 $ US | 6 359 378 000 $ US |
| 2017 | 7 496 263 000 $ US | 8 629 305 000 $ US |
| 2016 | 5 958 175 000 $ US | 6 922 391 000 $ US |
| 2015 | 7 164 477 000 $ US | 7 854 429 000 $ US |
| 2014 | 6 911 799 000 $ US | 6 062 358 000 $ US |
| 2013 | 7 539 887 000 $ US | 4 814 535 000 $ US |
| 2012 | 7 249 722 000 $ US | 4 925 801 000 $ US |
| 2011 | 4 035 176 000 $ US | 5 479 934 000 $ US |
| 2010 | 3 408 226 000 $ US | 5 555 074 000 $ US |
| 2009 | 3 175 452 000 $ US | 3 796 533 000 $ US |
| 2008 | 4 473 026 000 $ US | 5 936 115 000 $ US |
| 2007 | 3 632 213 000 $ US | 6 870 005 000 $ US |
| 2006 | 3 128 115 000 $ US | 5 634 713 000 $ US |
| 2005 | 3 073 937 000 $ US | 5 338 844 000 $ US |
| 2004 | 2 744 468 000 $ US | 5 515 983 000 $ US |
| 2003 | 2 412 538 000 $ US | 4 094 242 000 $ US |
| 2002 | 2 379 302 000 $ US | 4 255 459 000 $ US |
| 2001 | 2 129 730 000 $ US | 3 489 988 000 $ US |
En 2025, les exportations de biens du Royaume-Uni vers la Corée du Sud, selon le Royaume-Uni, s'élevaient à 5,16 milliards de dollars, et celles de la Corée du Sud vers le Royaume-Uni, selon la Corée du Sud, à 7,17 milliards de dollars : 39 % de plus pour celles de la Corée du Sud. En 2001, elles s'élevaient à 2,13 milliards de dollars pour le Royaume-Uni et à 3,49 milliards de dollars pour la Corée du Sud.
Royaume-Uni vs Corée du Sud : chiffres des exportations
|
Royaume-Uni
|
Corée du Sud
|
|
|---|---|---|
| Exportations | 1,22 Bn $US (2025) | 857 Md $US (2025) |
| Rang mondial | 4/176 | 11/176 |
| Part mondiale | 3,51 % | 2,46 % |
| % du PIB | 30,6 % | 45,8 % |
| Première catégorie de biens | Machines, électronique et véhicules (39,9 %, 2025) | Machines, électronique et véhicules (65,3 %, 2025) |
| Première destination des biens | États-Unis (15,8 %, 2025) | Chine (18,4 %, 2025) |
Comparer les exportations de 2 pays au choix
Sources :
- Banque mondiale | Économie et croissance (1960–2025, mis à jour en octobre 2026)
- TradeMap (2001–2025, mis à jour en octobre 2026)
Creative Commons Attribution (CC BY) : vous pouvez copier, partager, adapter et réutiliser ce contenu, y compris à des fins commerciales, à condition de citer statistics.wiki et d’indiquer les modifications apportées. Les sources citées ci-dessus peuvent avoir leurs propres conditions de licence.