
Exportations de biens et services du Mexique par année ($ US), 1960–2025
| Année | $ US | Rang mondial |
|---|---|---|
| Exportations | Rang mondial | |
| 2025 | 726 556 896 247 $ US | #15 |
| 2024 | 682 472 609 894 $ US | #15 |
| 2023 | 648 642 274 777 $ US | #15 |
| 2022 | 629 788 673 074 $ US | #16 |
| 2021 | 534 121 610 565 $ US | #17 |
| 2020 | 439 853 932 828 $ US | #15 |
| 2019 | 502 467 566 320 $ US | #14 |
| 2018 | 490 508 969 545 $ US | #17 |
| 2017 | 446 688 309 687 $ US | #16 |
| 2016 | 409 476 294 705 $ US | #15 |
| 2015 | 414 495 031 034 $ US | #14 |
| 2014 | 429 314 956 761 $ US | #16 |
| 2013 | 408 263 658 324 $ US | #17 |
| 2012 | 395 854 929 793 $ US | #18 |
| 2011 | 374 148 226 662 $ US | #19 |
| 2010 | 320 766 037 581 $ US | #18 |
| 2009 | 250 136 106 516 $ US | #18 |
| 2008 | 313 852 456 087 $ US | #18 |
| 2007 | 295 222 517 229 $ US | #17 |
| 2006 | 270 928 816 793 $ US | #16 |
| 2005 | 233 862 215 739 $ US | #16 |
| 2004 | 205 711 767 188 $ US | #16 |
| 2003 | 181 095 388 469 $ US | #15 |
| 2002 | 177 144 829 752 $ US | #13 |
| 2001 | 171 481 946 818 $ US | #12 |
| 2000 | 179 810 168 051 $ US | #12 |
| 1999 | 147 818 774 072 $ US | #14 |
| 1998 | 129 452 220 228 $ US | #16 |
| 1997 | 121 731 183 210 $ US | #16 |
| 1996 | 106 842 978 990 $ US | #16 |
| 1995 | 86 926 529 245 $ US | #18 |
| 1994 | 70 611 769 311 $ US | #18 |
| 1993 | 61 477 360 985 $ US | #18 |
| 1992 | 55 406 062 494 $ US | #20 |
| 1991 | 51 459 461 044 $ US | #21 |
| 1990 | 48 866 118 135 $ US | #20 |
| 1989 | 42 359 282 023 $ US | #19 |
| 1988 | 36 496 678 772 $ US | #20 |
| 1987 | 27 349 325 162 $ US | #22 |
| 1986 | 22 446 879 807 $ US | #23 |
| 1985 | 28 439 428 976 $ US | #16 |
| 1984 | 30 521 772 291 $ US | #16 |
| 1983 | 28 289 706 397 $ US | #15 |
| 1982 | 26 632 371 193 $ US | #15 |
| 1981 | 26 014 603 304 $ US | #17 |
| 1980 | 20 850 899 743 $ US | #25 |
| 1979 | 15 052 992 765 $ US | #27 |
| 1978 | 10 748 302 367 $ US | #28 |
| 1977 | 8 452 576 086 $ US | #29 |
| 1976 | 7 545 416 829 $ US | #28 |
| 1975 | 6 067 120 000 $ US | #29 |
| 1974 | 6 054 240 000 $ US | #29 |
| 1973 | 4 650 160 000 $ US | #24 |
| 1972 | 3 643 200 000 $ US | #21 |
| 1971 | 2 995 040 000 $ US | #22 |
| 1970 | 2 754 440 000 $ US | #19 |
| 1969 | 2 451 096 000 $ US | - |
| 1968 | 2 066 336 000 $ US | - |
| 1967 | 1 824 072 000 $ US | - |
| 1966 | 1 816 952 000 $ US | - |
| 1965 | 1 667 320 000 $ US | - |
| 1964 | 1 532 720 000 $ US | - |
| 1963 | 1 411 096 000 $ US | - |
| 1962 | 1 302 504 000 $ US | - |
| 1961 | 1 191 208 000 $ US | - |
| 1960 | 1 109 120 000 $ US | - |
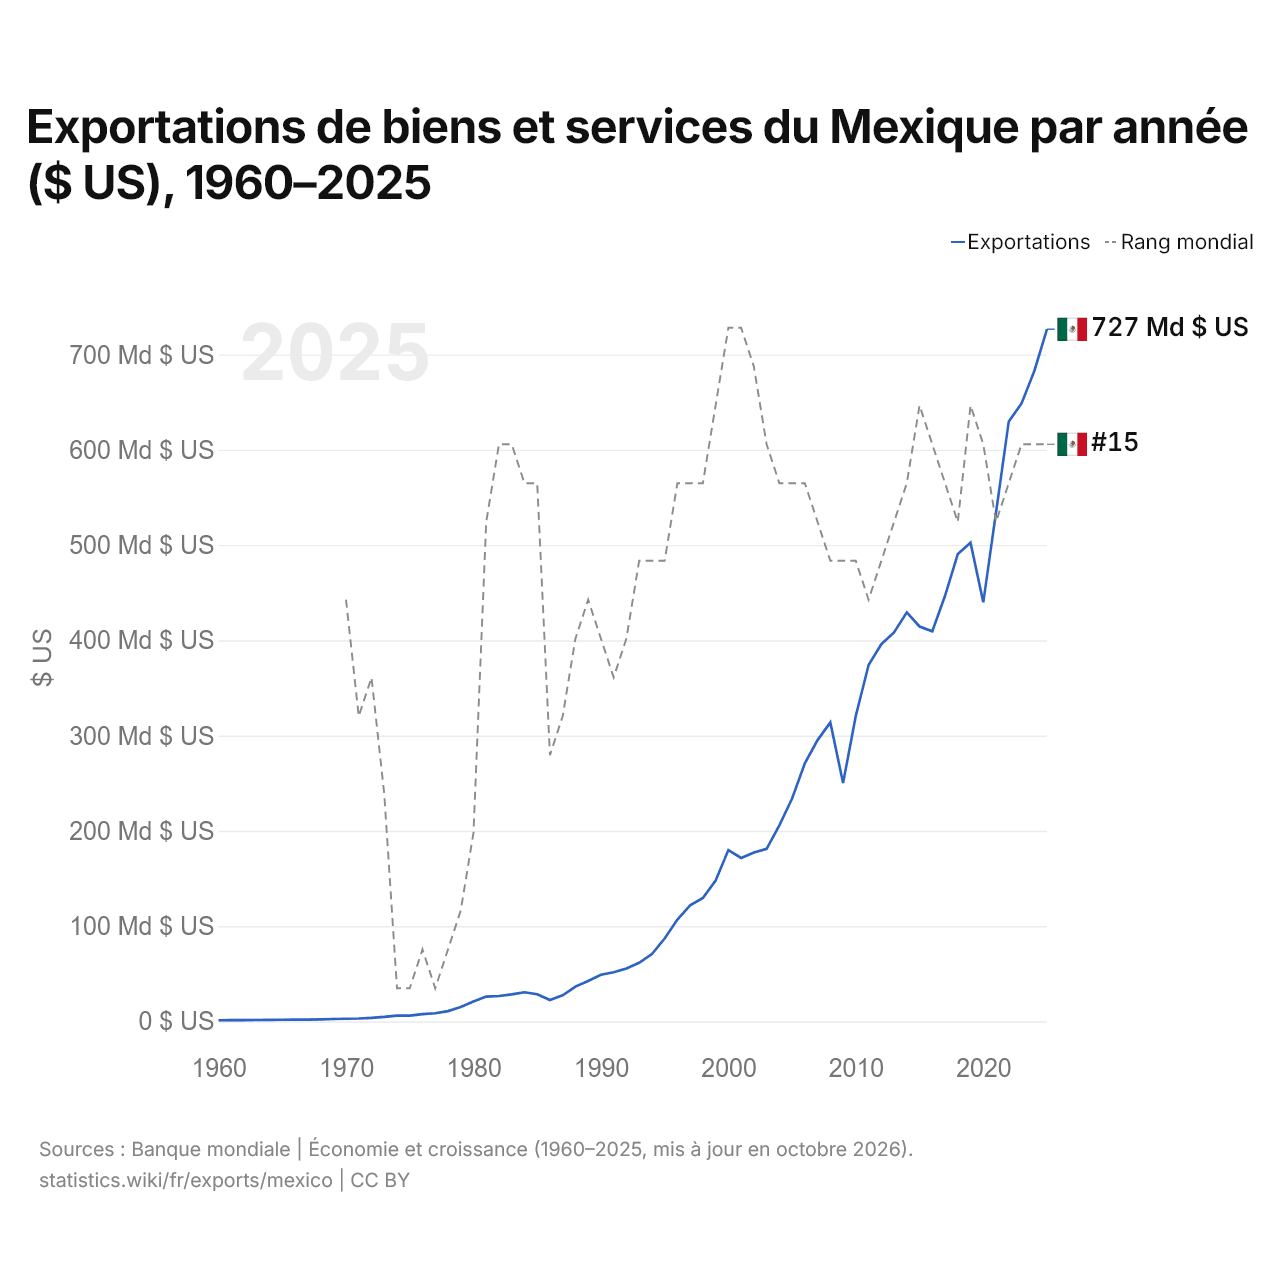
En 2025, les exportations de biens et services du Mexique s'élevaient à 727 milliards de dollars, contre 1,11 milliard de dollars en 1960. Elles se classaient au 15e rang mondial, un rang qu'elles occupent depuis 2023. Leur meilleur rang a été le 12e, occupé pour la dernière fois en 2001.
En 2025, les exportations de biens et services du Mexique étaient les plus élevées de 27 pays situés en Amérique latine. Les importations de biens et services du Mexique s'élevaient à 738 milliards de dollars en 2025, au 13e rang mondial. En 2025, les importations du Mexique dépassaient ses exportations de 11,6 milliards de dollars, soit un déficit commercial.
Exportations de biens du Mexique par catégorie, 2025
Exportations de biens, 2025: 666 Md $US
En 2025, la première catégorie des exportations de biens du Mexique était « machines, électronique et véhicules », avec 70,3 %, suivie de « pétrole, gaz, minerais et autres matières premières », avec 6,3 %.
Destinations des exportations de biens du Mexique : les 10 premières, 2025
| Rang | Pays | Exportations de biens | Part | |
|---|---|---|---|---|
| 1 |
 États-Unis |
545 Md $US | 81,9 % | vs USA |
| 2 |
 Canada |
21,9 Md $US | 3,3 % | vs Canada |
| 3 |
 Chine |
9,92 Md $US | 1,49 % | vs Chine |
| 4 |
 Allemagne |
7,72 Md $US | 1,16 % | |
| 5 |
 Corée du Sud |
5,30 Md $US | 0,8 % | vs Corée du Sud |
| 6 |
 Brésil |
4,45 Md $US | 0,67 % | vs Brésil |
| 7 |
 Japon |
4,03 Md $US | 0,61 % | vs Japon |
| 8 |
 Royaume-Uni |
3,80 Md $US | 0,57 % | |
| 9 |
 Colombie |
3,14 Md $US | 0,47 % | vs Colombie |
| 10 |
 Guatemala |
2,85 Md $US | 0,43 % | vs Guatemala |
| Autres partenaires et non précisés | 57,4 Md $US | 8,62 % |
Exportations de biens du Mexique vers ses 5 principales destinations ($ US), 2001–2025
| Année | $ US | ||||
|---|---|---|---|---|---|
| États-Unis | Canada | Chine | Allemagne | Corée du Sud | |
| 2025 | 545 387 806 000 $ US | 21 947 946 000 $ US | 9 916 493 000 $ US | 7 721 387 000 $ US | 5 295 351 000 $ US |
| 2024 | 503 418 271 000 $ US | 18 614 316 000 $ US | 9 075 970 000 $ US | 7 133 909 000 $ US | 4 065 202 000 $ US |
| 2023 | 475 203 155 000 $ US | 17 731 076 000 $ US | 9 151 480 000 $ US | 8 746 321 000 $ US | 3 806 882 000 $ US |
| 2022 | 454 414 165 000 $ US | 15 401 843 000 $ US | 10 805 795 000 $ US | 8 244 694 000 $ US | 3 690 575 000 $ US |
| 2021 | 386 168 160 000 $ US | 12 899 239 000 $ US | 9 080 418 000 $ US | 7 427 284 000 $ US | 3 308 694 000 $ US |
| 2020 | 330 433 646 000 $ US | 11 138 782 000 $ US | 7 787 692 000 $ US | 6 584 726 000 $ US | 3 429 895 000 $ US |
| 2019 | 358 638 540 000 $ US | 14 256 339 000 $ US | 6 911 310 000 $ US | 7 093 991 000 $ US | 2 212 122 000 $ US |
| 2018 | 344 915 168 000 $ US | 14 085 955 000 $ US | 7 197 723 000 $ US | 7 071 220 000 $ US | 2 283 923 000 $ US |
| 2017 | 327 375 073 000 $ US | 11 376 542 000 $ US | 6 711 708 000 $ US | 6 952 001 000 $ US | 3 428 837 000 $ US |
| 2016 | 302 971 281 000 $ US | 10 427 799 000 $ US | 5 405 455 000 $ US | 3 950 551 000 $ US | 2 502 280 000 $ US |
| 2015 | 309 191 752 000 $ US | 10 546 936 000 $ US | 4 881 293 000 $ US | 3 510 781 000 $ US | 2 770 289 000 $ US |
| 2014 | 318 652 628 000 $ US | 10 689 971 000 $ US | 5 951 529 000 $ US | 3 588 694 000 $ US | 2 025 545 000 $ US |
| 2013 | 299 486 781 000 $ US | 10 414 226 000 $ US | 6 468 491 000 $ US | 3 711 559 000 $ US | 1 525 323 000 $ US |
| 2012 | 288 176 389 000 $ US | 10 927 229 000 $ US | 5 720 739 000 $ US | 4 484 348 000 $ US | 1 726 592 000 $ US |
| 2011 | 274 720 113 000 $ US | 10 694 123 000 $ US | 5 964 233 000 $ US | 4 314 505 000 $ US | 1 521 780 000 $ US |
| 2010 | 238 858 912 000 $ US | 10 663 920 000 $ US | 4 195 900 000 $ US | 3 556 249 000 $ US | 928 781 000 $ US |
| 2009 | 185 448 519 000 $ US | 8 236 476 000 $ US | 2 207 793 000 $ US | 3 191 053 000 $ US | 498 752 000 $ US |
| 2008 | 233 793 948 000 $ US | 7 083 682 000 $ US | 2 044 757 000 $ US | 4 998 082 000 $ US | 537 605 000 $ US |
| 2007 | 223 387 835 000 $ US | 6 477 823 000 $ US | 1 895 016 000 $ US | 4 102 058 000 $ US | 680 568 000 $ US |
| 2006 | 212 131 773 000 $ US | 5 176 224 000 $ US | 1 688 112 000 $ US | 2 971 347 000 $ US | 457 495 000 $ US |
| 2005 | 183 837 713 000 $ US | 4 234 478 000 $ US | 1 135 551 000 $ US | 2 288 762 000 $ US | 241 842 000 $ US |
| 2004 | 166 533 178 000 $ US | 2 780 863 000 $ US | 473 738 000 $ US | 1 921 905 000 $ US | 110 780 000 $ US |
| 2003 | 144 696 717 000 $ US | 3 021 758 000 $ US | 974 276 000 $ US | 1 714 688 000 $ US | 181 410 000 $ US |
| 2002 | 137 963 057 000 $ US | 3 010 075 000 $ US | 653 735 000 $ US | 1 155 869 000 $ US | 161 846 000 $ US |
| 2001 | 136 373 542 000 $ US | 3 254 291 000 $ US | 384 785 000 $ US | 1 500 467 000 $ US | 208 509 000 $ US |
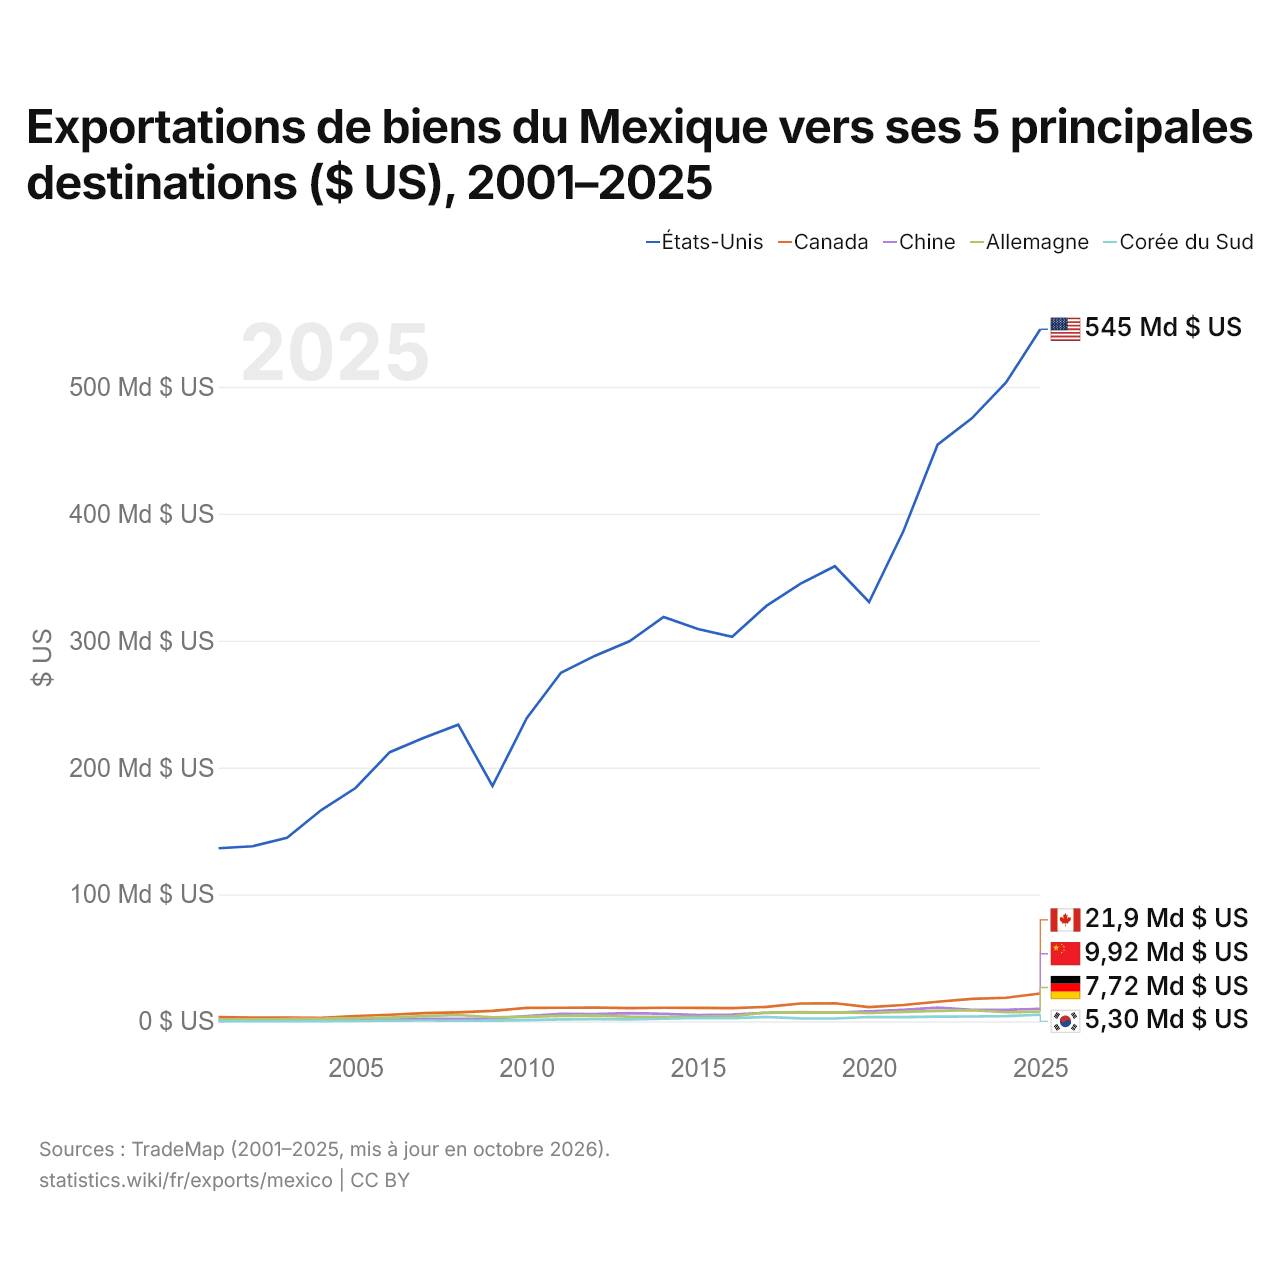
En 2025, les exportations de biens s'élevaient à 545 milliards de dollars vers les États-Unis, 21,9 milliards de dollars vers le Canada, 9,92 milliards de dollars vers la Chine, 7,72 milliards de dollars vers l'Allemagne et 5,3 milliards de dollars vers la Corée du Sud. Le premier rang des cinq destinations du Mexique est occupé par les États-Unis chaque année depuis 2001. Le changement le plus récent dans leur ordre remonte à 2020, quand les exportations du Mexique vers la Chine ont dépassé celles vers l'Allemagne.
Exportations de biens et de services du Mexique ($ US), 1979–2025
| Année | $ US | |
|---|---|---|
| Biens | Services | |
| 2025 | 665 027 226 876 $ US | 65 801 982 384 $ US |
| 2024 | 618 435 232 730 $ US | 64 263 051 895 $ US |
| 2023 | 593 569 441 231 $ US | 57 689 430 663 $ US |
| 2022 | 578 185 426 317 $ US | 53 274 649 902 $ US |
| 2021 | 495 274 226 352 $ US | 42 439 681 753 $ US |
| 2020 | 417 322 823 429 $ US | 28 536 400 267 $ US |
| 2019 | 460 939 573 417 $ US | 44 162 604 504 $ US |
| 2018 | 451 082 234 752 $ US | 40 220 929 898 $ US |
| 2017 | 409 806 219 300 $ US | 38 044 295 597 $ US |
| 2016 | 374 310 523 215 $ US | 34 110 389 685 $ US |
| 2015 | 380 982 474 705 $ US | 32 826 102 860 $ US |
| 2014 | 397 651 459 688 $ US | 31 256 384 304 $ US |
| 2013 | 380 728 973 894 $ US | 27 401 788 342 $ US |
| 2012 | 371 441 826 319 $ US | 24 715 602 195 $ US |
| 2011 | 350 004 053 453 $ US | 23 590 286 796 $ US |
| 2010 | 298 859 823 180 $ US | 22 120 170 269 $ US |
| 2009 | 229 975 039 438 $ US | 20 843 206 149 $ US |
| 2008 | 291 886 300 717 $ US | 24 351 292 291 $ US |
| 2007 | 272 292 994 548 $ US | 22 987 784 797 $ US |
| 2006 | 250 319 042 626 $ US | 20 421 208 873 $ US |
| 2005 | 214 632 858 400 $ US | 19 449 906 166 $ US |
| 2004 | 188 294 095 434 $ US | 17 255 671 219 $ US |
| 2003 | 164 986 069 660 $ US | 15 841 394 747 $ US |
| 2002 | 161 277 870 040 $ US | 15 571 205 713 $ US |
| 2001 | 159 035 089 820 $ US | 12 445 653 030 $ US |
| 2000 | 166 395 943 680 $ US | 13 480 171 279 $ US |
| 1999 | 136 560 128 840 $ US | 11 535 687 160 $ US |
| 1998 | 117 737 698 640 $ US | 11 462 636 360 $ US |
| 1997 | 64 863 400 000 $ US | 19 455 818 000 $ US |
| 1996 | 58 788 200 000 $ US | 16 582 678 000 $ US |
| 1995 | 48 438 290 000 $ US | 14 704 000 000 $ US |
| 1994 | 34 612 960 000 $ US | 16 124 310 000 $ US |
| 1993 | 30 031 000 000 $ US | 14 929 000 000 $ US |
| 1992 | 27 516 000 000 $ US | 14 018 000 000 $ US |
| 1991 | 26 855 000 000 $ US | 12 919 000 000 $ US |
| 1990 | 26 838 000 000 $ US | 11 646 000 000 $ US |
| 1989 | 22 842 000 000 $ US | 10 209 000 000 $ US |
| 1988 | 20 547 000 000 $ US | 8 421 000 000 $ US |
| 1987 | 20 495 000 000 $ US | 7 034 000 000 $ US |
| 1986 | 16 158 000 000 $ US | 5 885 000 000 $ US |
| 1985 | 21 664 000 000 $ US | 6 077 000 000 $ US |
| 1984 | 24 196 000 000 $ US | 5 996 000 000 $ US |
| 1983 | 22 312 000 000 $ US | 4 905 000 000 $ US |
| 1982 | 21 230 000 000 $ US | 4 988 000 000 $ US |
| 1981 | 20 101 000 000 $ US | 5 960 000 000 $ US |
| 1980 | 15 511 000 000 $ US | 5 364 000 000 $ US |
| 1979 | 9 301 000 000 $ US | 5 880 000 000 $ US |
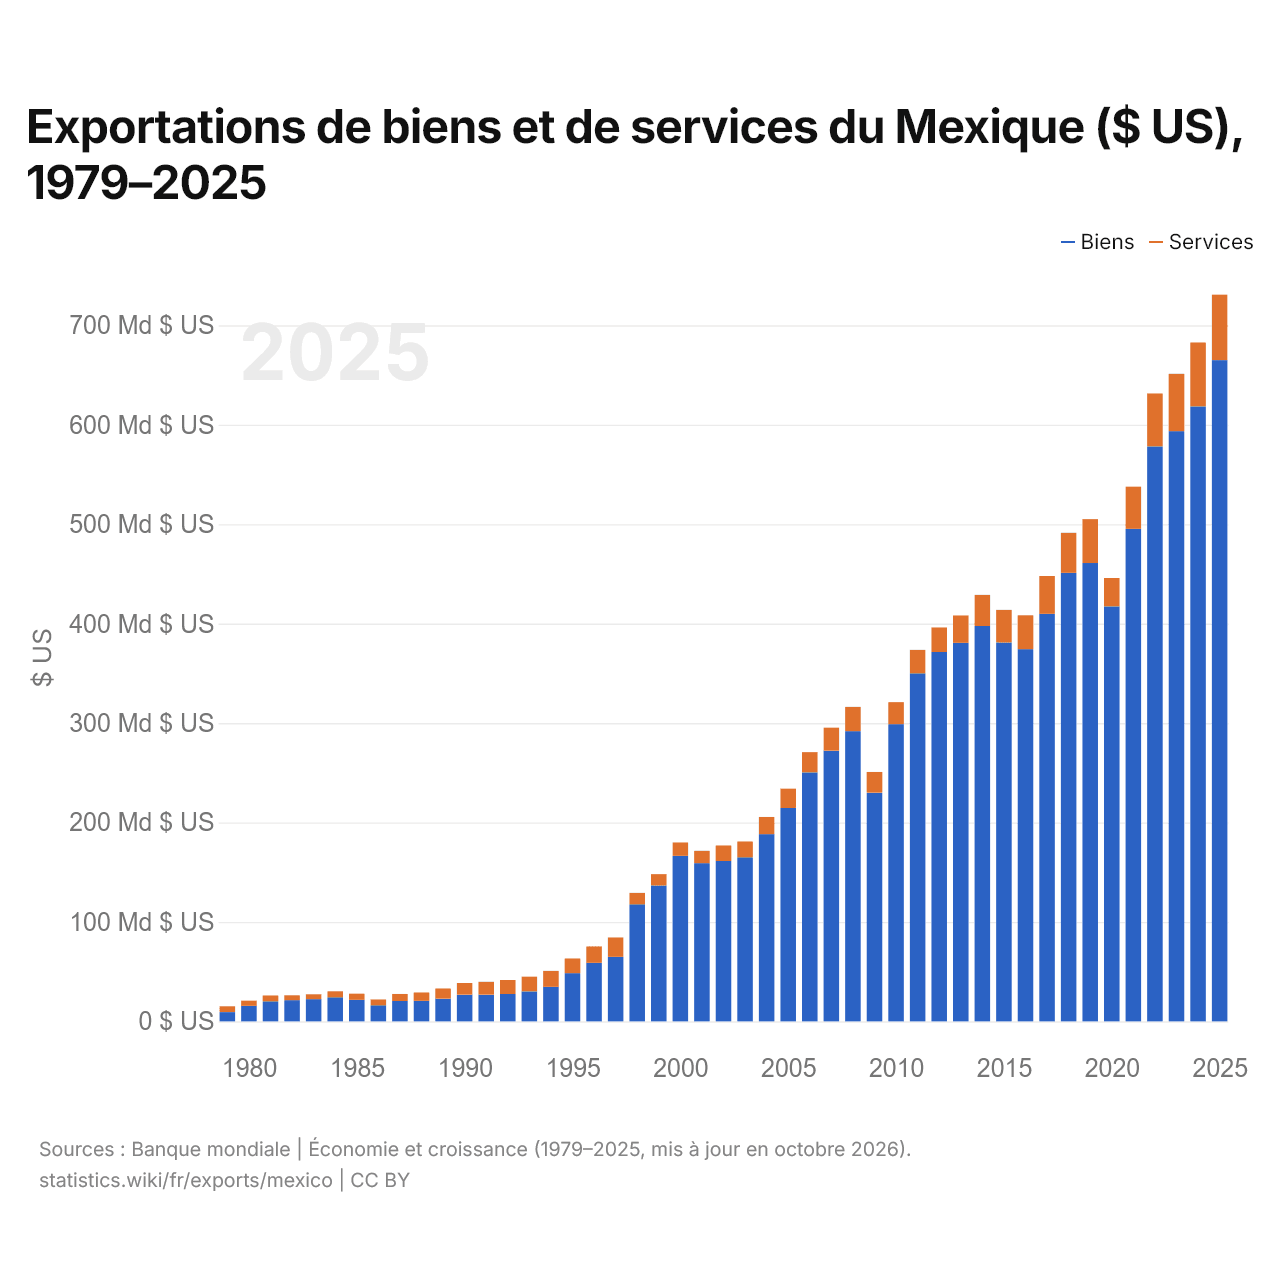
En 2025, les exportations de biens du Mexique s'élevaient à 665 milliards de dollars et celles de services à 65,8 milliards de dollars ; les services représentaient 9,0 % du total, contre 38,7 % en 1979.
Le Mexique dans le classement mondial des exportations, 2025






Exportations de biens et services du Mexique, % du PIB, 1960–2025
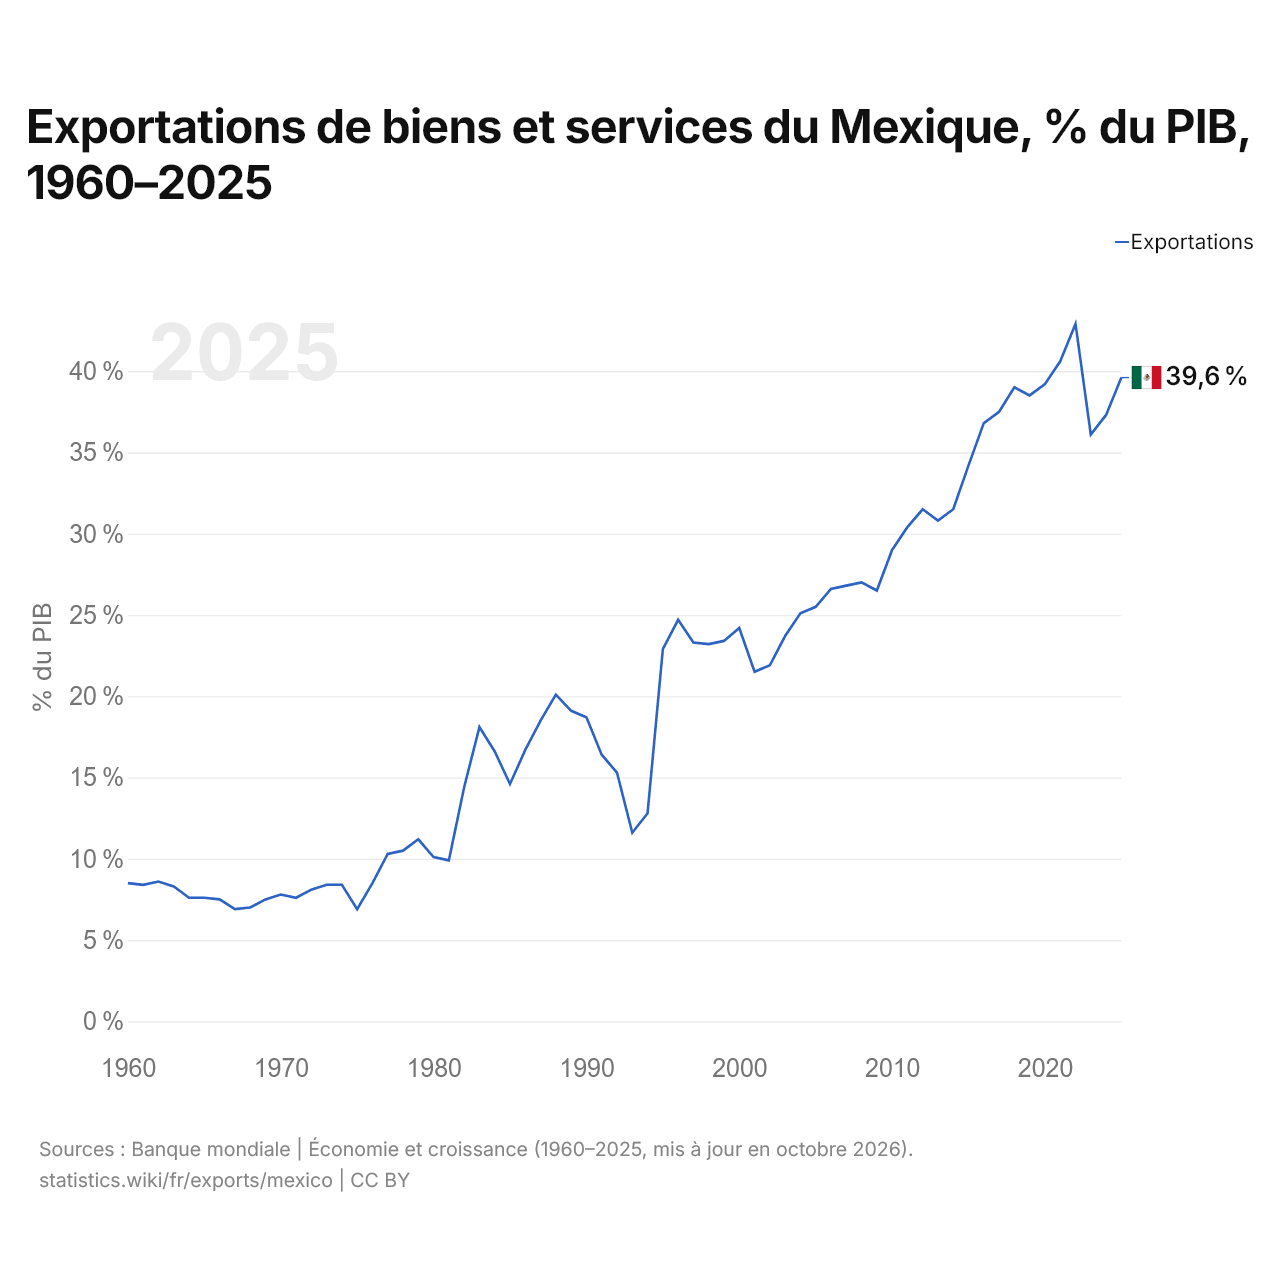
En 2025, les exportations de biens et services du Mexique équivalaient à 39,6 % de son PIB, contre 8,5 % en 1960. La part la plus élevée a été de 42,9 %, en 2022.
Comparer les exportations du Mexique avec celles d'autres pays
Sources :
- Banque mondiale | Économie et croissance (1960–2025, mis à jour en octobre 2026)
- TradeMap (2001–2025, mis à jour en octobre 2026)
Creative Commons Attribution (CC BY) : vous pouvez copier, partager, adapter et réutiliser ce contenu, y compris à des fins commerciales, à condition de citer statistics.wiki et d’indiquer les modifications apportées. Les sources citées ci-dessus peuvent avoir leurs propres conditions de licence.