
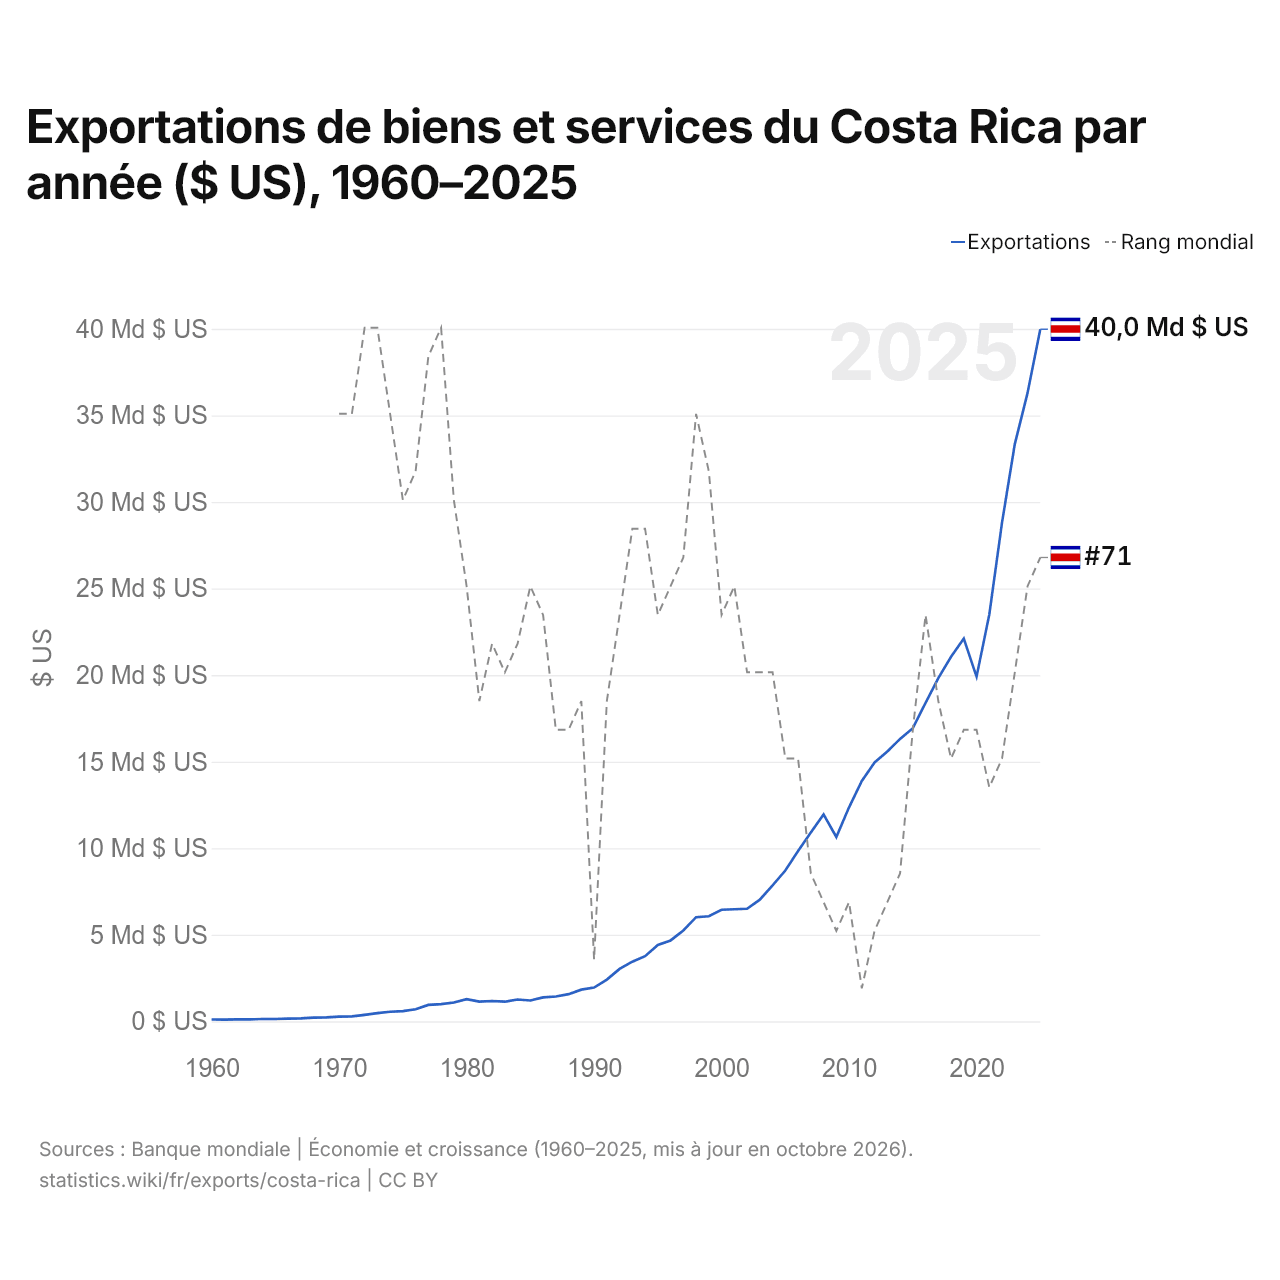
Exportations de biens et services du Costa Rica par année ($ US), 1960–2025
| Année | $ US | Rang mondial |
|---|---|---|
| Exportations | Rang mondial | |
| 2025 | 39 978 465 048 $ US | #71 |
| 2024 | 36 297 226 371 $ US | #72 |
| 2023 | 33 338 594 301 $ US | #75 |
| 2022 | 28 818 553 202 $ US | #78 |
| 2021 | 23 500 424 108 $ US | #79 |
| 2020 | 19 908 254 024 $ US | #77 |
| 2019 | 22 111 572 605 $ US | #77 |
| 2018 | 21 059 634 002 $ US | #78 |
| 2017 | 19 826 679 945 $ US | #76 |
| 2016 | 18 395 634 880 $ US | #73 |
| 2015 | 16 930 125 548 $ US | #77 |
| 2014 | 16 313 862 317 $ US | #82 |
| 2013 | 15 586 344 042 $ US | #83 |
| 2012 | 14 949 441 129 $ US | #84 |
| 2011 | 13 886 077 252 $ US | #86 |
| 2010 | 12 363 102 243 $ US | #83 |
| 2009 | 10 647 949 474 $ US | #84 |
| 2008 | 11 953 067 157 $ US | #83 |
| 2007 | 10 910 386 112 $ US | #82 |
| 2006 | 9 839 017 115 $ US | #78 |
| 2005 | 8 710 569 599 $ US | #78 |
| 2004 | 7 855 095 563 $ US | #75 |
| 2003 | 7 024 720 815 $ US | #75 |
| 2002 | 6 502 965 372 $ US | #75 |
| 2001 | 6 471 720 133 $ US | #72 |
| 2000 | 6 445 399 591 $ US | #73 |
| 1999 | 6 066 566 788 $ US | #68 |
| 1998 | 6 015 987 791 $ US | #66 |
| 1997 | 5 248 818 573 $ US | #71 |
| 1996 | 4 672 770 208 $ US | #72 |
| 1995 | 4 414 827 145 $ US | #73 |
| 1994 | 3 764 266 335 $ US | #70 |
| 1993 | 3 446 894 131 $ US | #70 |
| 1992 | 3 027 087 740 $ US | #73 |
| 1991 | 2 410 493 038 $ US | #76 |
| 1990 | 1 952 841 381 $ US | #85 |
| 1989 | 1 830 043 151 $ US | #76 |
| 1988 | 1 570 096 319 $ US | #77 |
| 1987 | 1 433 877 649 $ US | #77 |
| 1986 | 1 384 953 405 $ US | #73 |
| 1985 | 1 204 104 950 $ US | #72 |
| 1984 | 1 258 545 325 $ US | #74 |
| 1983 | 1 134 010 090 $ US | #75 |
| 1982 | 1 175 167 518 $ US | #74 |
| 1981 | 1 135 276 476 $ US | #76 |
| 1980 | 1 279 264 877 $ US | #72 |
| 1979 | 1 086 476 079 $ US | #69 |
| 1978 | 992 882 147 $ US | #63 |
| 1977 | 948 424 737 $ US | #64 |
| 1976 | 697 444 574 $ US | #68 |
| 1975 | 589 474 912 $ US | #69 |
| 1974 | 552 345 523 $ US | #66 |
| 1973 | 470 906 267 $ US | #63 |
| 1972 | 374 287 867 $ US | #63 |
| 1971 | 288 612 768 $ US | #66 |
| 1970 | 274 128 302 $ US | #66 |
| 1969 | 227 033 962 $ US | - |
| 1968 | 214 867 925 $ US | - |
| 1967 | 174 037 736 $ US | - |
| 1966 | 160 407 547 $ US | - |
| 1965 | 133 796 226 $ US | - |
| 1964 | 132 494 248 $ US | - |
| 1963 | 113 065 969 $ US | - |
| 1962 | 108 885 581 $ US | - |
| 1961 | 102 289 846 $ US | - |
| 1960 | 107 517 343 $ US | - |
En 2025, les exportations de biens et services du Costa Rica s'élevaient à 40 milliards de dollars, contre 108 millions de dollars en 1960. Le minimum a été de 102 millions de dollars, en 1961. Elles se classaient au 71e rang mondial, en hausse par rapport au 72e rang en 2024. Leur meilleur rang a été le 63e, occupé pour la dernière fois en 1978.
En 2025, les exportations de biens et services du Costa Rica étaient les 8es plus élevées de 27 pays situés en Amérique latine. Les importations de biens et services du Costa Rica s'élevaient à 33,6 milliards de dollars en 2025, au 78e rang mondial. En 2025, les exportations du Costa Rica dépassaient ses importations de 6,39 milliards de dollars, soit un excédent commercial.
Exportations de biens du Costa Rica par catégorie, 2025
Exportations de biens, 2025: 22,6 Md $US
En 2025, la première catégorie des exportations de biens du Costa Rica était « machines, électronique et véhicules », avec 53,8 %, suivie de « cultures, plantes et fleurs (céréales, fruits, légumes, café, oléagineux) », avec 16,2 %.
Destinations des exportations de biens du Costa Rica : les 10 premières, 2025
| Rang | Pays | Exportations de biens | Part | |
|---|---|---|---|---|
| 1 |
 États-Unis |
10,8 Md $US | 47,8 % | |
| 2 |
 Pays-Bas |
2,21 Md $US | 9,77 % | |
| 3 |
 Belgique |
1,08 Md $US | 4,79 % | |
| 4 |
 Guatemala |
1,04 Md $US | 4,6 % | |
| 5 |
 Nicaragua |
818 M $US | 3,61 % | |
| 6 |
 Honduras |
685 M $US | 3,03 % | |
| 7 |
 Panama |
613 M $US | 2,71 % | vs Panama |
| 8 |
 Salvador |
533 M $US | 2,35 % | vs Salvador |
| 9 |
 Chine |
449 M $US | 1,98 % | |
| 10 |
 Japon |
414 M $US | 1,83 % | |
| Autres partenaires et non précisés | 3,96 Md $US | 17,5 % |
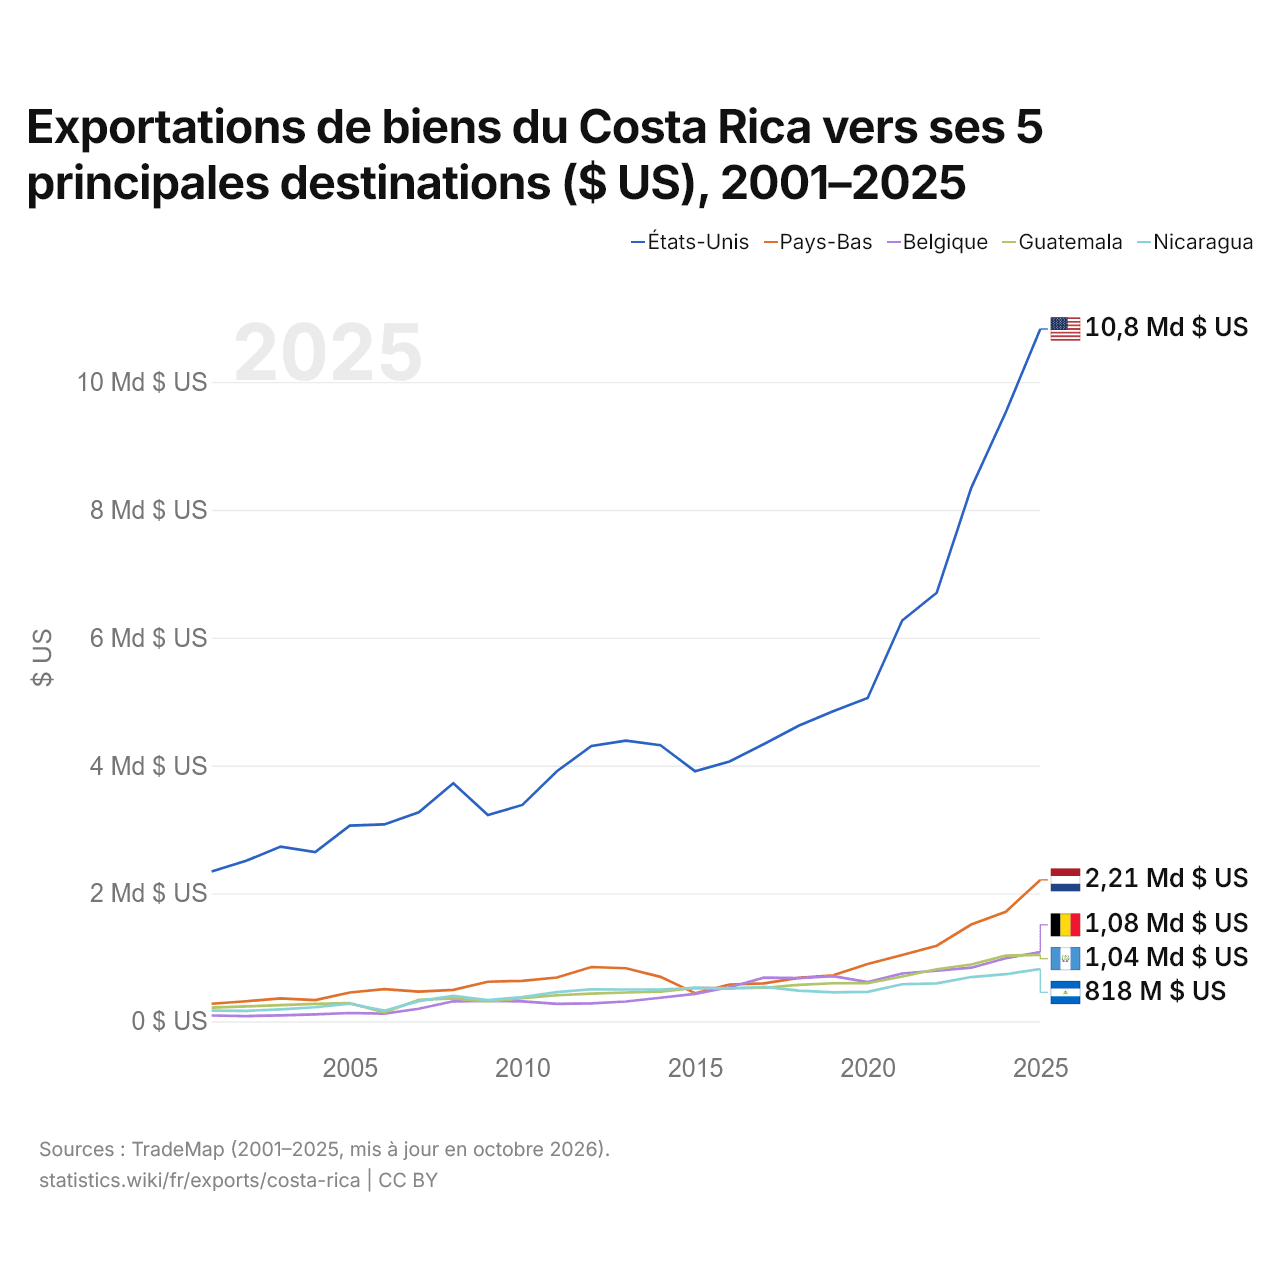
Exportations de biens du Costa Rica vers ses 5 principales destinations ($ US), 2001–2025
| Année | $ US | ||||
|---|---|---|---|---|---|
| États-Unis | Pays-Bas | Belgique | Guatemala | Nicaragua | |
| 2025 | 10 828 099 000 $ US | 2 212 232 000 $ US | 1 083 336 000 $ US | 1 040 664 000 $ US | 818 000 000 $ US |
| 2024 | 9 526 453 000 $ US | 1 714 447 000 $ US | 986 903 000 $ US | 1 027 311 000 $ US | 737 246 000 $ US |
| 2023 | 8 344 134 000 $ US | 1 514 509 000 $ US | 839 061 000 $ US | 887 998 000 $ US | 692 531 000 $ US |
| 2022 | 6 703 450 000 $ US | 1 183 244 000 $ US | 792 444 000 $ US | 815 132 000 $ US | 593 427 000 $ US |
| 2021 | 6 268 980 000 $ US | 1 036 716 000 $ US | 748 487 000 $ US | 701 070 000 $ US | 579 915 000 $ US |
| 2020 | 5 056 715 000 $ US | 895 905 000 $ US | 613 658 000 $ US | 596 435 000 $ US | 461 343 000 $ US |
| 2019 | 4 848 391 000 $ US | 720 813 000 $ US | 706 370 000 $ US | 595 428 000 $ US | 453 334 000 $ US |
| 2018 | 4 623 064 000 $ US | 679 001 000 $ US | 675 369 000 $ US | 570 942 000 $ US | 481 189 000 $ US |
| 2017 | 4 337 704 000 $ US | 594 819 000 $ US | 684 032 000 $ US | 525 864 000 $ US | 537 642 000 $ US |
| 2016 | 4 063 775 000 $ US | 575 438 000 $ US | 532 214 000 $ US | 516 340 000 $ US | 517 297 000 $ US |
| 2015 | 3 912 369 000 $ US | 440 009 000 $ US | 430 357 000 $ US | 523 862 000 $ US | 522 651 000 $ US |
| 2014 | 4 317 437 000 $ US | 695 673 000 $ US | 368 962 000 $ US | 465 483 000 $ US | 498 019 000 $ US |
| 2013 | 4 390 842 000 $ US | 829 672 000 $ US | 309 595 000 $ US | 450 998 000 $ US | 498 344 000 $ US |
| 2012 | 4 306 806 000 $ US | 850 040 000 $ US | 280 447 000 $ US | 432 467 000 $ US | 501 327 000 $ US |
| 2011 | 3 911 308 000 $ US | 686 183 000 $ US | 274 329 000 $ US | 407 526 000 $ US | 455 801 000 $ US |
| 2010 | 3 384 679 000 $ US | 633 714 000 $ US | 311 989 000 $ US | 361 679 000 $ US | 378 900 000 $ US |
| 2009 | 3 225 997 000 $ US | 619 240 000 $ US | 317 922 000 $ US | 311 008 000 $ US | 332 295 000 $ US |
| 2008 | 3 725 071 000 $ US | 492 296 000 $ US | 313 355 000 $ US | 359 093 000 $ US | 399 469 000 $ US |
| 2007 | 3 269 650 000 $ US | 464 614 000 $ US | 197 396 000 $ US | 335 026 000 $ US | 315 544 000 $ US |
| 2006 | 3 080 219 000 $ US | 504 029 000 $ US | 121 758 000 $ US | 141 093 000 $ US | 166 665 000 $ US |
| 2005 | 3 060 341 000 $ US | 450 353 000 $ US | 130 125 000 $ US | 283 518 000 $ US | 275 136 000 $ US |
| 2004 | 2 645 960 000 $ US | 331 148 000 $ US | 109 253 000 $ US | 272 819 000 $ US | 219 915 000 $ US |
| 2003 | 2 733 185 000 $ US | 359 251 000 $ US | 93 532 000 $ US | 253 460 000 $ US | 186 272 000 $ US |
| 2002 | 2 509 837 000 $ US | 314 706 000 $ US | 82 074 000 $ US | 233 297 000 $ US | 164 219 000 $ US |
| 2001 | 2 342 522 000 $ US | 274 712 000 $ US | 91 043 000 $ US | 214 964 000 $ US | 167 181 000 $ US |
En 2025, les exportations de biens s'élevaient à 10,8 milliards de dollars vers les États-Unis, 2,21 milliards de dollars vers les Pays-Bas, 1,08 milliard de dollars vers la Belgique, 1,04 milliard de dollars vers le Guatemala et 818 millions de dollars vers le Nicaragua. Le premier rang des cinq destinations du Costa Rica est occupé par les États-Unis chaque année depuis 2001. Le changement le plus récent dans leur ordre remonte à 2025, quand les exportations du Costa Rica vers la Belgique ont dépassé celles vers le Guatemala.
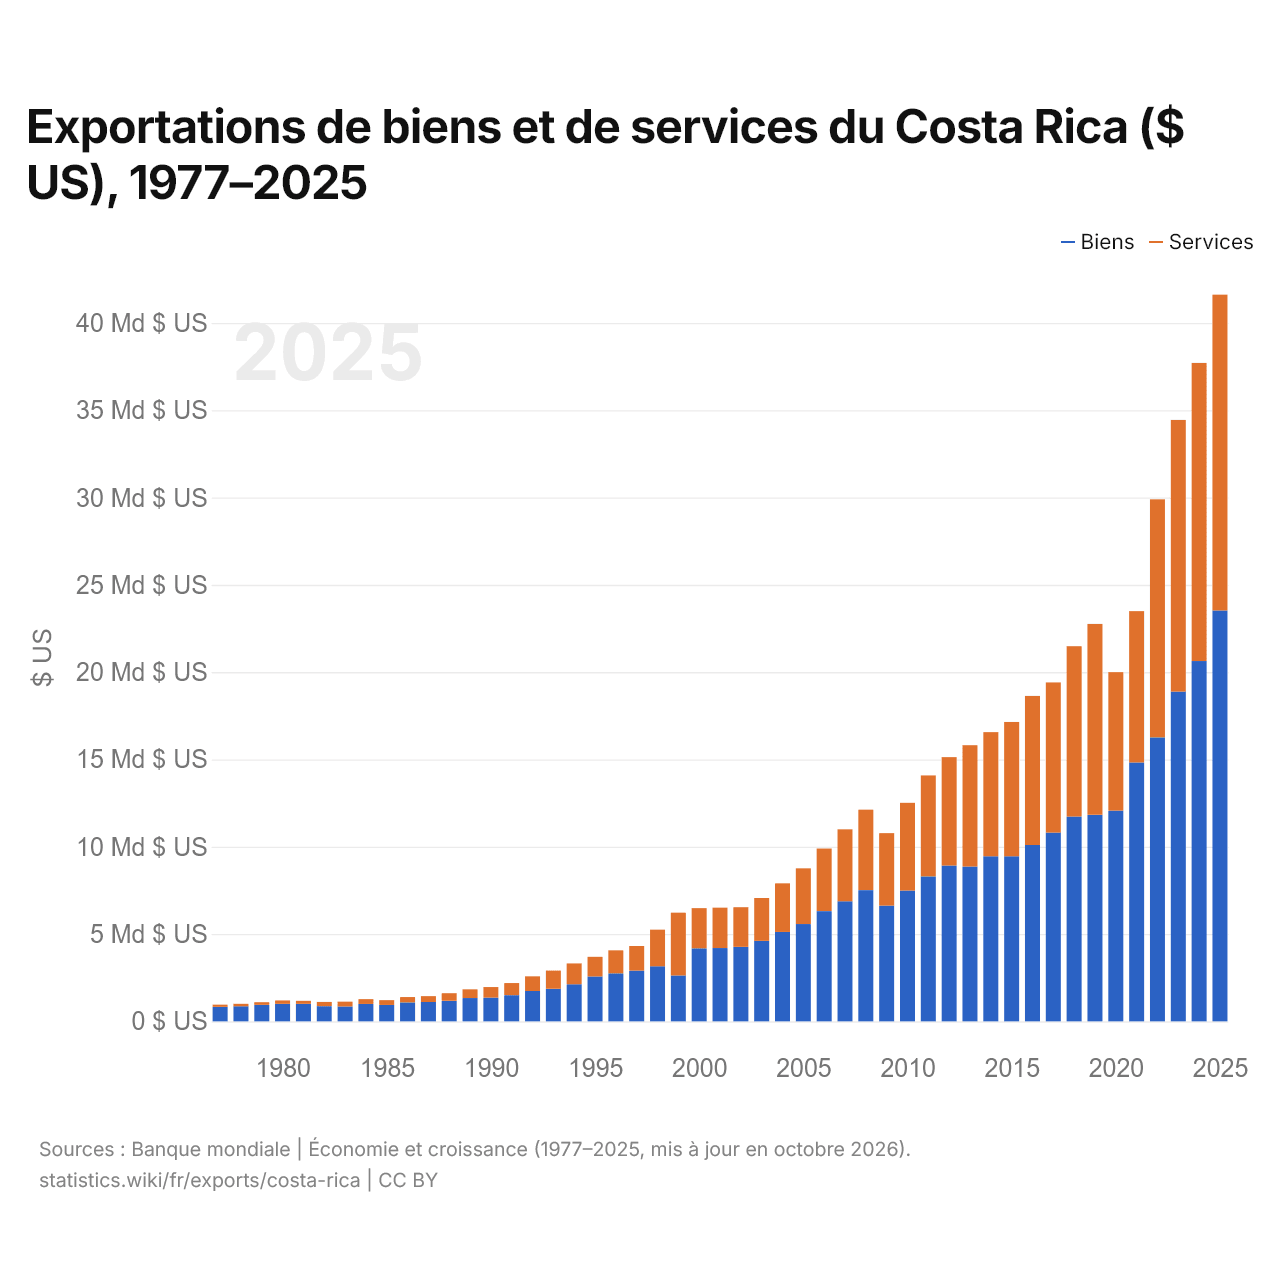
Exportations de biens et de services du Costa Rica ($ US), 1977–2025
| Année | $ US | |
|---|---|---|
| Biens | Services | |
| 2025 | 23 533 715 302 $ US | 18 083 355 635 $ US |
| 2024 | 20 635 350 683 $ US | 17 072 859 418 $ US |
| 2023 | 18 886 345 380 $ US | 15 557 973 246 $ US |
| 2022 | 16 262 231 844 $ US | 13 634 039 164 $ US |
| 2021 | 14 826 496 400 $ US | 8 666 741 845 $ US |
| 2020 | 12 066 682 925 $ US | 7 932 408 597 $ US |
| 2019 | 11 831 494 437 $ US | 10 928 625 660 $ US |
| 2018 | 11 730 272 940 $ US | 9 750 807 594 $ US |
| 2017 | 10 810 697 189 $ US | 8 597 672 351 $ US |
| 2016 | 10 100 261 496 $ US | 8 537 126 907 $ US |
| 2015 | 9 452 400 028 $ US | 7 693 596 630 $ US |
| 2014 | 9 455 567 011 $ US | 7 106 117 782 $ US |
| 2013 | 8 866 326 406 $ US | 6 949 171 456 $ US |
| 2012 | 8 922 635 328 $ US | 6 208 551 333 $ US |
| 2011 | 8 301 379 073 $ US | 5 782 232 666 $ US |
| 2010 | 7 492 546 077 $ US | 5 021 461 778 $ US |
| 2009 | 6 622 878 484 $ US | 4 153 504 973 $ US |
| 2008 | 7 513 776 854 $ US | 4 604 258 795 $ US |
| 2007 | 6 874 209 427 $ US | 4 119 711 819 $ US |
| 2006 | 6 310 766 159 $ US | 3 588 342 113 $ US |
| 2005 | 5 568 947 320 $ US | 3 197 093 709 $ US |
| 2004 | 5 120 469 210 $ US | 2 780 754 636 $ US |
| 2003 | 4 607 352 359 $ US | 2 455 809 455 $ US |
| 2002 | 4 268 892 785 $ US | 2 266 628 092 $ US |
| 2001 | 4 195 020 731 $ US | 2 312 224 495 $ US |
| 2000 | 4 179 869 135 $ US | 2 303 318 558 $ US |
| 1999 | 2 626 640 447 $ US | 3 592 570 079 $ US |
| 1998 | 3 157 610 000 $ US | 2 095 060 000 $ US |
| 1997 | 2 902 100 000 $ US | 1 411 404 000 $ US |
| 1996 | 2 749 610 000 $ US | 1 315 750 000 $ US |
| 1995 | 2 569 400 000 $ US | 1 124 600 000 $ US |
| 1994 | 2 122 000 000 $ US | 1 195 000 000 $ US |
| 1993 | 1 866 800 000 $ US | 1 039 300 000 $ US |
| 1992 | 1 739 100 000 $ US | 841 300 000 $ US |
| 1991 | 1 498 100 000 $ US | 691 400 000 $ US |
| 1990 | 1 354 200 000 $ US | 609 000 000 $ US |
| 1989 | 1 333 400 000 $ US | 497 900 000 $ US |
| 1988 | 1 180 700 000 $ US | 430 300 000 $ US |
| 1987 | 1 106 700 000 $ US | 337 100 000 $ US |
| 1986 | 1 084 800 000 $ US | 303 000 000 $ US |
| 1985 | 939 100 000 $ US | 274 700 000 $ US |
| 1984 | 997 500 000 $ US | 272 500 000 $ US |
| 1983 | 852 500 000 $ US | 275 200 000 $ US |
| 1982 | 869 000 000 $ US | 242 200 000 $ US |
| 1981 | 1 002 600 000 $ US | 170 800 000 $ US |
| 1980 | 1 000 900 000 $ US | 194 200 000 $ US |
| 1979 | 942 100 000 $ US | 154 800 000 $ US |
| 1978 | 863 900 000 $ US | 141 900 000 $ US |
| 1977 | 827 800 000 $ US | 129 900 000 $ US |
En 2025, les exportations de biens du Costa Rica s'élevaient à 23,5 milliards de dollars et celles de services à 18,1 milliards de dollars ; les services représentaient 43,5 % du total, contre 13,6 % en 1977.
Le Costa Rica dans le classement mondial des exportations, 2025






Exportations de biens et services du Costa Rica, % du PIB, 1960–2025
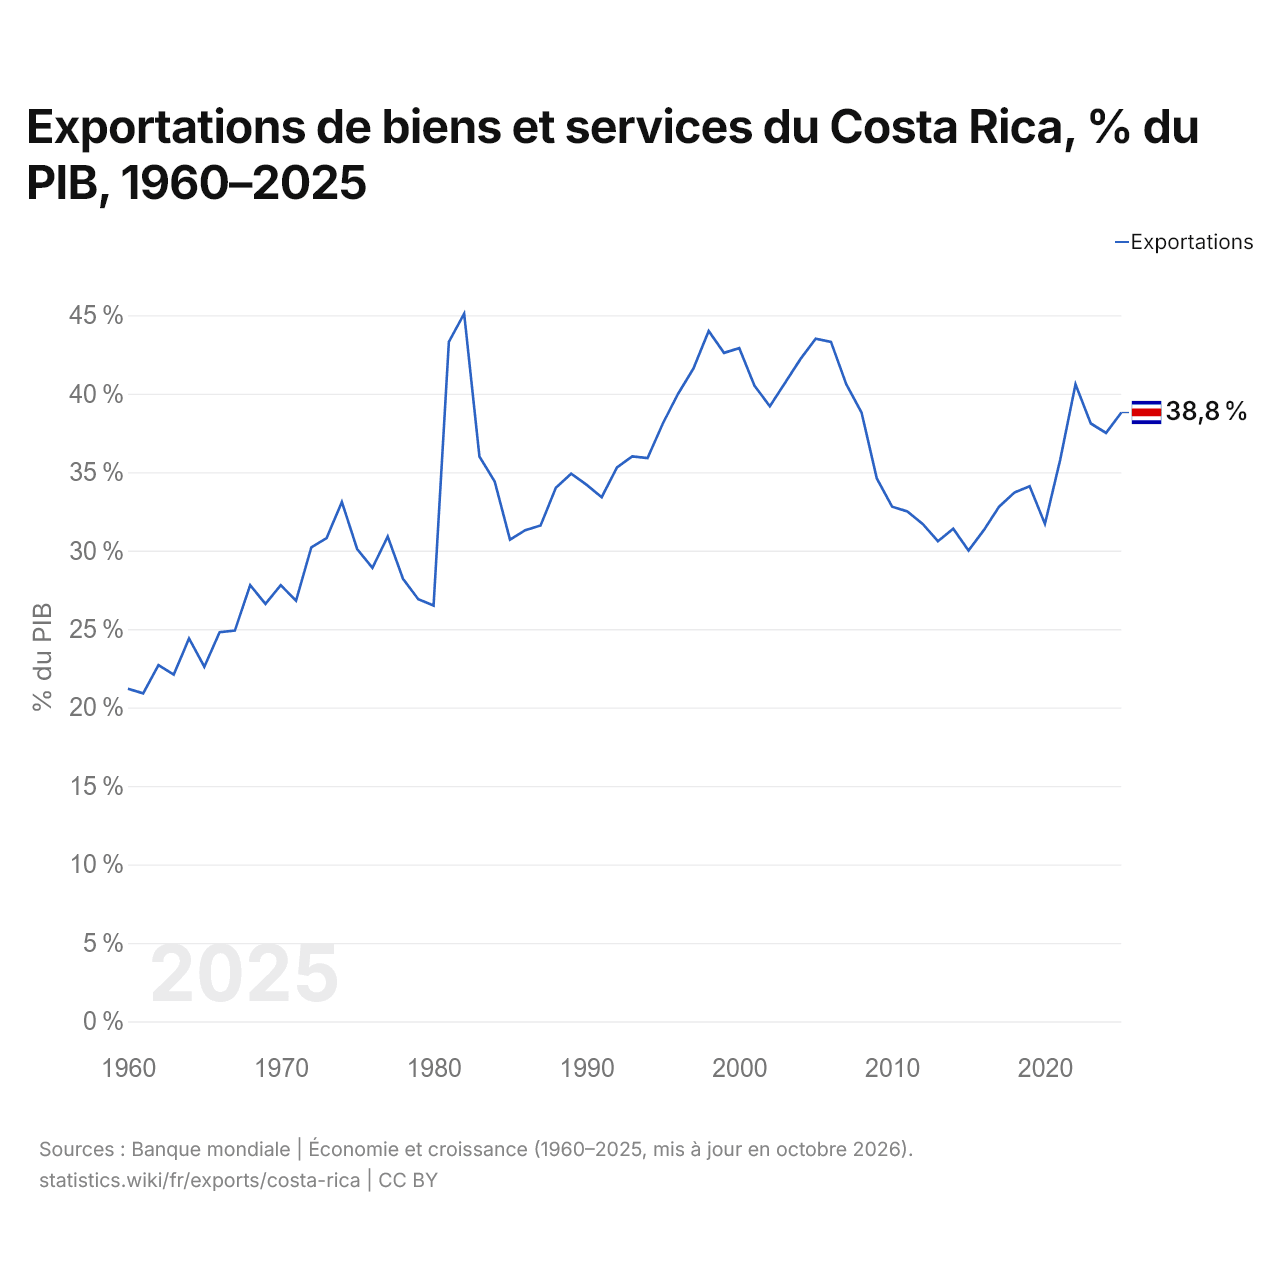
En 2025, les exportations de biens et services du Costa Rica équivalaient à 38,8 % de son PIB, contre 21,2 % en 1960. La part la plus élevée a été de 45,1 %, en 1982.
Comparer les exportations du Costa Rica avec celles d'autres pays
Sources :
- Banque mondiale | Économie et croissance (1960–2025, mis à jour en octobre 2026)
- TradeMap (2001–2025, mis à jour en octobre 2026)
Creative Commons Attribution (CC BY) : vous pouvez copier, partager, adapter et réutiliser ce contenu, y compris à des fins commerciales, à condition de citer statistics.wiki et d’indiquer les modifications apportées. Les sources citées ci-dessus peuvent avoir leurs propres conditions de licence.