
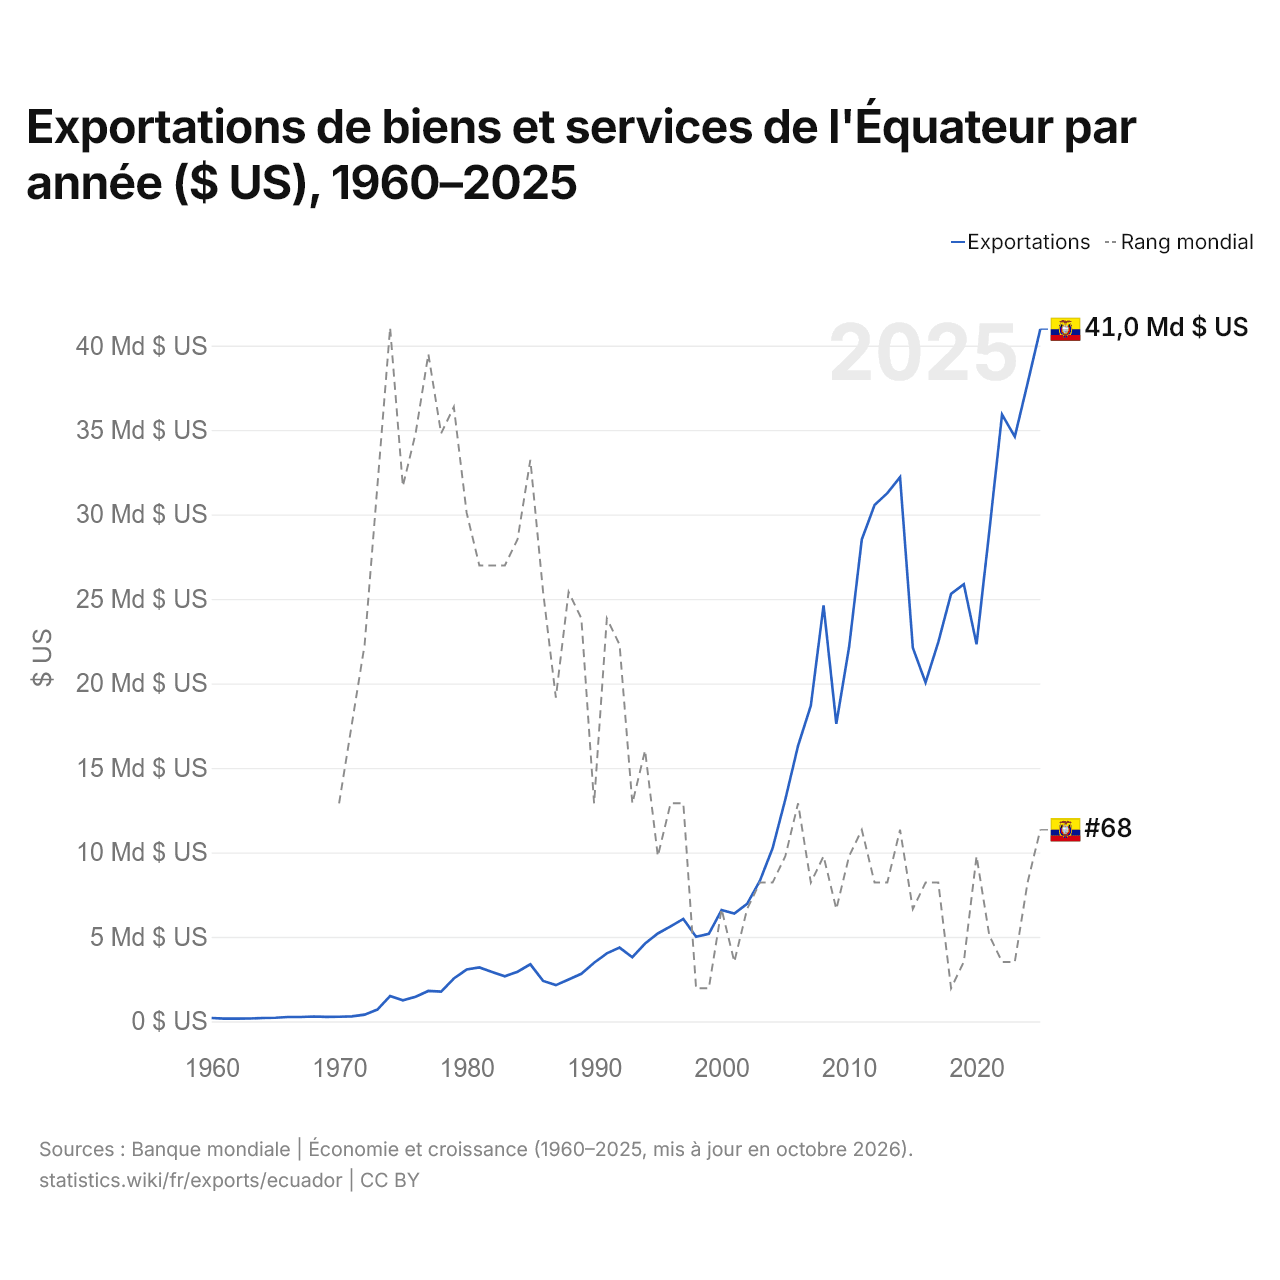
Exportations de biens et services de l'Équateur par année ($ US), 1960–2025
| Année | $ US | Rang mondial |
|---|---|---|
| Exportations | Rang mondial | |
| 2025 | 40 970 936 400 $ US | #68 |
| 2024 | 37 757 097 000 $ US | #70 |
| 2023 | 34 606 578 000 $ US | #73 |
| 2022 | 35 914 453 000 $ US | #73 |
| 2021 | 29 009 062 000 $ US | #72 |
| 2020 | 22 320 897 000 $ US | #69 |
| 2019 | 25 875 328 000 $ US | #73 |
| 2018 | 25 304 707 000 $ US | #74 |
| 2017 | 22 445 453 000 $ US | #70 |
| 2016 | 20 061 020 000 $ US | #70 |
| 2015 | 22 119 535 000 $ US | #71 |
| 2014 | 32 207 202 000 $ US | #68 |
| 2013 | 31 264 903 000 $ US | #70 |
| 2012 | 30 559 355 000 $ US | #70 |
| 2011 | 28 524 740 000 $ US | #68 |
| 2010 | 22 139 433 000 $ US | #69 |
| 2009 | 17 613 615 000 $ US | #71 |
| 2008 | 24 624 704 000 $ US | #69 |
| 2007 | 18 684 515 000 $ US | #70 |
| 2006 | 16 312 372 000 $ US | #67 |
| 2005 | 13 141 840 000 $ US | #69 |
| 2004 | 10 241 620 000 $ US | #70 |
| 2003 | 8 311 611 000 $ US | #70 |
| 2002 | 6 956 829 000 $ US | #71 |
| 2001 | 6 384 717 000 $ US | #73 |
| 2000 | 6 586 251 126 $ US | #71 |
| 1999 | 5 181 939 970 $ US | #74 |
| 1998 | 5 006 507 254 $ US | #74 |
| 1997 | 6 064 677 339 $ US | #67 |
| 1996 | 5 618 746 373 $ US | #67 |
| 1995 | 5 201 004 502 $ US | #69 |
| 1994 | 4 605 277 639 $ US | #65 |
| 1993 | 3 794 531 266 $ US | #67 |
| 1992 | 4 366 816 408 $ US | #61 |
| 1991 | 4 021 964 982 $ US | #60 |
| 1990 | 3 469 124 711 $ US | #67 |
| 1989 | 2 817 482 574 $ US | #60 |
| 1988 | 2 480 621 218 $ US | #59 |
| 1987 | 2 142 866 433 $ US | #63 |
| 1986 | 2 393 508 491 $ US | #59 |
| 1985 | 3 375 175 709 $ US | #54 |
| 1984 | 2 938 788 680 $ US | #57 |
| 1983 | 2 668 859 384 $ US | #58 |
| 1982 | 2 921 016 167 $ US | #58 |
| 1981 | 3 188 263 178 $ US | #58 |
| 1980 | 3 066 325 770 $ US | #56 |
| 1979 | 2 538 498 941 $ US | #52 |
| 1978 | 1 756 420 325 $ US | #53 |
| 1977 | 1 797 611 056 $ US | #50 |
| 1976 | 1 457 947 357 $ US | #53 |
| 1975 | 1 242 549 181 $ US | #55 |
| 1974 | 1 494 867 041 $ US | #49 |
| 1973 | 695 769 273 $ US | #55 |
| 1972 | 395 314 356 $ US | #61 |
| 1971 | 291 407 584 $ US | #64 |
| 1970 | 270 255 452 $ US | #67 |
| 1969 | 264 625 756 $ US | - |
| 1968 | 285 128 577 $ US | - |
| 1967 | 258 096 628 $ US | - |
| 1966 | 254 730 016 $ US | - |
| 1965 | 214 348 673 $ US | - |
| 1964 | 199 730 213 $ US | - |
| 1963 | 168 447 538 $ US | - |
| 1962 | 155 487 234 $ US | - |
| 1961 | 157 101 076 $ US | - |
| 1960 | 197 583 709 $ US | - |
En 2025, les exportations de biens et services de l'Équateur s'élevaient à 41 milliards de dollars, contre 198 millions de dollars en 1960. Le minimum a été de 155 millions de dollars, en 1962. Elles se classaient au 68e rang mondial, en hausse par rapport au 70e rang en 2024. Leur meilleur rang a été le 49e, occupé pour la dernière fois en 1974.
En 2025, les exportations de biens et services de l'Équateur étaient les 7es plus élevées de 27 pays situés en Amérique latine. Les importations de biens et services de l'Équateur s'élevaient à 36,4 milliards de dollars en 2025, au 73e rang mondial. En 2025, les exportations de l'Équateur dépassaient ses importations de 4,59 milliards de dollars, soit un excédent commercial.
Exportations de biens de l'Équateur par catégorie, 2025
Exportations de biens, 2025: 37,2 Md $US
En 2025, la première catégorie des exportations de biens de l'Équateur était « pétrole, gaz, minerais et autres matières premières », avec 29,3 %, suivie de « animaux, viande, poisson, produits laitiers, cuirs et peaux », avec 23,8 %.
Destinations des exportations de biens de l'Équateur : les 10 premières, 2025
| Rang | Pays | Exportations de biens | Part | |
|---|---|---|---|---|
| 1 |
 États-Unis |
6,89 Md $US | 18,5 % | |
| 2 |
 Panama |
6,41 Md $US | 17,3 % | |
| 3 |
 Chine |
5,99 Md $US | 16,1 % | |
| 4 |
 Pays-Bas |
1,60 Md $US | 4,3 % | |
| 5 |
 Espagne |
1,25 Md $US | 3,37 % | |
| 6 |
 Pérou |
1,08 Md $US | 2,9 % | vs Pérou |
| 7 |
 Russie |
1,04 Md $US | 2,81 % | |
| 8 |
 Italie |
894 M $US | 2,41 % | |
| 9 |
 Colombie |
886 M $US | 2,38 % | vs Colombie |
| 10 |
 Malaisie |
845 M $US | 2,28 % | |
| Autres partenaires et non précisés | 10,3 Md $US | 27,6 % |
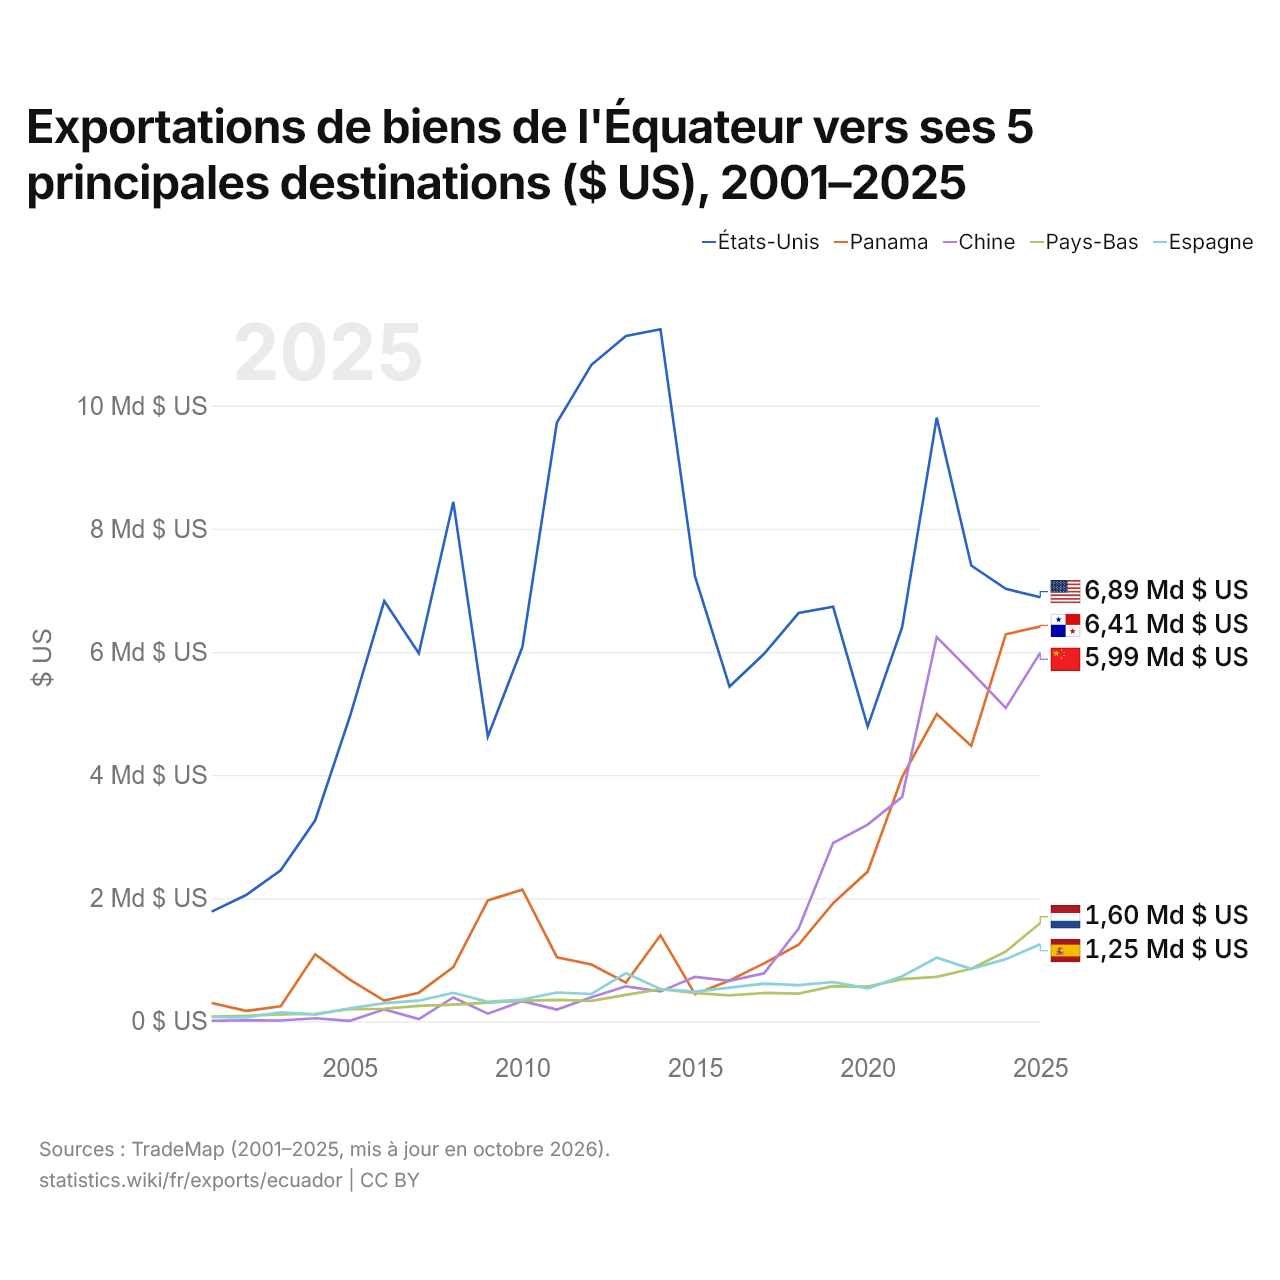
Exportations de biens de l'Équateur vers ses 5 principales destinations ($ US), 2001–2025
| Année | $ US | ||||
|---|---|---|---|---|---|
| États-Unis | Panama | Chine | Pays-Bas | Espagne | |
| 2025 | 6 888 265 000 $ US | 6 411 565 000 $ US | 5 988 053 000 $ US | 1 596 665 000 $ US | 1 250 375 000 $ US |
| 2024 | 7 024 330 000 $ US | 6 286 022 000 $ US | 5 089 824 000 $ US | 1 133 698 000 $ US | 1 009 976 000 $ US |
| 2023 | 7 402 717 000 $ US | 4 472 870 000 $ US | 5 672 882 000 $ US | 852 856 000 $ US | 853 977 000 $ US |
| 2022 | 9 803 755 000 $ US | 4 990 307 000 $ US | 6 241 761 000 $ US | 722 868 000 $ US | 1 031 748 000 $ US |
| 2021 | 6 402 850 000 $ US | 3 969 542 000 $ US | 3 644 911 000 $ US | 684 869 000 $ US | 731 982 000 $ US |
| 2020 | 4 786 401 000 $ US | 2 431 353 000 $ US | 3 193 705 000 $ US | 565 615 000 $ US | 534 862 000 $ US |
| 2019 | 6 732 893 000 $ US | 1 918 549 000 $ US | 2 896 831 000 $ US | 571 502 000 $ US | 639 124 000 $ US |
| 2018 | 6 631 276 000 $ US | 1 243 473 000 $ US | 1 507 002 000 $ US | 449 588 000 $ US | 587 874 000 $ US |
| 2017 | 5 968 418 000 $ US | 941 803 000 $ US | 778 767 000 $ US | 460 845 000 $ US | 613 261 000 $ US |
| 2016 | 5 436 083 000 $ US | 662 275 000 $ US | 656 382 000 $ US | 422 631 000 $ US | 547 333 000 $ US |
| 2015 | 7 226 222 000 $ US | 441 576 000 $ US | 722 966 000 $ US | 460 295 000 $ US | 483 490 000 $ US |
| 2014 | 11 239 608 000 $ US | 1 398 083 000 $ US | 485 076 000 $ US | 521 614 000 $ US | 525 072 000 $ US |
| 2013 | 11 130 951 000 $ US | 628 362 000 $ US | 568 770 000 $ US | 430 455 000 $ US | 781 758 000 $ US |
| 2012 | 10 662 567 000 $ US | 923 548 000 $ US | 391 462 000 $ US | 333 459 000 $ US | 444 001 000 $ US |
| 2011 | 9 725 735 000 $ US | 1 041 441 000 $ US | 191 850 000 $ US | 349 164 000 $ US | 467 730 000 $ US |
| 2010 | 6 077 496 000 $ US | 2 139 170 000 $ US | 328 738 000 $ US | 331 553 000 $ US | 354 200 000 $ US |
| 2009 | 4 625 857 000 $ US | 1 963 836 000 $ US | 124 208 000 $ US | 303 894 000 $ US | 317 037 000 $ US |
| 2008 | 8 435 396 000 $ US | 879 419 000 $ US | 387 466 000 $ US | 272 022 000 $ US | 464 068 000 $ US |
| 2007 | 5 977 819 000 $ US | 464 938 000 $ US | 36 550 000 $ US | 250 611 000 $ US | 335 396 000 $ US |
| 2006 | 6 824 753 000 $ US | 337 310 000 $ US | 194 728 000 $ US | 203 676 000 $ US | 296 447 000 $ US |
| 2005 | 4 941 481 000 $ US | 678 156 000 $ US | 7 205 000 $ US | 196 545 000 $ US | 209 560 000 $ US |
| 2004 | 3 264 954 000 $ US | 1 088 490 000 $ US | 49 510 000 $ US | 122 816 000 $ US | 108 803 000 $ US |
| 2003 | 2 451 554 000 $ US | 244 116 000 $ US | 13 578 000 $ US | 113 090 000 $ US | 145 811 000 $ US |
| 2002 | 2 052 005 000 $ US | 170 494 000 $ US | 14 603 000 $ US | 89 609 000 $ US | 65 232 000 $ US |
| 2001 | 1 781 233 000 $ US | 297 229 000 $ US | 9 155 000 $ US | 76 428 000 $ US | 70 543 000 $ US |
En 2025, les exportations de biens s'élevaient à 6,89 milliards de dollars vers les États-Unis, 6,41 milliards de dollars vers le Panama, 5,99 milliards de dollars vers la Chine, 1,6 milliard de dollars vers les Pays-Bas et 1,25 milliard de dollars vers l'Espagne. Le premier rang des cinq destinations de l'Équateur est occupé par les États-Unis chaque année depuis 2001. Le changement le plus récent dans leur ordre remonte à 2024, quand les exportations de l'Équateur vers le Panama ont dépassé celles vers la Chine.
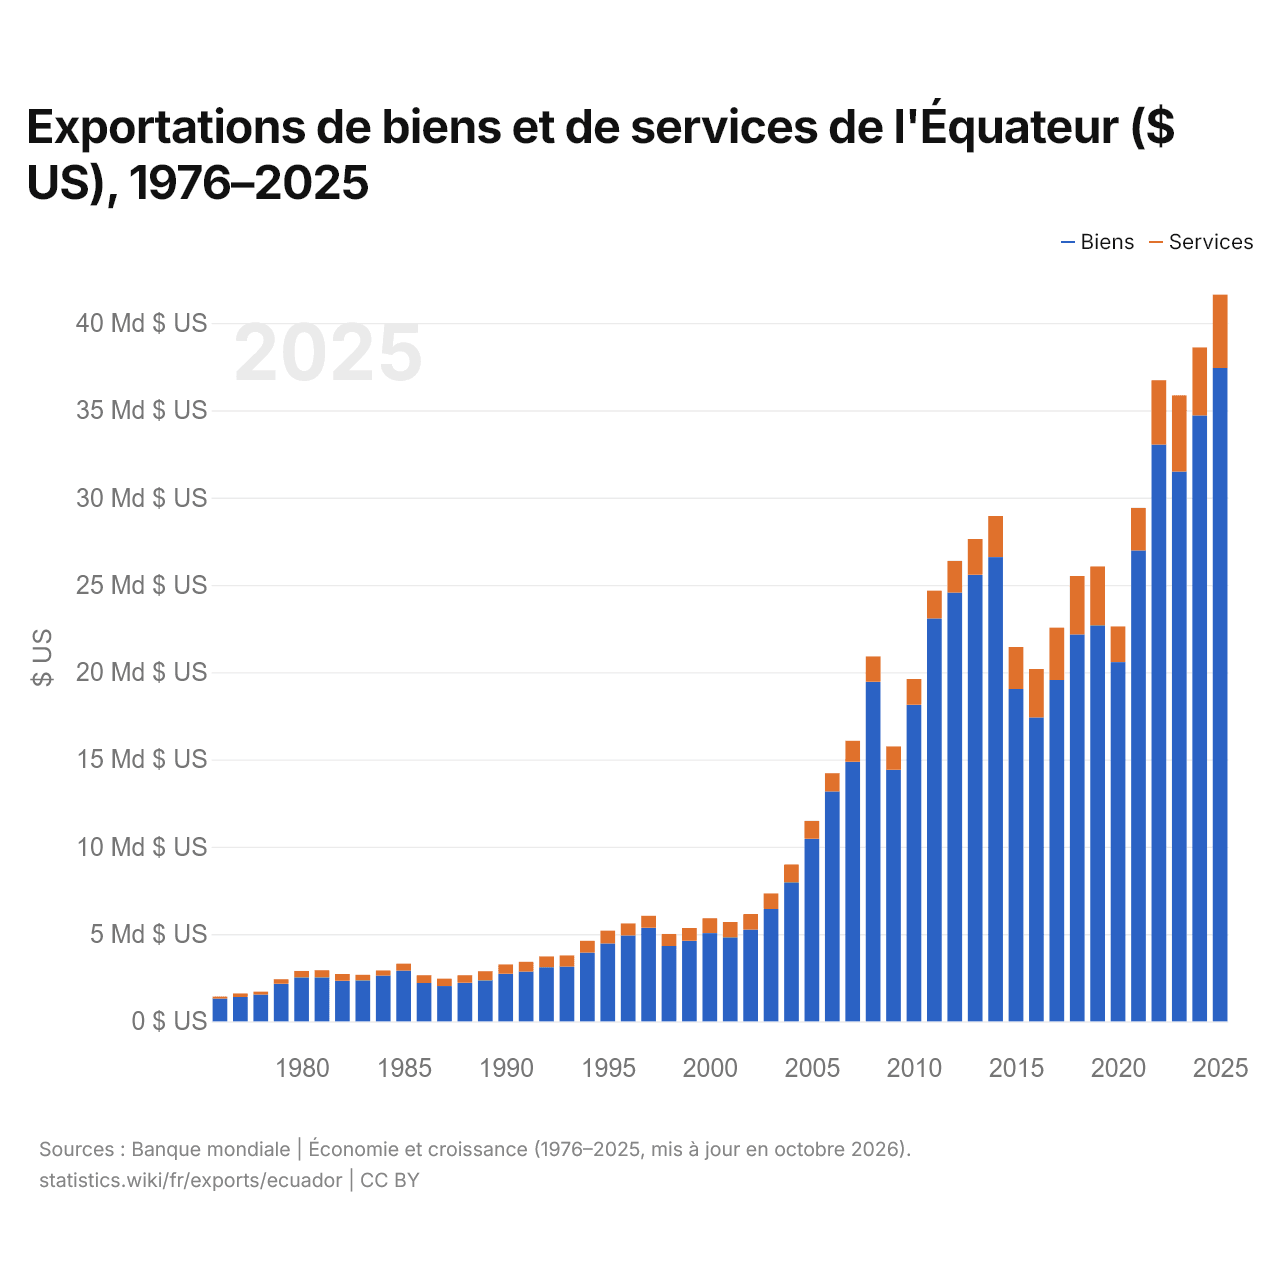
Exportations de biens et de services de l'Équateur ($ US), 1976–2025
| Année | $ US | |
|---|---|---|
| Biens | Services | |
| 2025 | 37 422 127 702 $ US | 4 201 819 447 $ US |
| 2024 | 34 705 476 749 $ US | 3 896 015 054 $ US |
| 2023 | 31 489 977 315 $ US | 4 367 168 647 $ US |
| 2022 | 33 039 296 981 $ US | 3 681 744 171 $ US |
| 2021 | 26 973 662 511 $ US | 2 435 248 877 $ US |
| 2020 | 20 575 529 774 $ US | 2 043 990 558 $ US |
| 2019 | 22 683 687 850 $ US | 3 376 242 692 $ US |
| 2018 | 22 163 588 499 $ US | 3 341 365 011 $ US |
| 2017 | 19 555 097 463 $ US | 2 994 019 578 $ US |
| 2016 | 17 409 962 305 $ US | 2 770 936 254 $ US |
| 2015 | 19 042 747 808 $ US | 2 397 312 737 $ US |
| 2014 | 26 590 481 333 $ US | 2 352 288 007 $ US |
| 2013 | 25 580 775 039 $ US | 2 047 368 026 $ US |
| 2012 | 24 562 898 323 $ US | 1 810 012 633 $ US |
| 2011 | 23 076 323 024 $ US | 1 593 470 094 $ US |
| 2010 | 18 131 092 038 $ US | 1 478 221 640 $ US |
| 2009 | 14 406 025 924 $ US | 1 342 524 062 $ US |
| 2008 | 19 454 767 463 $ US | 1 447 616 206 $ US |
| 2007 | 14 864 155 482 $ US | 1 206 089 927 $ US |
| 2006 | 13 170 091 670 $ US | 1 042 530 821 $ US |
| 2005 | 10 461 690 881 $ US | 1 018 121 359 $ US |
| 2004 | 7 962 153 641 $ US | 1 019 549 884 $ US |
| 2003 | 6 440 426 912 $ US | 886 552 003 $ US |
| 2002 | 5 251 182 682 $ US | 890 422 210 $ US |
| 2001 | 4 813 295 871 $ US | 870 166 930 $ US |
| 2000 | 5 051 684 520 $ US | 854 313 050 $ US |
| 1999 | 4 611 490 000 $ US | 733 510 000 $ US |
| 1998 | 4 322 150 000 $ US | 682 310 000 $ US |
| 1997 | 5 356 470 000 $ US | 690 060 000 $ US |
| 1996 | 4 919 420 000 $ US | 693 030 000 $ US |
| 1995 | 4 460 310 000 $ US | 735 820 000 $ US |
| 1994 | 3 935 910 000 $ US | 675 830 000 $ US |
| 1993 | 3 135 850 000 $ US | 635 700 000 $ US |
| 1992 | 3 101 000 000 $ US | 617 000 000 $ US |
| 1991 | 2 851 000 000 $ US | 556 000 000 $ US |
| 1990 | 2 724 000 000 $ US | 538 000 000 $ US |
| 1989 | 2 354 000 000 $ US | 516 000 000 $ US |
| 1988 | 2 205 000 000 $ US | 440 000 000 $ US |
| 1987 | 2 021 000 000 $ US | 421 000 000 $ US |
| 1986 | 2 200 000 000 $ US | 441 000 000 $ US |
| 1985 | 2 905 000 000 $ US | 397 000 000 $ US |
| 1984 | 2 621 000 000 $ US | 291 000 000 $ US |
| 1983 | 2 348 000 000 $ US | 315 000 000 $ US |
| 1982 | 2 327 000 000 $ US | 381 000 000 $ US |
| 1981 | 2 527 000 000 $ US | 398 600 000 $ US |
| 1980 | 2 520 000 000 $ US | 367 000 000 $ US |
| 1979 | 2 150 500 000 $ US | 260 200 000 $ US |
| 1978 | 1 529 200 000 $ US | 174 300 000 $ US |
| 1977 | 1 400 800 000 $ US | 201 900 000 $ US |
| 1976 | 1 307 200 000 $ US | 111 400 000 $ US |
En 2025, les exportations de biens de l'Équateur s'élevaient à 37,4 milliards de dollars et celles de services à 4,2 milliards de dollars ; les services représentaient 10,1 % du total, contre 7,9 % en 1976.
L'Équateur dans le classement mondial des exportations, 2025







Exportations de biens et services de l'Équateur, % du PIB, 1960–2025
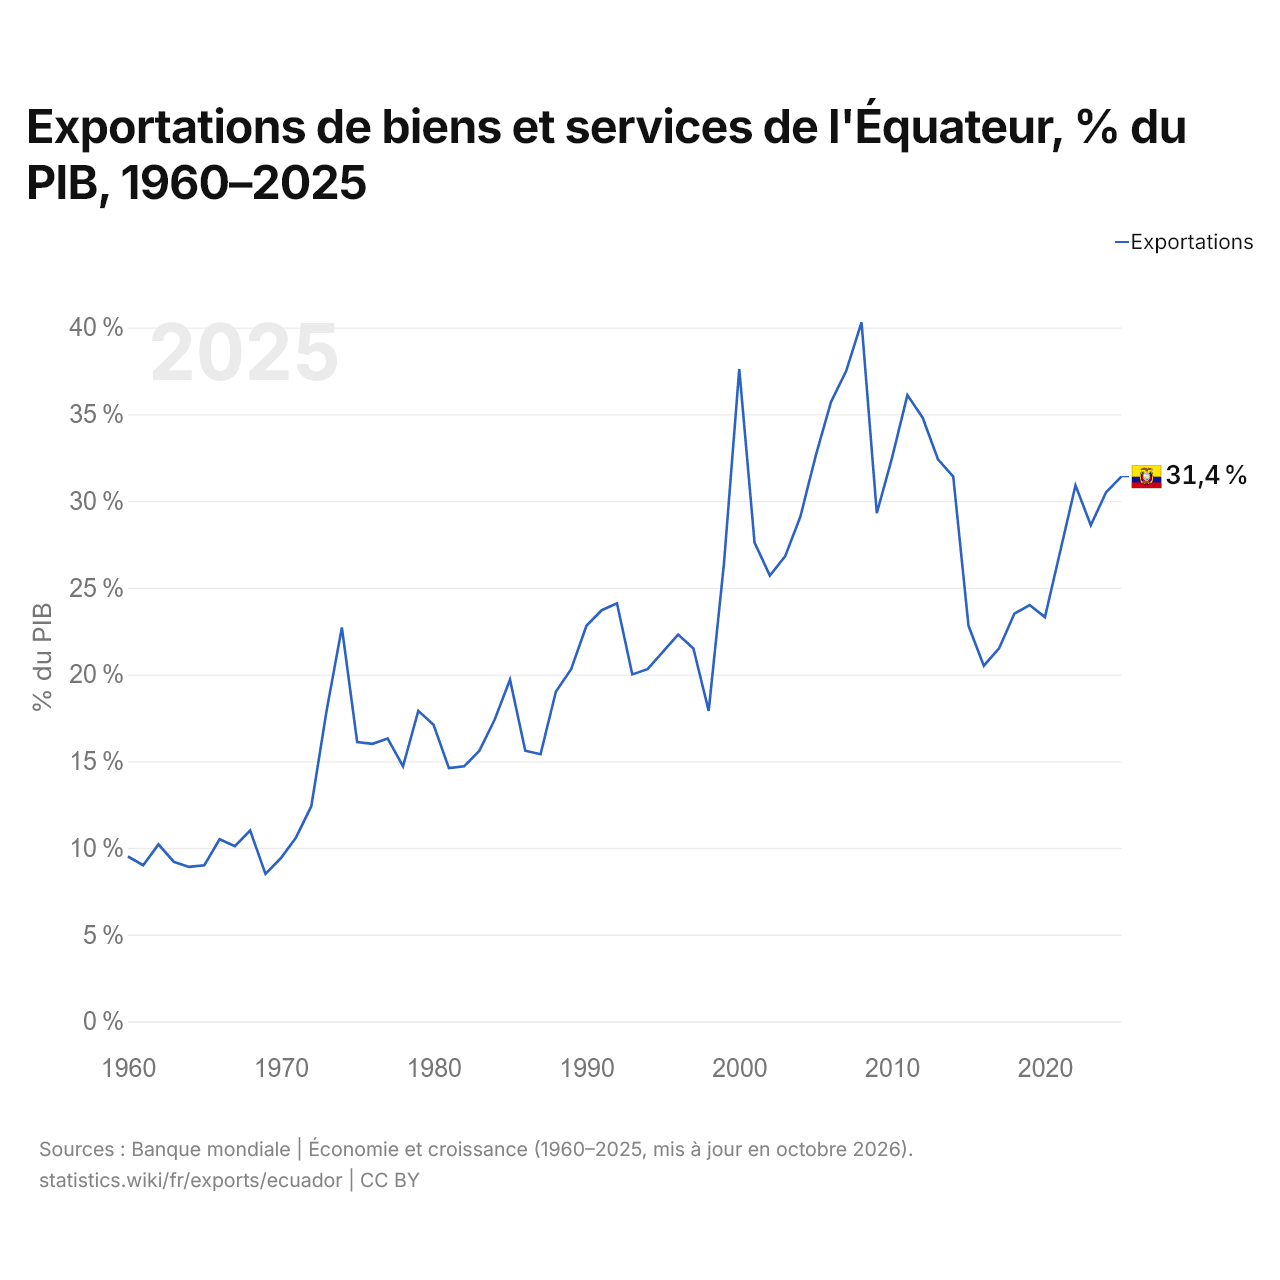
En 2025, les exportations de biens et services de l'Équateur équivalaient à 31,4 % de son PIB, contre 9,5 % en 1960. La part la plus élevée a été de 40,3 %, en 2008.
Comparer les exportations de l'Équateur avec celles d'autres pays
Sources :
- Banque mondiale | Économie et croissance (1960–2025, mis à jour en octobre 2026)
- TradeMap (2001–2025, mis à jour en octobre 2026)
Creative Commons Attribution (CC BY) : vous pouvez copier, partager, adapter et réutiliser ce contenu, y compris à des fins commerciales, à condition de citer statistics.wiki et d’indiquer les modifications apportées. Les sources citées ci-dessus peuvent avoir leurs propres conditions de licence.