
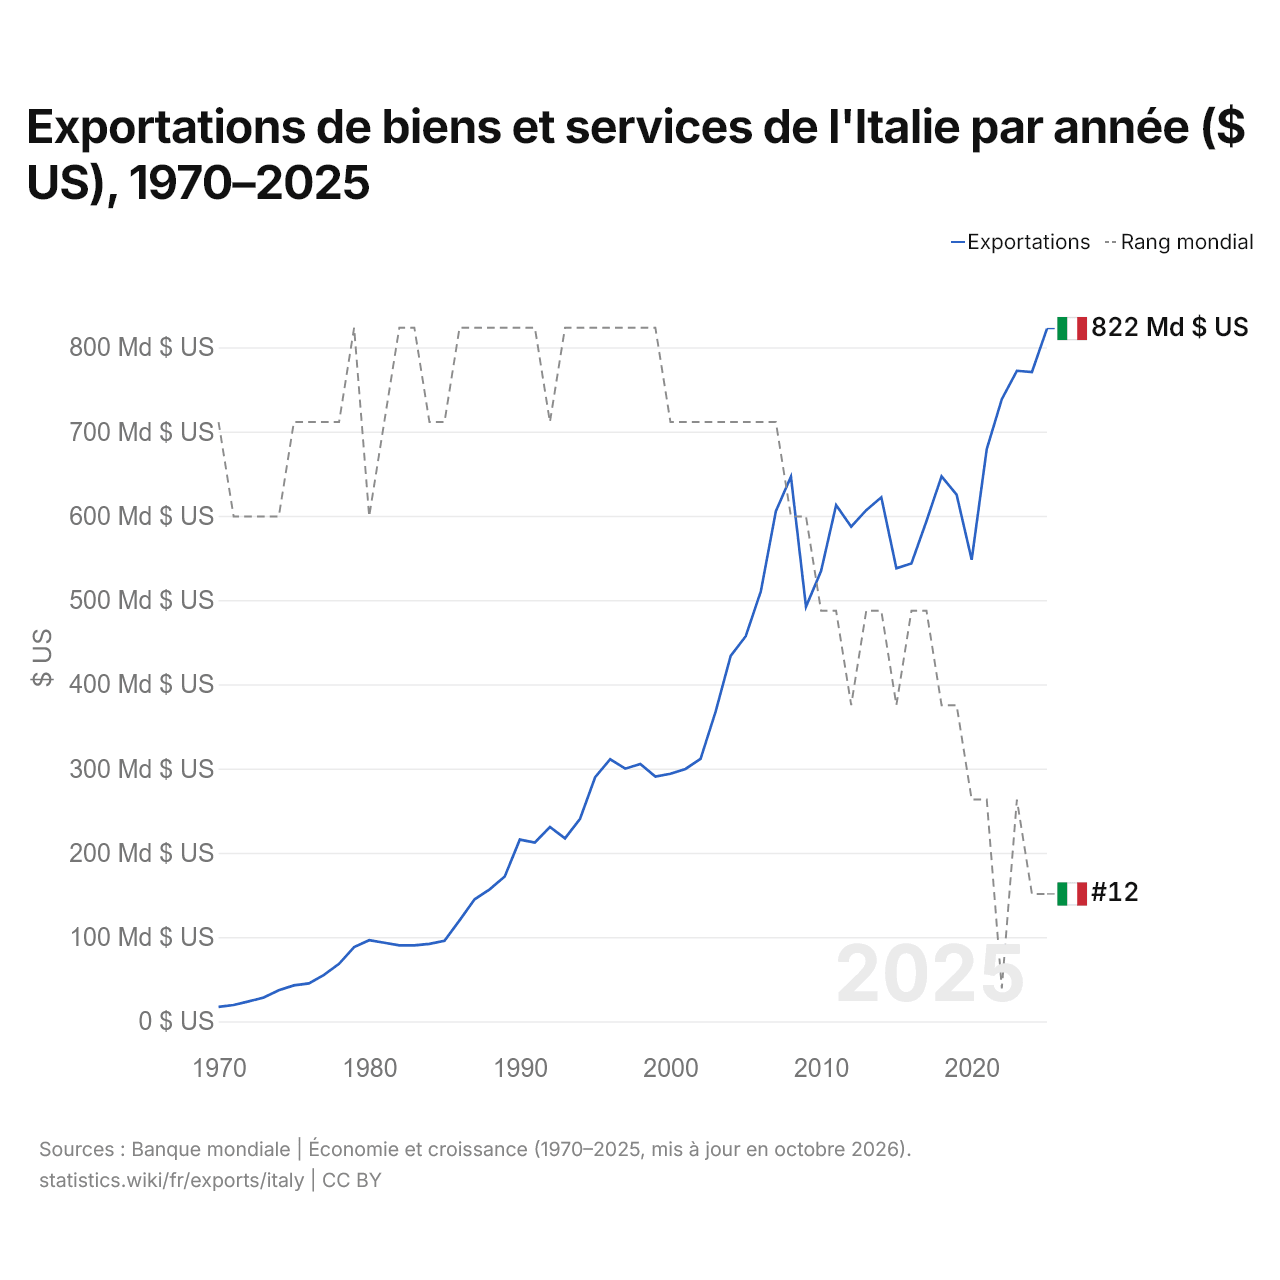
Exportations de biens et services de l'Italie par année ($ US), 1970–2025
| Année | $ US | Rang mondial |
|---|---|---|
| Exportations | Rang mondial | |
| 2025 | 822 290 762 950 $ US | #12 |
| 2024 | 770 685 525 117 $ US | #12 |
| 2023 | 772 202 263 040 $ US | #11 |
| 2022 | 738 509 644 129 $ US | #13 |
| 2021 | 679 294 123 498 $ US | #11 |
| 2020 | 547 940 256 805 $ US | #11 |
| 2019 | 625 065 757 186 $ US | #10 |
| 2018 | 646 909 638 535 $ US | #10 |
| 2017 | 593 973 032 350 $ US | #9 |
| 2016 | 543 464 412 394 $ US | #9 |
| 2015 | 537 833 599 948 $ US | #10 |
| 2014 | 622 037 943 986 $ US | #9 |
| 2013 | 606 723 898 231 $ US | #9 |
| 2012 | 587 109 493 950 $ US | #10 |
| 2011 | 612 801 201 125 $ US | #9 |
| 2010 | 534 489 188 500 $ US | #9 |
| 2009 | 492 210 347 985 $ US | #8 |
| 2008 | 646 508 511 780 $ US | #8 |
| 2007 | 605 527 905 413 $ US | #7 |
| 2006 | 510 265 819 331 $ US | #7 |
| 2005 | 457 141 717 038 $ US | #7 |
| 2004 | 433 747 867 068 $ US | #7 |
| 2003 | 367 620 453 605 $ US | #7 |
| 2002 | 311 627 059 267 $ US | #7 |
| 2001 | 299 586 464 835 $ US | #7 |
| 2000 | 293 867 190 140 $ US | #7 |
| 1999 | 290 576 914 389 $ US | #6 |
| 1998 | 305 612 021 858 $ US | #6 |
| 1997 | 299 911 323 329 $ US | #6 |
| 1996 | 311 106 412 348 $ US | #6 |
| 1995 | 289 818 376 322 $ US | #6 |
| 1994 | 240 410 654 419 $ US | #6 |
| 1993 | 217 241 821 090 $ US | #6 |
| 1992 | 230 753 561 665 $ US | #7 |
| 1991 | 212 306 182 301 $ US | #6 |
| 1990 | 215 684 612 153 $ US | #6 |
| 1989 | 171 957 047 700 $ US | #6 |
| 1988 | 156 726 916 096 $ US | #6 |
| 1987 | 144 899 858 082 $ US | #6 |
| 1986 | 119 777 358 098 $ US | #6 |
| 1985 | 95 474 838 252 $ US | #7 |
| 1984 | 91 976 627 728 $ US | #7 |
| 1983 | 90 083 429 373 $ US | #6 |
| 1982 | 90 239 862 563 $ US | #6 |
| 1981 | 93 313 282 235 $ US | #7 |
| 1980 | 96 339 527 470 $ US | #8 |
| 1979 | 88 125 534 840 $ US | #6 |
| 1978 | 68 300 727 812 $ US | #7 |
| 1977 | 55 073 254 334 $ US | #7 |
| 1976 | 45 043 912 538 $ US | #7 |
| 1975 | 42 652 568 209 $ US | #7 |
| 1974 | 36 967 362 310 $ US | #8 |
| 1973 | 28 263 779 475 $ US | #8 |
| 1972 | 23 697 035 193 $ US | #8 |
| 1971 | 19 424 023 096 $ US | #8 |
| 1970 | 17 194 739 777 $ US | #7 |
En 2025, les exportations de biens et services de l'Italie s'élevaient à 822 milliards de dollars, contre 17,2 milliards de dollars en 1970. Elles se classaient au 12e rang mondial, un rang qu'elles occupent depuis 2024. Leur meilleur rang a été le 6e, occupé pour la dernière fois en 1999.
En 2025, les exportations de biens et services de l'Italie étaient les 6es plus élevées de 41 pays situés en Europe. Les importations de biens et services de l'Italie s'élevaient à 773 milliards de dollars en 2025, au 10e rang mondial. En 2025, les exportations de l'Italie dépassaient ses importations de 49,3 milliards de dollars, soit un excédent commercial.
Exportations de biens de l'Italie par catégorie, 2025
Exportations de biens, 2025: 727 Md $US
En 2025, la première catégorie des exportations de biens de l'Italie était « machines, électronique et véhicules », avec 34,9 %, suivie de « produits chimiques, pharmaceutiques et plastiques », avec 18,7 %.
Destinations des exportations de biens de l'Italie : les 10 premières, 2025
| Rang | Pays | Exportations de biens | Part | |
|---|---|---|---|---|
| 1 |
 Allemagne |
81,6 Md $US | 11,2 % | vs Allemagne |
| 2 |
 États-Unis |
78,7 Md $US | 10,8 % | vs USA |
| 3 |
 France |
73,4 Md $US | 10,1 % | vs France |
| 4 |
 Espagne |
43,1 Md $US | 5,93 % | vs Espagne |
| 5 |
 Suisse |
39,7 Md $US | 5,46 % | vs Suisse |
| 6 |
 Royaume-Uni |
30,5 Md $US | 4,2 % | vs R.-U. |
| 7 |
 Pologne |
23,5 Md $US | 3,24 % | vs Pologne |
| 8 |
 Belgique |
22,6 Md $US | 3,11 % | vs Belgique |
| 9 |
 Pays-Bas |
21,3 Md $US | 2,94 % | vs Pays-Bas |
| 10 |
 Chine |
16,2 Md $US | 2,23 % | vs Chine |
| Autres partenaires et non précisés | 296 Md $US | 40,7 % |
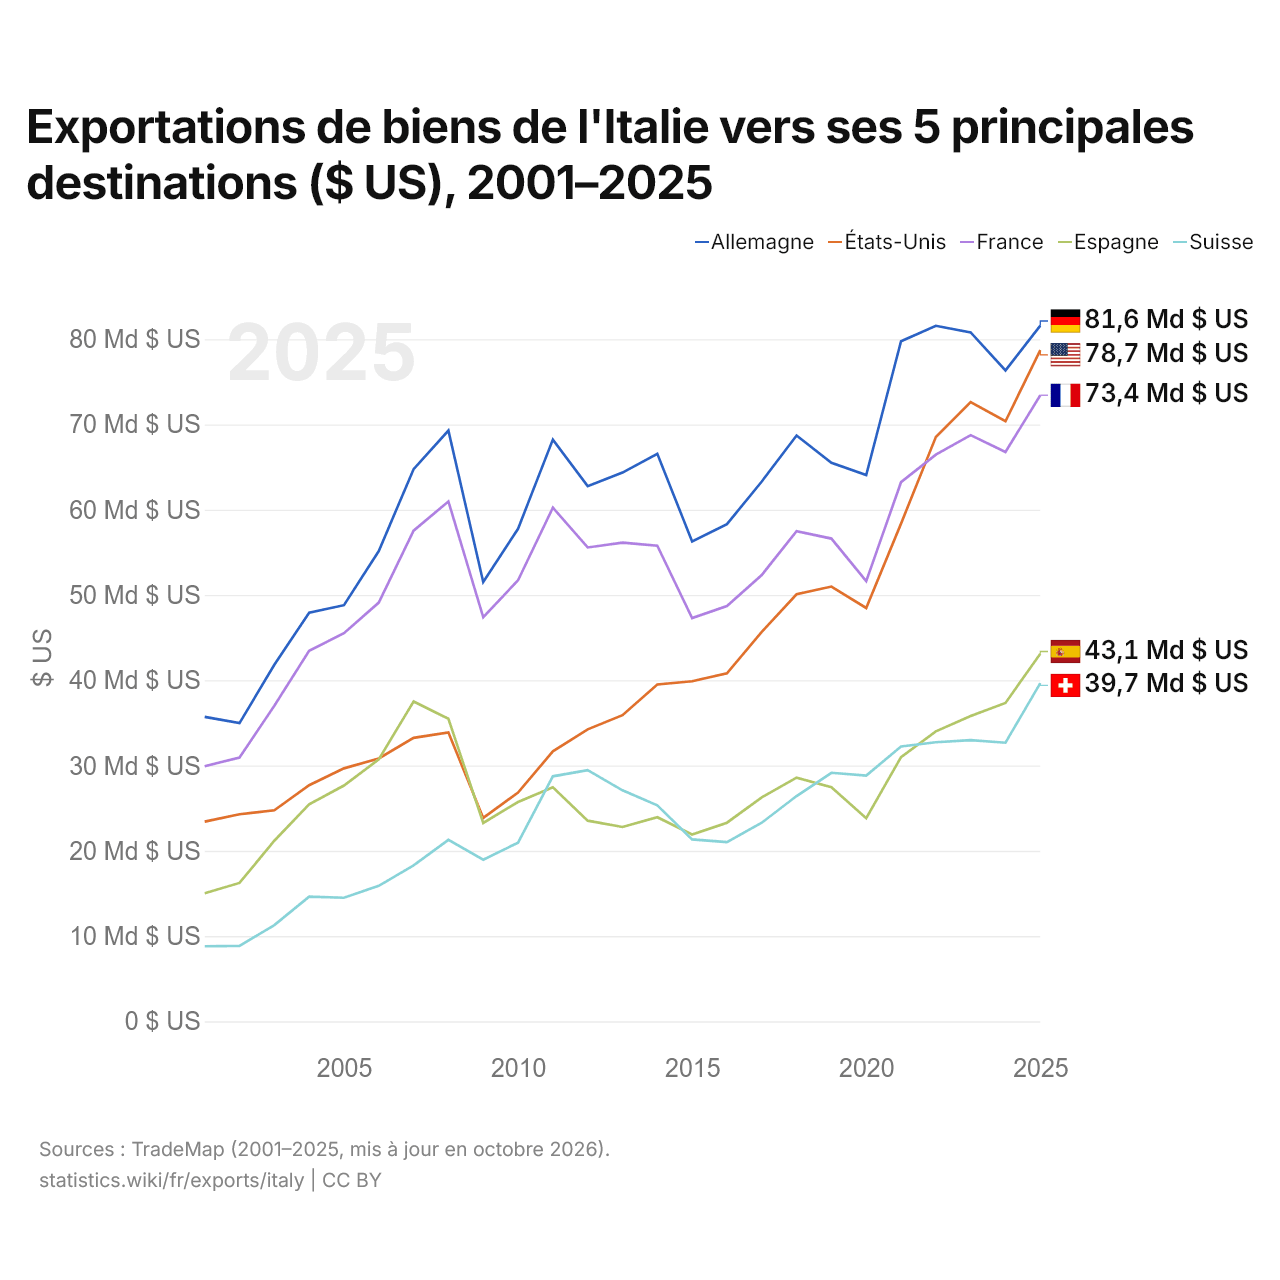
Exportations de biens de l'Italie vers ses 5 principales destinations ($ US), 2001–2025
| Année | $ US | ||||
|---|---|---|---|---|---|
| Allemagne | États-Unis | France | Espagne | Suisse | |
| 2025 | 81 584 909 000 $ US | 78 719 471 000 $ US | 73 427 900 000 $ US | 43 114 735 000 $ US | 39 663 038 000 $ US |
| 2024 | 76 342 630 000 $ US | 70 374 186 000 $ US | 66 772 483 000 $ US | 37 338 969 000 $ US | 32 677 115 000 $ US |
| 2023 | 80 799 805 000 $ US | 72 634 196 000 $ US | 68 749 481 000 $ US | 35 803 964 000 $ US | 32 988 837 000 $ US |
| 2022 | 81 571 157 000 $ US | 68 540 910 000 $ US | 66 465 305 000 $ US | 34 007 848 000 $ US | 32 731 435 000 $ US |
| 2021 | 79 761 126 000 $ US | 58 372 634 000 $ US | 63 232 887 000 $ US | 30 989 531 000 $ US | 32 226 687 000 $ US |
| 2020 | 64 060 377 000 $ US | 48 473 451 000 $ US | 51 620 364 000 $ US | 23 816 488 000 $ US | 28 826 910 000 $ US |
| 2019 | 65 509 541 000 $ US | 50 990 415 000 $ US | 56 617 646 000 $ US | 27 450 447 000 $ US | 29 151 024 000 $ US |
| 2018 | 68 707 241 000 $ US | 50 082 907 000 $ US | 57 482 660 000 $ US | 28 578 753 000 $ US | 26 426 322 000 $ US |
| 2017 | 63 310 129 000 $ US | 45 678 562 000 $ US | 52 347 289 000 $ US | 26 276 198 000 $ US | 23 291 841 000 $ US |
| 2016 | 58 311 990 000 $ US | 40 821 344 000 $ US | 48 701 437 000 $ US | 23 294 605 000 $ US | 21 019 072 000 $ US |
| 2015 | 56 269 723 000 $ US | 39 881 613 000 $ US | 47 294 332 000 $ US | 21 905 393 000 $ US | 21 331 136 000 $ US |
| 2014 | 66 568 028 000 $ US | 39 508 766 000 $ US | 55 784 095 000 $ US | 23 936 326 000 $ US | 25 329 401 000 $ US |
| 2013 | 64 356 077 000 $ US | 35 909 527 000 $ US | 56 149 237 000 $ US | 22 793 522 000 $ US | 27 096 305 000 $ US |
| 2012 | 62 768 608 000 $ US | 34 246 957 000 $ US | 55 577 459 000 $ US | 23 536 247 000 $ US | 29 463 371 000 $ US |
| 2011 | 68 230 665 000 $ US | 31 662 267 000 $ US | 60 240 177 000 $ US | 27 450 658 000 $ US | 28 734 806 000 $ US |
| 2010 | 57 766 852 000 $ US | 26 826 432 000 $ US | 51 724 538 000 $ US | 25 726 216 000 $ US | 20 955 703 000 $ US |
| 2009 | 51 525 071 000 $ US | 23 857 712 000 $ US | 47 400 942 000 $ US | 23 265 020 000 $ US | 18 951 954 000 $ US |
| 2008 | 69 285 481 000 $ US | 33 873 739 000 $ US | 60 975 938 000 $ US | 35 479 269 000 $ US | 21 282 950 000 $ US |
| 2007 | 64 758 987 000 $ US | 33 247 913 000 $ US | 57 547 830 000 $ US | 37 508 829 000 $ US | 18 288 081 000 $ US |
| 2006 | 55 162 722 000 $ US | 30 833 553 000 $ US | 49 116 844 000 $ US | 30 724 592 000 $ US | 15 890 652 000 $ US |
| 2005 | 48 806 614 000 $ US | 29 666 679 000 $ US | 45 522 112 000 $ US | 27 659 459 000 $ US | 14 496 352 000 $ US |
| 2004 | 47 911 771 000 $ US | 27 691 637 000 $ US | 43 465 554 000 $ US | 25 442 077 000 $ US | 14 622 085 000 $ US |
| 2003 | 41 823 073 000 $ US | 24 757 276 000 $ US | 37 004 620 000 $ US | 21 182 871 000 $ US | 11 289 607 000 $ US |
| 2002 | 34 971 601 000 $ US | 24 292 638 000 $ US | 30 944 845 000 $ US | 16 230 423 000 $ US | 8 858 328 000 $ US |
| 2001 | 35 701 139 000 $ US | 23 426 160 000 $ US | 29 921 849 000 $ US | 15 014 078 000 $ US | 8 803 594 000 $ US |
En 2025, les exportations de biens s'élevaient à 81,6 milliards de dollars vers l'Allemagne, 78,7 milliards de dollars vers les États-Unis, 73,4 milliards de dollars vers la France, 43,1 milliards de dollars vers l'Espagne et 39,7 milliards de dollars vers la Suisse. Le premier rang des cinq destinations de l'Italie est occupé par l'Allemagne chaque année depuis 2001. Le changement le plus récent dans leur ordre remonte à 2022, quand les exportations de l'Italie vers les États-Unis ont dépassé celles vers la France.
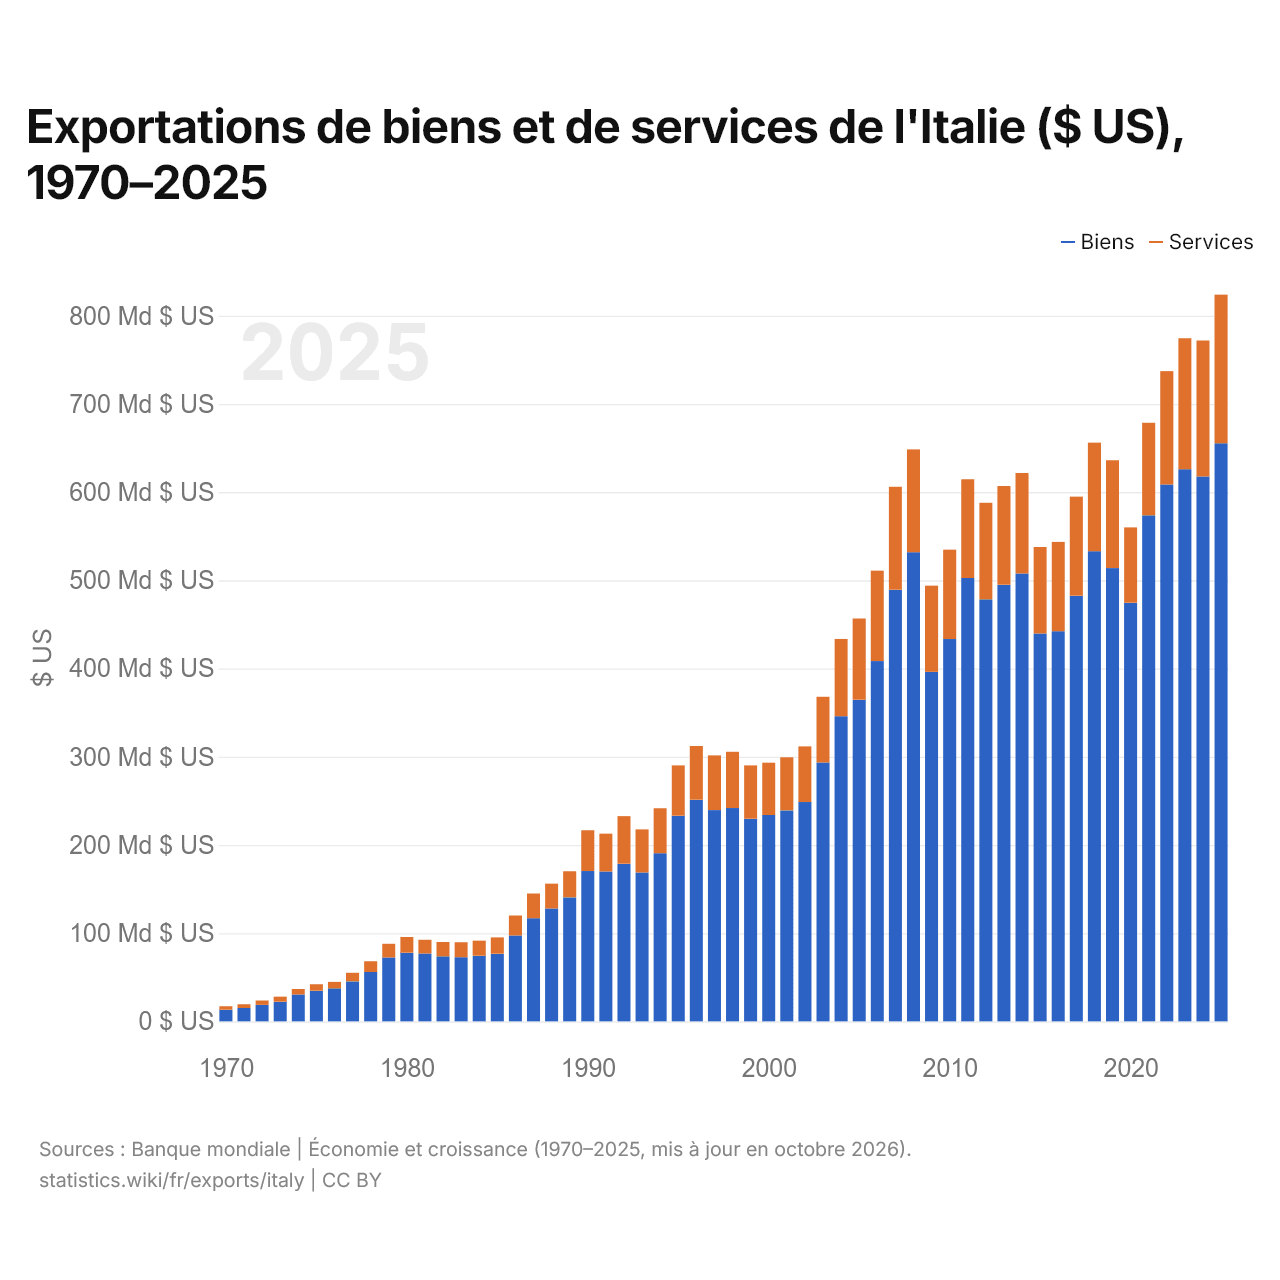
Exportations de biens et de services de l'Italie ($ US), 1970–2025
| Année | $ US | |
|---|---|---|
| Biens | Services | |
| 2025 | 655 320 481 506 $ US | 168 496 506 714 $ US |
| 2024 | 617 759 560 084 $ US | 154 137 317 519 $ US |
| 2023 | 625 901 842 946 $ US | 148 535 914 371 $ US |
| 2022 | 608 510 895 791 $ US | 128 571 959 699 $ US |
| 2021 | 573 642 195 145 $ US | 104 907 258 364 $ US |
| 2020 | 474 601 004 639 $ US | 85 350 042 563 $ US |
| 2019 | 513 847 404 381 $ US | 122 306 488 673 $ US |
| 2018 | 532 948 165 586 $ US | 123 107 279 273 $ US |
| 2017 | 482 548 755 607 $ US | 112 351 995 071 $ US |
| 2016 | 442 330 680 916 $ US | 101 188 552 835 $ US |
| 2015 | 439 732 075 093 $ US | 97 957 089 595 $ US |
| 2014 | 507 764 523 847 $ US | 113 910 721 508 $ US |
| 2013 | 494 967 213 056 $ US | 111 865 109 422 $ US |
| 2012 | 478 424 329 502 $ US | 109 448 815 032 $ US |
| 2011 | 502 670 290 860 $ US | 111 853 802 100 $ US |
| 2010 | 433 411 849 725 $ US | 101 308 448 430 $ US |
| 2009 | 396 221 270 785 $ US | 97 660 337 549 $ US |
| 2008 | 531 852 973 015 $ US | 116 596 548 186 $ US |
| 2007 | 489 391 229 974 $ US | 116 676 594 143 $ US |
| 2006 | 408 460 517 691 $ US | 102 473 966 999 $ US |
| 2005 | 364 685 969 054 $ US | 92 015 863 394 $ US |
| 2004 | 345 970 697 789 $ US | 87 509 941 304 $ US |
| 2003 | 293 496 232 768 $ US | 74 372 421 964 $ US |
| 2002 | 248 636 358 667 $ US | 63 039 521 110 $ US |
| 2001 | 239 139 683 832 $ US | 60 236 914 551 $ US |
| 2000 | 233 992 291 436 $ US | 59 214 764 350 $ US |
| 1999 | 229 615 080 922 $ US | 60 616 605 454 $ US |
| 1998 | 241 830 314 552 $ US | 63 789 541 976 $ US |
| 1997 | 239 501 514 823 $ US | 61 975 544 890 $ US |
| 1996 | 251 274 791 246 $ US | 60 815 855 620 $ US |
| 1995 | 233 225 531 785 $ US | 56 927 495 967 $ US |
| 1994 | 190 572 642 039 $ US | 51 013 773 221 $ US |
| 1993 | 168 697 314 913 $ US | 48 923 547 569 $ US |
| 1992 | 178 688 536 528 $ US | 53 921 887 170 $ US |
| 1991 | 169 948 731 628 $ US | 42 782 874 884 $ US |
| 1990 | 170 406 762 992 $ US | 46 233 057 807 $ US |
| 1989 | 140 537 724 593 $ US | 29 576 771 000 $ US |
| 1988 | 127 923 096 719 $ US | 28 159 769 569 $ US |
| 1987 | 116 869 009 310 $ US | 28 049 040 447 $ US |
| 1986 | 97 305 675 719 $ US | 22 656 258 842 $ US |
| 1985 | 76 607 015 463 $ US | 18 633 636 514 $ US |
| 1984 | 74 490 444 281 $ US | 17 034 127 902 $ US |
| 1983 | 72 705 014 058 $ US | 16 908 072 931 $ US |
| 1982 | 73 706 606 610 $ US | 16 204 356 558 $ US |
| 1981 | 76 989 677 182 $ US | 15 411 843 641 $ US |
| 1980 | 77 917 288 514 $ US | 17 709 100 691 $ US |
| 1979 | 72 261 082 514 $ US | 15 587 324 558 $ US |
| 1978 | 55 980 186 980 $ US | 12 148 412 235 $ US |
| 1977 | 45 319 790 288 $ US | 9 673 905 842 $ US |
| 1976 | 37 422 659 285 $ US | 7 298 269 760 $ US |
| 1975 | 34 705 342 175 $ US | 7 375 444 932 $ US |
| 1974 | 30 474 474 073 $ US | 6 150 217 099 $ US |
| 1973 | 22 304 545 900 $ US | 5 746 581 687 $ US |
| 1972 | 18 611 427 920 $ US | 4 984 491 119 $ US |
| 1971 | 15 143 325 039 $ US | 4 217 406 081 $ US |
| 1970 | 13 240 001 747 $ US | 3 851 199 996 $ US |
En 2025, les exportations de biens de l'Italie s'élevaient à 655 milliards de dollars et celles de services à 168 milliards de dollars ; les services représentaient 20,5 % du total, contre 22,5 % en 1970.
L'Italie dans le classement mondial des exportations, 2025
| Rang | Pays | Exportations | Part mondiale | |
|---|---|---|---|---|
| 9 |
 Japon |
971 Md $US | 2,78 % | vs Japon |
| 10 |
 Inde |
881 Md $US | 2,52 % | |
| 11 |
 Corée du Sud |
857 Md $US | 2,46 % | vs Corée du Sud |
| 12 |
 Italie |
822 Md $US | 2,36 % | |
| 13 |
Suisse
|
815 Md $US | 2,33 % | vs Suisse |
| 14 |
 Canada |
727 Md $US | 2,08 % | vs Canada |
| 15 |
 Mexique |
727 Md $US | 2,08 % | vs Mexique |
Exportations de biens et services de l'Italie, % du PIB, 1970–2025
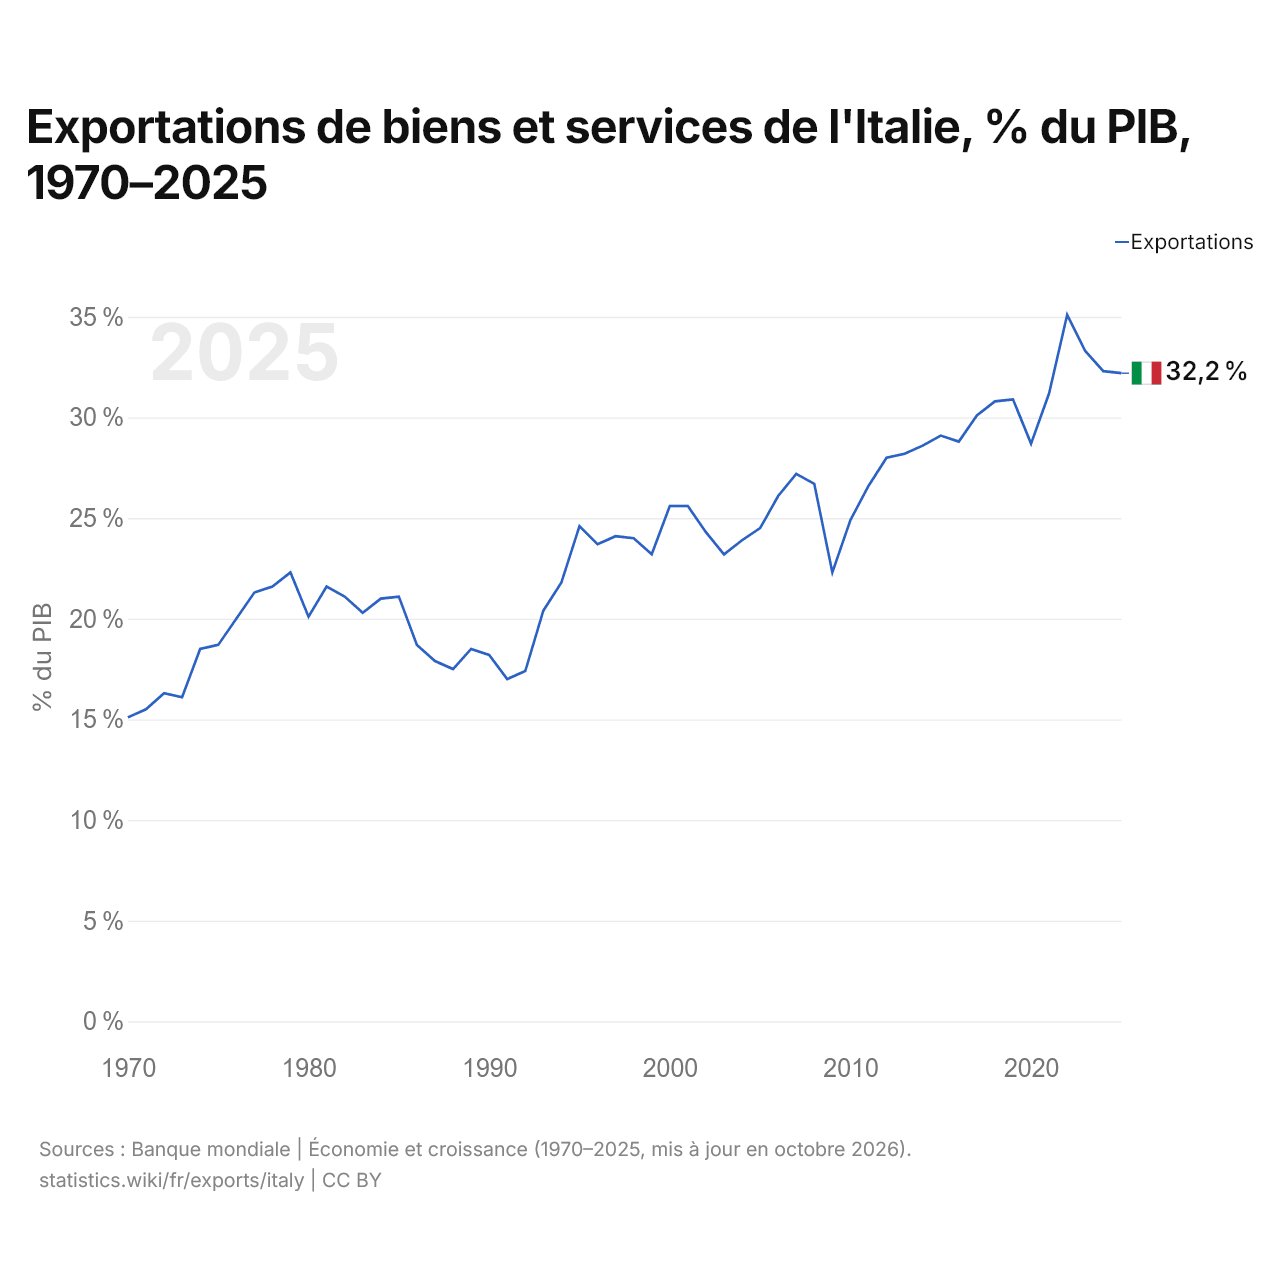
En 2025, les exportations de biens et services de l'Italie équivalaient à 32,2 % de son PIB, contre 15,1 % en 1970. La part la plus élevée a été de 35,1 %, en 2022.
Comparer les exportations de l'Italie avec celles d'autres pays
Sources :
- TradeMap (2001–2025, mis à jour en octobre 2026)
- Banque mondiale | Économie et croissance (1970–2025, mis à jour en octobre 2026)
Creative Commons Attribution (CC BY) : vous pouvez copier, partager, adapter et réutiliser ce contenu, y compris à des fins commerciales, à condition de citer statistics.wiki et d’indiquer les modifications apportées. Les sources citées ci-dessus peuvent avoir leurs propres conditions de licence.