
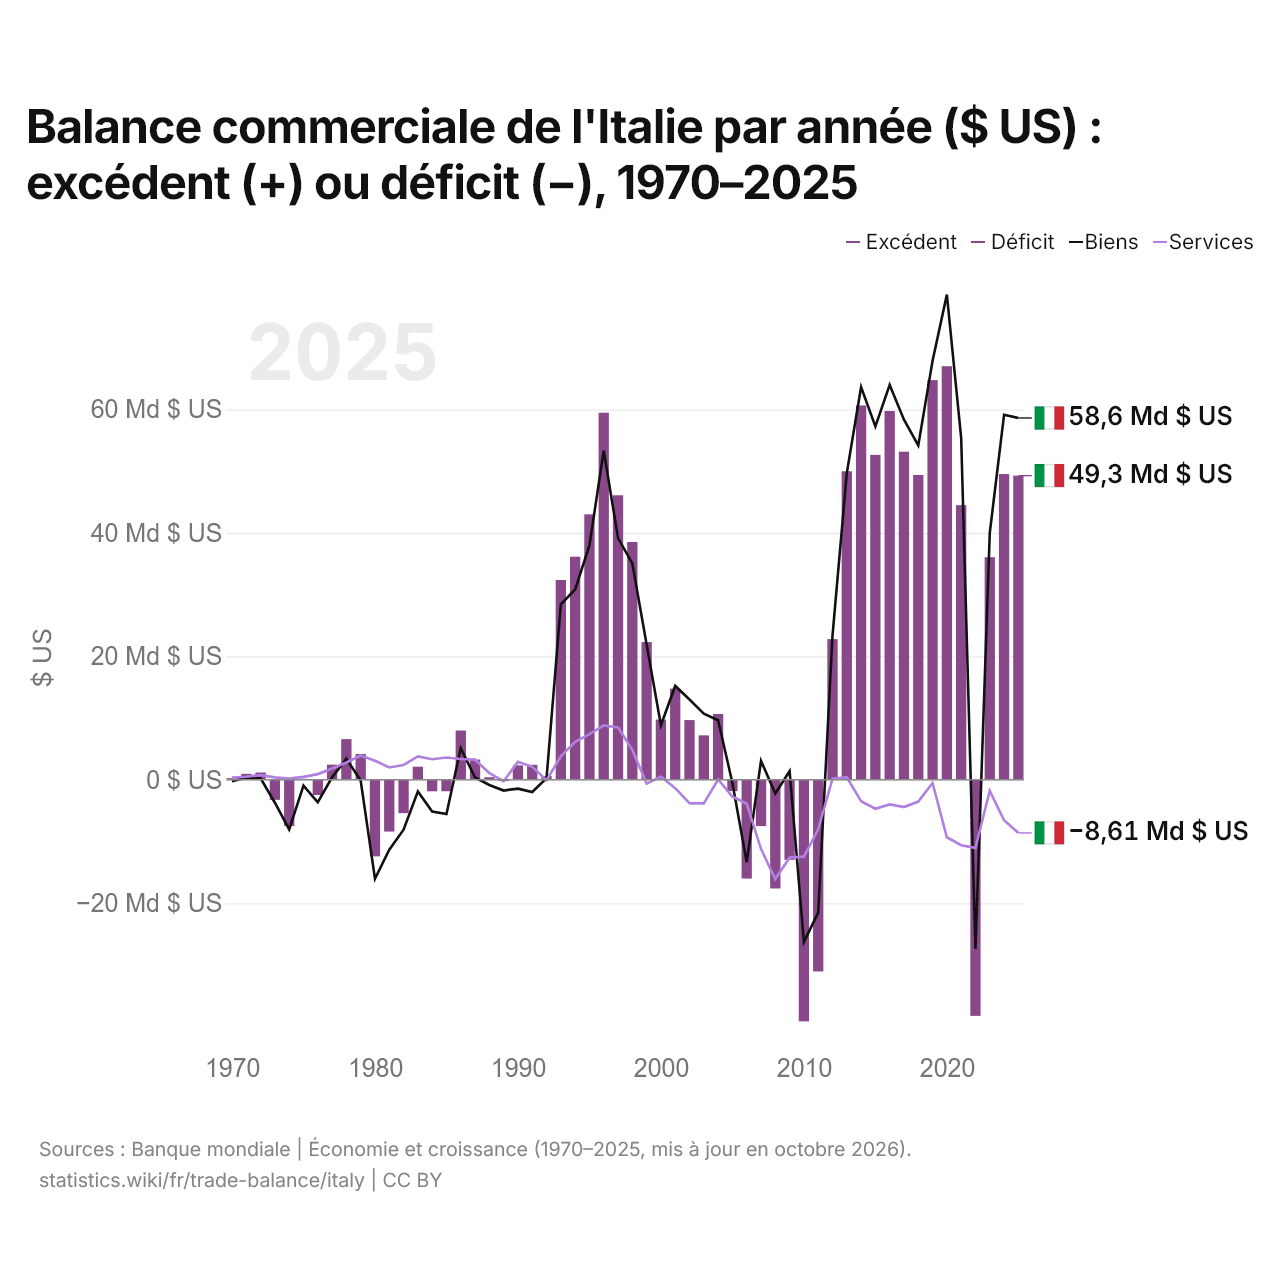
Balance commerciale de l'Italie par année ($ US) : excédent (+) ou déficit (−), 1970–2025
| Année | $ US | ||
|---|---|---|---|
| Biens et services | Biens | Services | |
| 2025 | 49 265 795 806 $ US | 58 612 777 180 $ US | −8 608 872 362 $ US |
| 2024 | 49 516 416 970 $ US | 59 124 064 107 $ US | −6 566 824 863 $ US |
| 2023 | 36 048 306 644 $ US | 39 978 246 757 $ US | −1 789 116 721 $ US |
| 2022 | −38 256 625 194 $ US | −27 399 637 760 $ US | −11 035 831 243 $ US |
| 2021 | 44 482 863 062 $ US | 55 402 858 493 $ US | −10 605 835 656 $ US |
| 2020 | 66 995 055 892 $ US | 78 586 803 501 $ US | −9 321 222 891 $ US |
| 2019 | 64 739 658 692 $ US | 67 886 716 262 $ US | −528 931 589 $ US |
| 2018 | 49 379 369 014 $ US | 54 146 885 809 $ US | −3 529 850 146 $ US |
| 2017 | 53 145 963 915 $ US | 58 329 492 999 $ US | −4 435 671 249 $ US |
| 2016 | 59 733 694 414 $ US | 63 970 946 724 $ US | −3 993 365 128 $ US |
| 2015 | 52 641 504 803 $ US | 57 228 245 127 $ US | −4 701 375 773 $ US |
| 2014 | 60 639 816 850 $ US | 63 606 483 544 $ US | −3 493 636 271 $ US |
| 2013 | 49 969 909 978 $ US | 49 671 804 923 $ US | 407 894 881 $ US |
| 2012 | 22 780 973 378 $ US | 23 304 413 451 $ US | 146 451 202 $ US |
| 2011 | −31 057 444 799 $ US | −21 536 890 745 $ US | −8 034 360 608 $ US |
| 2010 | −39 140 989 153 $ US | −26 270 620 312 $ US | −12 462 755 381 $ US |
| 2009 | −12 973 150 262 $ US | 1 374 359 051 $ US | −12 620 062 407 $ US |
| 2008 | −17 617 150 231 $ US | −2 223 430 234 $ US | −16 091 134 394 $ US |
| 2007 | −7 510 630 798 $ US | 3 059 930 661 $ US | −11 190 090 300 $ US |
| 2006 | −16 009 638 359 $ US | −13 370 427 991 $ US | −3 899 365 374 $ US |
| 2005 | −1 836 401 651 $ US | −519 141 941 $ US | −2 723 012 568 $ US |
| 2004 | 10 646 435 538 $ US | 9 646 218 877 $ US | 44 383 991 $ US |
| 2003 | 7 186 714 436 $ US | 10 701 141 110 $ US | −3 826 824 552 $ US |
| 2002 | 9 665 276 392 $ US | 13 001 028 771 $ US | −3 797 139 659 $ US |
| 2001 | 14 754 690 400 $ US | 15 199 152 526 $ US | −1 363 725 407 $ US |
| 2000 | 9 745 220 727 $ US | 8 814 250 513 $ US | 519 034 367 $ US |
| 1999 | 22 302 224 793 $ US | 21 916 401 433 $ US | −632 783 780 $ US |
| 1998 | 38 522 694 324 $ US | 35 048 394 405 $ US | 4 838 582 106 $ US |
| 1997 | 46 087 198 727 $ US | 39 147 359 744 $ US | 8 471 936 683 $ US |
| 1996 | 59 461 538 462 $ US | 53 337 519 976 $ US | 8 817 616 439 $ US |
| 1995 | 42 997 622 727 $ US | 37 947 877 352 $ US | 7 378 020 388 $ US |
| 1994 | 36 132 880 644 $ US | 30 812 195 597 $ US | 6 133 057 286 $ US |
| 1993 | 32 363 681 555 $ US | 28 424 289 476 $ US | 3 783 320 033 $ US |
| 1992 | 589 693 637 $ US | 252 201 485 $ US | −77 208 414 $ US |
| 1991 | 2 412 450 445 $ US | −1 985 705 482 $ US | 2 091 294 933 $ US |
| 1990 | 2 328 492 243 $ US | −1 441 176 675 $ US | 2 902 441 592 $ US |
| 1989 | −180 646 345 $ US | −1 747 173 314 $ US | −247 753 880 $ US |
| 1988 | 400 105 623 $ US | −856 199 160 $ US | 1 079 523 415 $ US |
| 1987 | 3 267 109 352 $ US | 353 301 864 $ US | 3 254 380 364 $ US |
| 1986 | 7 969 577 867 $ US | 5 111 070 217 $ US | 3 358 675 519 $ US |
| 1985 | −1 862 996 653 $ US | −5 550 502 784 $ US | 3 596 407 036 $ US |
| 1984 | −1 867 307 692 $ US | −5 164 570 228 $ US | 3 315 207 800 $ US |
| 1983 | 2 109 484 957 $ US | −1 894 341 036 $ US | 3 772 163 121 $ US |
| 1982 | −5 419 292 770 $ US | −8 090 427 882 $ US | 2 393 565 626 $ US |
| 1981 | −8 404 464 316 $ US | −11 330 296 399 $ US | 1 985 972 996 $ US |
| 1980 | −12 410 859 145 $ US | −16 040 403 208 $ US | 3 084 323 107 $ US |
| 1979 | 4 173 132 137 $ US | −118 413 035 $ US | 3 924 182 120 $ US |
| 1978 | 6 582 594 114 $ US | 3 393 179 698 $ US | 2 785 084 692 $ US |
| 1977 | 2 446 631 556 $ US | 392 938 533 $ US | 1 823 719 478 $ US |
| 1976 | −2 478 057 688 $ US | −3 653 621 520 $ US | 912 423 377 $ US |
| 1975 | 145 868 921 $ US | −951 324 153 $ US | 468 179 979 $ US |
| 1974 | −7 493 364 096 $ US | −8 057 060 099 $ US | 172 172 767 $ US |
| 1973 | −3 253 224 842 $ US | −3 722 193 119 $ US | 394 082 828 $ US |
| 1972 | 1 168 247 012 $ US | 220 968 539 $ US | 746 089 749 $ US |
| 1971 | 952 521 848 $ US | 328 290 637 $ US | 483 630 953 $ US |
| 1970 | 258 798 017 $ US | −223 519 840 $ US | 331 200 000 $ US |
En 2025, la balance commerciale de l'Italie affichait un excédent de 49,3 milliards de dollars, contre un excédent de 259 millions de dollars en 1970. Le plus grand déficit a été de 39,1 milliards de dollars, en 2010, et le plus grand excédent de 67 milliards de dollars, en 2020. La balance commerciale de l'Italie est excédentaire chaque année depuis 2023. Le commerce de biens affichait un excédent de 58,6 milliards de dollars et celui de services un déficit de 8,61 milliards de dollars.
En 2025, le solde commercial de l'Italie était le 9e plus élevé de 41 pays situés en Europe, où les soldes allaient d'un déficit de 56,8 milliards de dollars en Ukraine à un excédent de 290 milliards de dollars en Irlande. De 2016 à 2025, les soldes commerciaux de l'Italie ont totalisé un excédent de 435 milliards de dollars, contre un excédent de 61,7 milliards de dollars de 2006 à 2015. En 2025, les transactions courantes de l'Italie affichaient un excédent de 1,1 % du PIB.
Commerce de biens de l'Italie avec ses 10 principaux partenaires commerciaux, selon l'Italie, 2025
| Pays | Exportations vers | Importations depuis | Solde | |
|---|---|---|---|---|
 Allemagne |
81,6 Md $US | 96,7 Md $US | −15,1 Md $US | vs Allemagne |
 France |
73,4 Md $US | 53,5 Md $US | +19,9 Md $US | vs France |
 États-Unis |
78,7 Md $US | 40,0 Md $US | +38,7 Md $US | vs USA |
 Chine |
16,2 Md $US | 68,5 Md $US | −52,3 Md $US | vs Chine |
 Espagne |
43,1 Md $US | 37,4 Md $US | +5,72 Md $US | vs Espagne |
 Pays-Bas |
21,3 Md $US | 44,5 Md $US | −23,1 Md $US | vs Pays-Bas |
 Suisse |
39,7 Md $US | 17,4 Md $US | +22,3 Md $US | vs Suisse |
 Belgique |
22,6 Md $US | 29,9 Md $US | −7,31 Md $US | vs Belgique |
 Pologne |
23,5 Md $US | 18,0 Md $US | +5,53 Md $US | vs Pologne |
 Royaume-Uni |
30,5 Md $US | 8,48 Md $US | +22,0 Md $US | vs R.-U. |
Balance commerciale de l'Italie : excédent (+) ou déficit (−)
| Biens et services, $ US, 2025 | +49,3 Md $US |
|---|---|
| % du PIB, 2025 | +1,9 % |
| Années d'excédent, 2000–2025 | 18 |
| Biens, $ US, 2025 | +58,6 Md $US |
| Services, $ US, 2025 | −8,61 Md $US |
| Premier excédent en biens, 2025 | États-Unis +38,7 Md $US |
| Premier déficit en biens, 2025 | Chine −52,3 Md $US |
Comparer la balance commerciale de l'Italie avec celle d'autres pays
Sources :
- TradeMap (2025, mis à jour en octobre 2026)
- Banque mondiale | Économie et croissance (1970–2025, mis à jour en octobre 2026)
Creative Commons Attribution (CC BY) : vous pouvez copier, partager, adapter et réutiliser ce contenu, y compris à des fins commerciales, à condition de citer statistics.wiki et d’indiquer les modifications apportées. Les sources citées ci-dessus peuvent avoir leurs propres conditions de licence.