
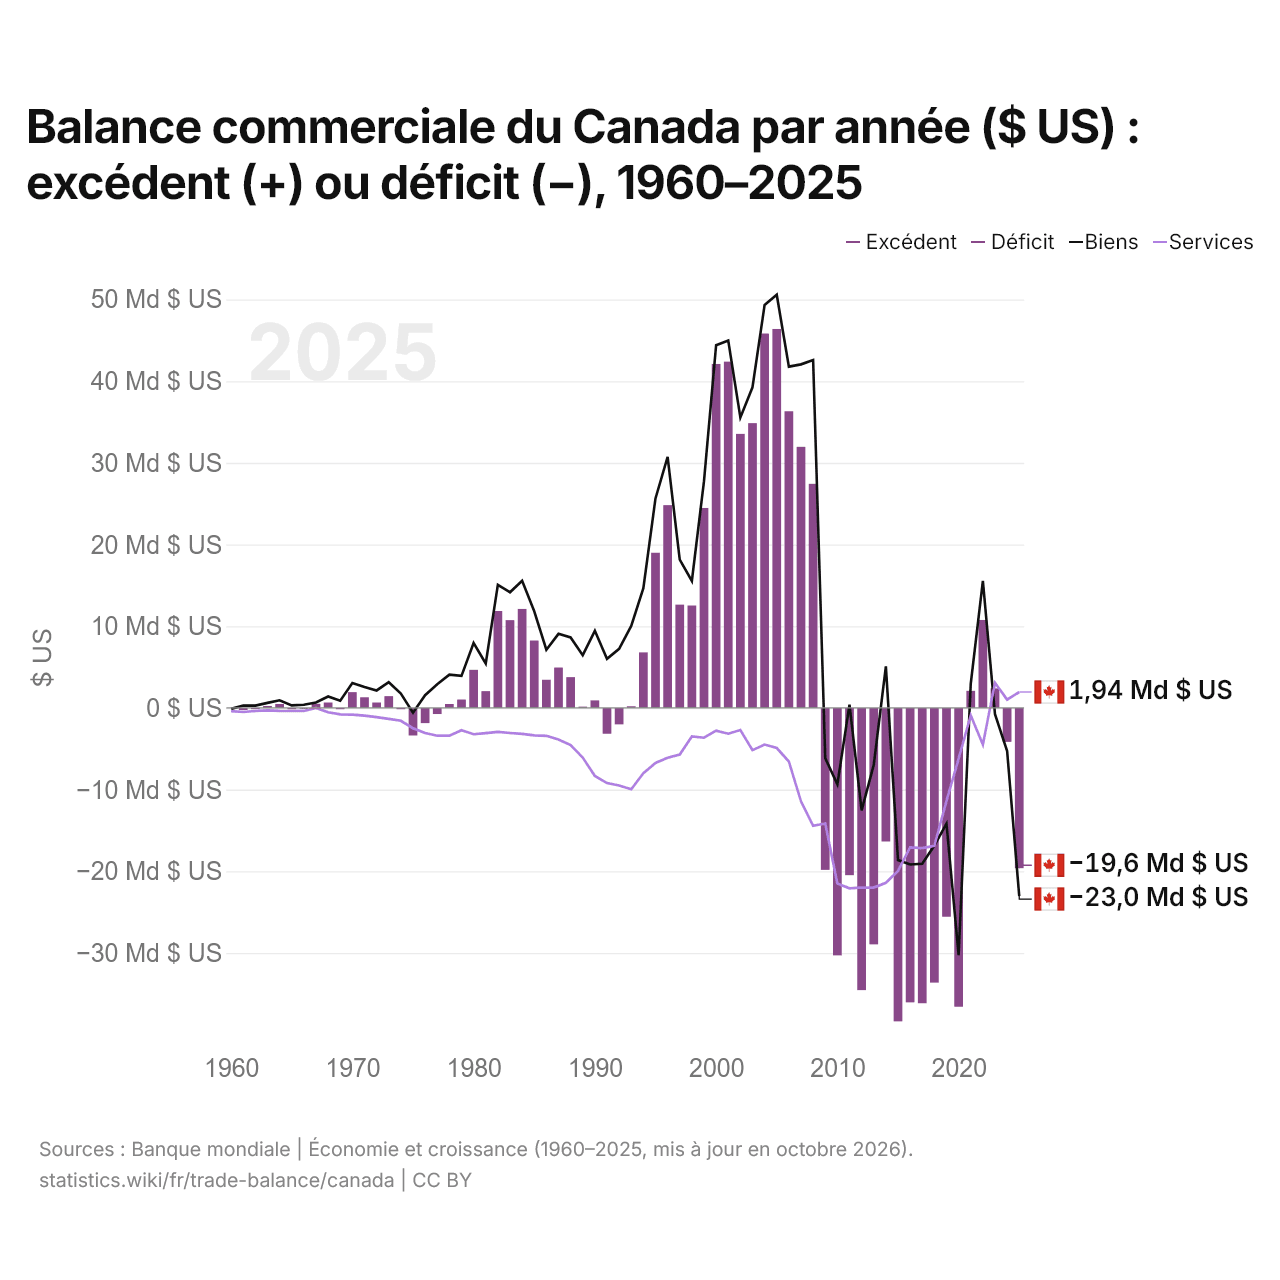
Balance commerciale du Canada par année ($ US) : excédent (+) ou déficit (−), 1960–2025
| Année | $ US | ||
|---|---|---|---|
| Biens et services | Biens | Services | |
| 2025 | −19 620 119 427 $ US | −23 039 171 958 $ US | 1 942 021 033 $ US |
| 2024 | −4 160 338 387 $ US | −5 275 674 611 $ US | 1 011 272 588 $ US |
| 2023 | 2 389 050 564 $ US | −780 575 658 $ US | 3 071 750 899 $ US |
| 2022 | 10 766 354 419 $ US | 15 539 503 927 $ US | −4 488 965 762 $ US |
| 2021 | 2 089 519 311 $ US | 2 954 102 386 $ US | −926 792 133 $ US |
| 2020 | −36 581 964 914 $ US | −30 276 769 556 $ US | −6 222 474 615 $ US |
| 2019 | −25 564 644 017 $ US | −14 168 446 320 $ US | −11 369 656 456 $ US |
| 2018 | −33 628 018 589 $ US | −16 838 323 018 $ US | −16 894 451 254 $ US |
| 2017 | −36 155 870 206 $ US | −19 083 002 965 $ US | −17 154 670 630 $ US |
| 2016 | −36 038 362 646 $ US | −19 170 157 631 $ US | −17 071 519 278 $ US |
| 2015 | −38 367 633 198 $ US | −18 615 268 414 $ US | −19 968 507 458 $ US |
| 2014 | −16 351 253 124 $ US | 5 082 947 780 $ US | −21 403 946 779 $ US |
| 2013 | −28 939 829 822 $ US | −6 985 293 400 $ US | −21 996 789 530 $ US |
| 2012 | −34 546 946 169 $ US | −12 533 624 908 $ US | −21 984 709 974 $ US |
| 2011 | −20 478 981 976 $ US | 399 528 230 $ US | −22 082 193 052 $ US |
| 2010 | −30 298 625 514 $ US | −9 366 834 177 $ US | −21 508 163 813 $ US |
| 2009 | −19 832 035 692 $ US | −6 152 698 446 $ US | −14 141 901 389 $ US |
| 2008 | 27 432 052 484 $ US | 42 578 539 711 $ US | −14 434 292 232 $ US |
| 2007 | 31 956 987 245 $ US | 42 050 053 468 $ US | −11 438 381 843 $ US |
| 2006 | 36 316 114 245 $ US | 41 771 546 320 $ US | −6 567 185 938 $ US |
| 2005 | 46 388 017 825 $ US | 50 584 058 885 $ US | −4 905 948 272 $ US |
| 2004 | 45 822 444 274 $ US | 49 337 692 146 $ US | −4 490 932 883 $ US |
| 2003 | 34 853 329 527 $ US | 39 243 331 994 $ US | −5 169 509 189 $ US |
| 2002 | 33 546 804 308 $ US | 35 546 404 409 $ US | −2 706 502 983 $ US |
| 2001 | 42 385 717 975 $ US | 44 975 962 206 $ US | −3 156 871 838 $ US |
| 2000 | 42 102 888 694 $ US | 44 395 097 409 $ US | −2 790 723 659 $ US |
| 1999 | 24 472 639 160 $ US | 27 749 942 447 $ US | −3 653 302 582 $ US |
| 1998 | 12 535 220 762 $ US | 15 543 564 648 $ US | −3 495 255 013 $ US |
| 1997 | 12 636 862 632 $ US | 18 148 573 618 $ US | −5 718 598 919 $ US |
| 1996 | 24 825 815 915 $ US | 30 736 137 788 $ US | −6 106 849 745 $ US |
| 1995 | 18 993 004 955 $ US | 25 642 432 140 $ US | −6 738 348 551 $ US |
| 1994 | 6 794 815 466 $ US | 14 645 299 572 $ US | −7 997 497 911 $ US |
| 1993 | 199 209 364 $ US | 10 030 323 810 $ US | −9 967 116 859 $ US |
| 1992 | −2 019 525 110 $ US | 7 233 222 857 $ US | −9 494 312 177 $ US |
| 1991 | −3 165 750 196 $ US | 5 999 404 144 $ US | −9 204 154 587 $ US |
| 1990 | 918 752 143 $ US | 9 436 901 245 $ US | −8 320 937 460 $ US |
| 1989 | 147 804 054 $ US | 6 448 845 008 $ US | −6 085 280 970 $ US |
| 1988 | 3 769 399 529 $ US | 8 630 479 350 $ US | −4 552 771 707 $ US |
| 1987 | 4 939 668 175 $ US | 9 067 135 947 $ US | −3 867 453 644 $ US |
| 1986 | 3 449 442 245 $ US | 7 116 043 789 $ US | −3 418 207 605 $ US |
| 1985 | 8 246 063 713 $ US | 11 835 360 286 $ US | −3 357 756 721 $ US |
| 1984 | 12 115 666 744 $ US | 15 562 790 432 $ US | −3 185 715 116 $ US |
| 1983 | 10 738 396 624 $ US | 14 157 510 545 $ US | −3 075 216 529 $ US |
| 1982 | 11 860 257 761 $ US | 15 066 170 347 $ US | −2 935 324 655 $ US |
| 1981 | 2 048 544 499 $ US | 5 443 125 599 $ US | −3 081 736 729 $ US |
| 1980 | 4 663 017 448 $ US | 7 938 443 396 $ US | −3 221 048 316 $ US |
| 1979 | 1 021 854 192 $ US | 3 920 647 988 $ US | −2 736 405 070 $ US |
| 1978 | 476 900 149 $ US | 4 066 363 200 $ US | −3 399 680 647 $ US |
| 1977 | −752 233 192 $ US | 2 893 057 223 $ US | −3 403 460 403 $ US |
| 1976 | −1 865 111 562 $ US | 1 552 512 657 $ US | −3 068 509 928 $ US |
| 1975 | −3 376 917 027 $ US | −591 195 469 $ US | −2 484 693 657 $ US |
| 1974 | −156 441 718 $ US | 1 759 298 520 $ US | −1 570 491 704 $ US |
| 1973 | 1 435 856 414 $ US | 3 143 501 917 $ US | −1 345 016 570 $ US |
| 1972 | 656 631 983 $ US | 2 132 910 126 $ US | −1 134 194 502 $ US |
| 1971 | 1 299 267 182 $ US | 2 547 615 166 $ US | −947 966 115 $ US |
| 1970 | 1 937 027 467 $ US | 3 050 216 286 $ US | −824 910 482 $ US |
| 1969 | −156 950 159 $ US | 875 839 685 $ US | −784 262 588 $ US |
| 1968 | 661 732 320 $ US | 1 394 868 909 $ US | −531 391 363 $ US |
| 1967 | 496 890 701 $ US | 665 722 941 $ US | −6 485 049 $ US |
| 1966 | −112 316 059 $ US | 389 043 616 $ US | −374 297 589 $ US |
| 1965 | −169 761 486 $ US | 306 004 778 $ US | −378 919 144 $ US |
| 1964 | 479 321 480 $ US | 934 332 464 $ US | −370 704 309 $ US |
| 1963 | 240 146 569 $ US | 617 983 040 $ US | −308 704 281 $ US |
| 1962 | −155 319 174 $ US | 285 141 685 $ US | −380 525 816 $ US |
| 1961 | −264 543 212 $ US | 285 679 645 $ US | −497 800 626 $ US |
| 1960 | - | −119 902 498 $ US | −387 062 599 $ US |
En 2025, la balance commerciale du Canada affichait un déficit de 19,6 milliards de dollars, contre un déficit de 265 millions de dollars en 1961. Le plus grand déficit a été de 38,4 milliards de dollars, en 2015, et le plus grand excédent de 46,4 milliards de dollars, en 2005.
En 2025, le déficit commercial du Canada était le plus faible des deux pays situés en Amérique du Nord, devant les États-Unis (déficit de 932 milliards de dollars). De 2016 à 2025, les soldes commerciaux du Canada ont totalisé un déficit de 177 milliards de dollars, contre un déficit de 93,1 milliards de dollars de 2006 à 2015. En 2025, les transactions courantes du Canada affichaient un déficit de 1,0 % du PIB.
Commerce de biens du Canada avec ses 10 principaux partenaires commerciaux, selon le Canada, 2025
| Pays | Exportations vers | Importations depuis | Solde | |
|---|---|---|---|---|
 États-Unis |
404 Md $US | 259 Md $US | +145 Md $US | vs USA |
 Chine |
24,4 Md $US | 64,8 Md $US | −40,4 Md $US | vs Chine |
 Mexique |
6,35 Md $US | 38,2 Md $US | −31,8 Md $US | vs Mexique |
 Royaume-Uni |
33,4 Md $US | 7,11 Md $US | +26,3 Md $US | vs R.-U. |
 Japon |
10,4 Md $US | 15,1 Md $US | −4,66 Md $US | vs Japon |
 Allemagne |
6,53 Md $US | 18,0 Md $US | −11,4 Md $US | vs Allemagne |
 Corée du Sud |
5,06 Md $US | 12,4 Md $US | −7,32 Md $US | vs Corée du Sud |
 Vietnam |
945 M $US | 13,8 Md $US | −12,8 Md $US | vs Vietnam |
 Italie |
2,80 Md $US | 9,76 Md $US | −6,96 Md $US | vs Italie |
 France |
3,59 Md $US | 7,30 Md $US | −3,70 Md $US | vs France |
Balance commerciale du Canada : excédent (+) ou déficit (−)
| Biens et services, $ US, 2025 | −19,6 Md $US |
|---|---|
| % du PIB, 2025 | −0,8 % |
| Années d'excédent, 2000–2025 | 12 |
| Biens, $ US, 2025 | −23,0 Md $US |
| Services, $ US, 2025 | +1,94 Md $US |
| Premier excédent en biens, 2025 | États-Unis +145 Md $US |
| Premier déficit en biens, 2025 | Chine −40,4 Md $US |
Comparer la balance commerciale du Canada avec celle d'autres pays
Sources :
- TradeMap (2025, mis à jour en octobre 2026)
- Banque mondiale | Économie et croissance (1960–2025, mis à jour en octobre 2026)
Creative Commons Attribution (CC BY) : vous pouvez copier, partager, adapter et réutiliser ce contenu, y compris à des fins commerciales, à condition de citer statistics.wiki et d’indiquer les modifications apportées. Les sources citées ci-dessus peuvent avoir leurs propres conditions de licence.