
Le Costa Rica et le Canada : solde de leur commerce de biens bilatéral, selon chacun ($ US), 2001–2025
| Année | $ US | |
|---|---|---|
| Costa Rica | Canada | |
| 2025 | −178 160 000 $ US | −393 198 000 $ US |
| 2024 | −154 383 000 $ US | −326 896 000 $ US |
| 2023 | −185 310 000 $ US | −296 739 000 $ US |
| 2022 | −166 686 000 $ US | −281 893 000 $ US |
| 2021 | −100 016 000 $ US | −325 771 000 $ US |
| 2020 | −95 926 000 $ US | −305 339 000 $ US |
| 2019 | −54 751 000 $ US | −331 156 000 $ US |
| 2018 | −74 053 000 $ US | −281 710 000 $ US |
| 2017 | −80 004 000 $ US | −274 947 000 $ US |
| 2016 | −68 632 000 $ US | −274 883 000 $ US |
| 2015 | −56 305 000 $ US | −266 691 000 $ US |
| 2014 | −114 411 000 $ US | −385 156 000 $ US |
| 2013 | −83 794 000 $ US | −462 545 000 $ US |
| 2012 | −167 377 000 $ US | −328 214 000 $ US |
| 2011 | −107 109 000 $ US | −318 465 000 $ US |
| 2010 | −20 416 000 $ US | −326 490 000 $ US |
| 2009 | −53 123 000 $ US | −244 968 000 $ US |
| 2008 | −102 458 000 $ US | −253 221 000 $ US |
| 2007 | −50 863 000 $ US | −268 170 000 $ US |
| 2006 | −16 859 000 $ US | −282 971 000 $ US |
| 2005 | −23 144 000 $ US | −221 344 000 $ US |
| 2004 | −48 539 000 $ US | −183 998 000 $ US |
| 2003 | −43 957 000 $ US | −161 580 000 $ US |
| 2002 | −41 712 000 $ US | −108 256 000 $ US |
| 2001 | −44 497 000 $ US | −81 355 000 $ US |
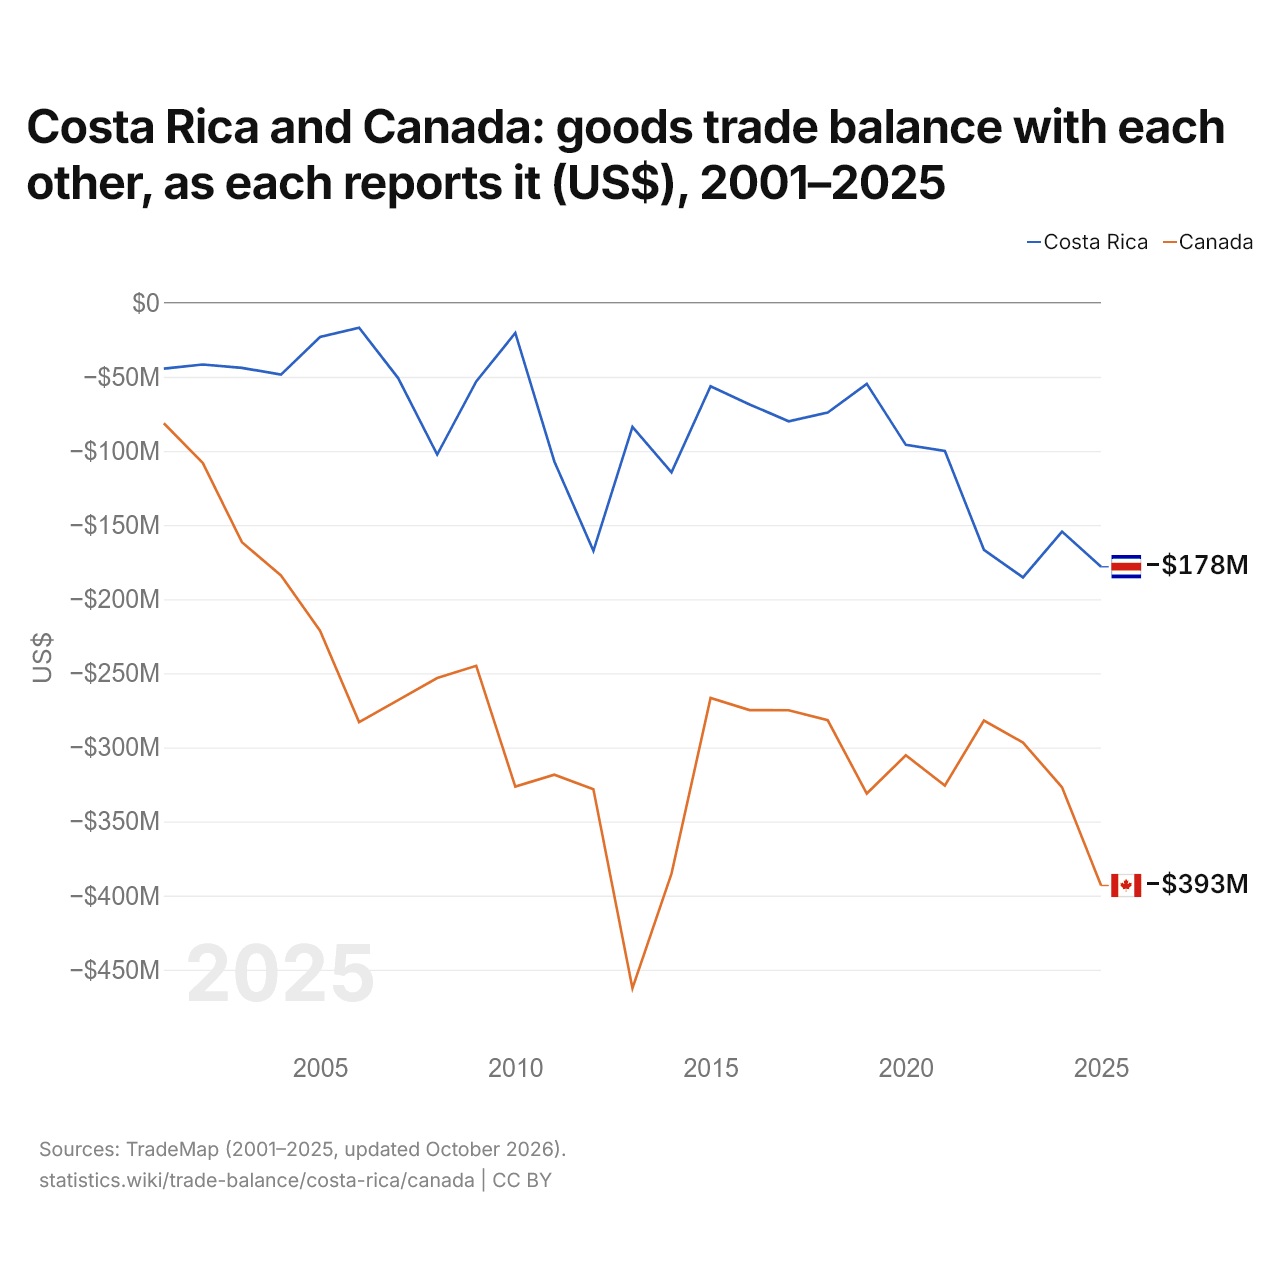
En 2025, selon le Costa Rica, son commerce de biens avec le Canada affichait un déficit de 178 millions de dollars ; selon le Canada, son commerce de biens avec le Costa Rica affichait un déficit de 393 millions de dollars. En 2001, les chiffres étaient un déficit de 44,5 millions de dollars pour le Costa Rica et un déficit de 81,4 millions de dollars pour le Canada.
Costa Rica vs Canada : balance commerciale par année ($ US), 1960–2025
| Année | $ US | |
|---|---|---|
 Costa Rica |
 Canada |
|
| 2025 | 6 388 241 982 $ US | −19 620 119 427 $ US |
| 2024 | 5 035 307 503 $ US | −4 160 338 387 $ US |
| 2023 | 4 159 883 783 $ US | 2 389 050 564 $ US |
| 2022 | 1 508 939 813 $ US | 10 766 354 419 $ US |
| 2021 | 1 020 579 727 $ US | 2 089 519 311 $ US |
| 2020 | 2 291 858 848 $ US | −36 581 964 914 $ US |
| 2019 | 1 861 743 506 $ US | −25 564 644 017 $ US |
| 2018 | 331 875 262 $ US | −33 628 018 589 $ US |
| 2017 | 274 387 327 $ US | −36 155 870 206 $ US |
| 2016 | 201 088 459 $ US | −36 038 362 646 $ US |
| 2015 | −430 226 387 $ US | −38 367 633 198 $ US |
| 2014 | −1 282 418 430 $ US | −16 351 253 124 $ US |
| 2013 | −1 468 936 015 $ US | −28 939 829 822 $ US |
| 2012 | −1 769 252 761 $ US | −34 546 946 169 $ US |
| 2011 | −1 579 738 366 $ US | −20 478 981 976 $ US |
| 2010 | −697 914 668 $ US | −30 298 625 514 $ US |
| 2009 | −152 101 398 $ US | −19 832 035 692 $ US |
| 2008 | −2 707 039 847 $ US | 27 432 052 484 $ US |
| 2007 | −1 422 824 731 $ US | 31 956 987 245 $ US |
| 2006 | −723 827 090 $ US | 36 316 114 245 $ US |
| 2005 | −459 655 981 $ US | 46 388 017 825 $ US |
| 2004 | −156 546 480 $ US | 45 822 444 274 $ US |
| 2003 | −342 720 363 $ US | 34 853 329 527 $ US |
| 2002 | −325 752 876 $ US | 33 546 804 308 $ US |
| 2001 | 26 262 657 $ US | 42 385 717 975 $ US |
| 2000 | −99 732 308 $ US | 42 102 888 694 $ US |
| 1999 | −345 378 745 $ US | 24 472 639 160 $ US |
| 1998 | −562 742 719 $ US | 12 535 220 762 $ US |
| 1997 | −554 419 175 $ US | 12 636 862 632 $ US |
| 1996 | −471 011 506 $ US | 24 825 815 915 $ US |
| 1995 | −407 096 810 $ US | 18 993 004 955 $ US |
| 1994 | −653 309 769 $ US | 6 794 815 466 $ US |
| 1993 | −696 116 962 $ US | 199 209 364 $ US |
| 1992 | −474 694 622 $ US | −2 019 525 110 $ US |
| 1991 | −333 904 177 $ US | −3 165 750 196 $ US |
| 1990 | −394 370 767 $ US | 918 752 143 $ US |
| 1989 | −203 773 887 $ US | 147 804 054 $ US |
| 1988 | −82 456 788 $ US | 3 769 399 529 $ US |
| 1987 | −187 400 032 $ US | 4 939 668 175 $ US |
| 1986 | 37 374 552 $ US | 3 449 442 245 $ US |
| 1985 | −68 700 990 $ US | 8 246 063 713 $ US |
| 1984 | 15 024 920 $ US | 12 115 666 744 $ US |
| 1983 | −23 463 184 $ US | 10 738 396 624 $ US |
| 1982 | 76 088 041 $ US | 11 860 257 761 $ US |
| 1981 | −128 771 636 $ US | 2 048 544 499 $ US |
| 1980 | −499 626 604 $ US | 4 663 017 448 $ US |
| 1979 | −414 469 078 $ US | 1 021 854 192 $ US |
| 1978 | −276 581 097 $ US | 476 900 149 $ US |
| 1977 | −167 934 656 $ US | −752 233 192 $ US |
| 1976 | −144 795 799 $ US | −1 865 111 562 $ US |
| 1975 | −166 394 399 $ US | −3 376 917 027 $ US |
| 1974 | −249 609 079 $ US | −156 441 718 $ US |
| 1973 | −92 857 300 $ US | 1 435 856 414 $ US |
| 1972 | −78 975 132 $ US | 656 631 983 $ US |
| 1971 | −111 065 280 $ US | 1 299 267 182 $ US |
| 1970 | −66 415 094 $ US | 1 937 027 467 $ US |
| 1969 | −45 720 755 $ US | −156 950 159 $ US |
| 1968 | −36 286 792 $ US | 661 732 320 $ US |
| 1967 | −44 332 075 $ US | 496 890 701 $ US |
| 1966 | −38 792 453 $ US | −112 316 059 $ US |
| 1965 | −63 003 774 $ US | −169 761 486 $ US |
| 1964 | −22 510 940 $ US | 479 321 480 $ US |
| 1963 | −25 804 123 $ US | 240 146 569 $ US |
| 1962 | −15 939 610 $ US | −155 319 174 $ US |
| 1961 | −20 571 792 $ US | −264 543 212 $ US |
| 1960 | −24 821 248 $ US | - |
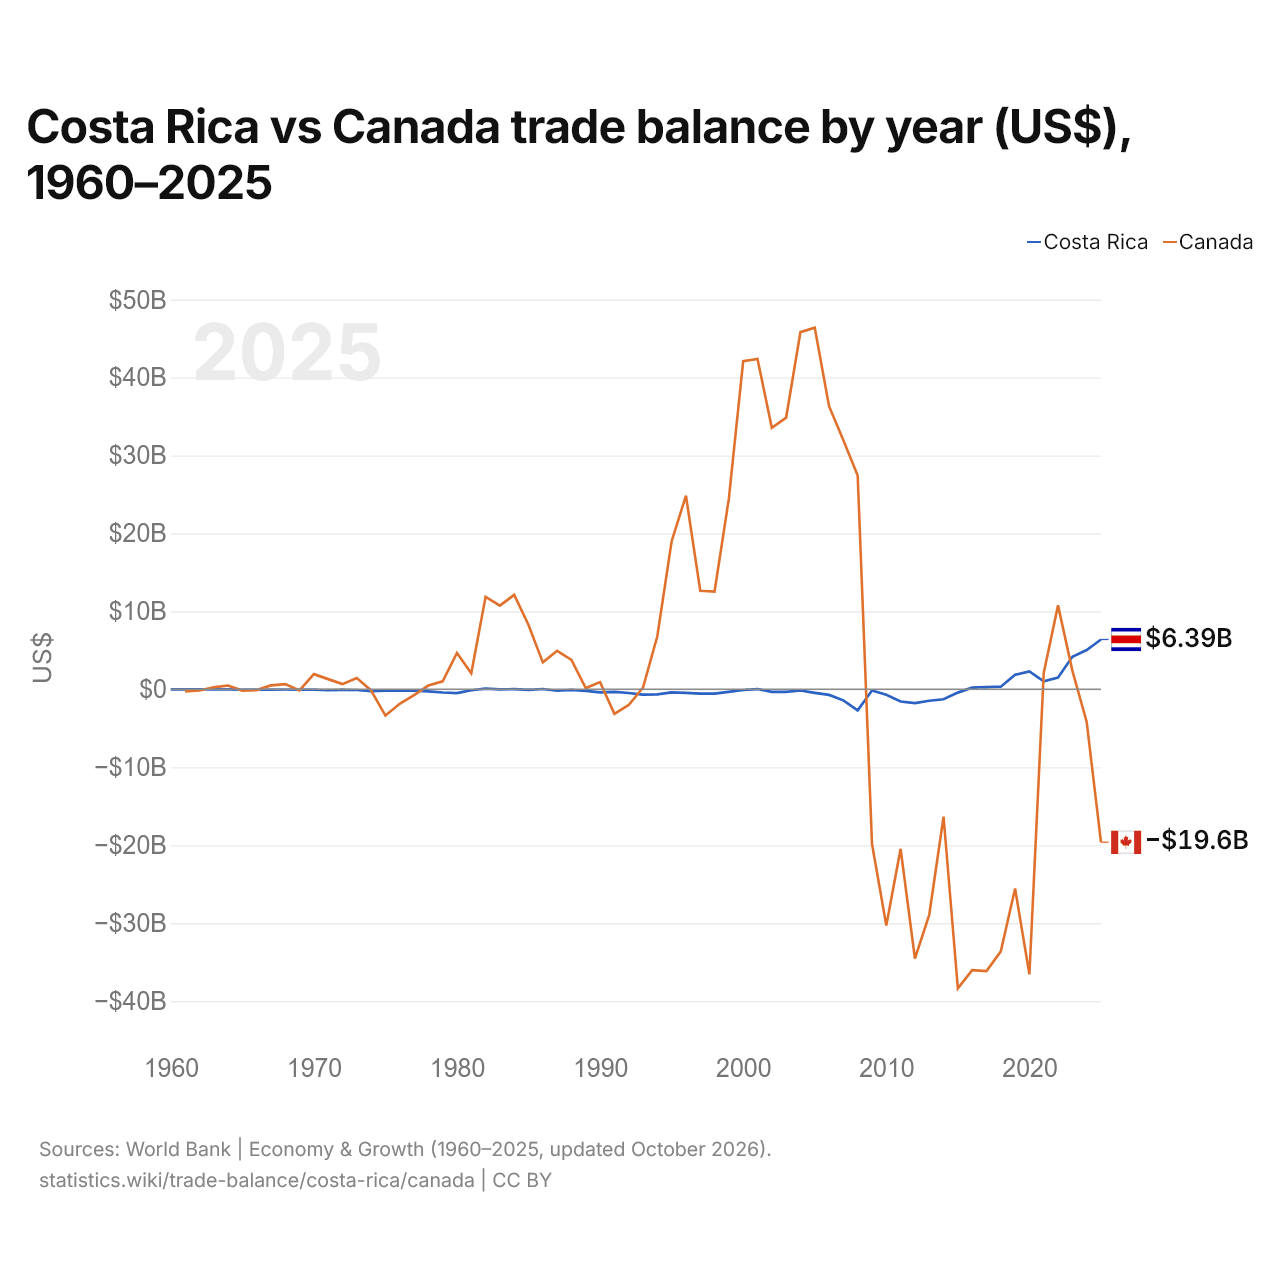
En 2025, la balance commerciale du Costa Rica affichait un excédent de 6,39 milliards de dollars et celle du Canada un déficit de 19,6 milliards de dollars. En 1961, la balance commerciale du Costa Rica affichait un déficit de 20,6 millions de dollars et celle du Canada un déficit de 265 millions de dollars.
De 1961 à 2025, la balance commerciale du Costa Rica a été excédentaire pendant 14 des 65 années, et celle du Canada pendant 40. Les balances commerciales du Costa Rica et du Canada ont été déficitaires en même temps pendant 18 de ces années, la dernière fois en 2015.
Costa Rica vs Canada : chiffres de la balance commerciale
|
Costa Rica
|
Canada
|
|
|---|---|---|
| Biens et services, $ US | +6,39 Md $US (2025) | −19,6 Md $US (2025) |
| % du PIB | +6,2 % (2025) | −0,8 % (2025) |
| Années d'excédent depuis 2000 | 11 sur 26 | 12 sur 26 |
| Solde des biens entre les deux, chiffres propres | −178 M $US (2025) | −393 M $US (2025) |
| Premier excédent en biens avec | Pays-Bas (+1,97 Md $US, 2025) | États-Unis (+145 Md $US, 2025) |
| Premier déficit en biens avec | Chine (−4,18 Md $US, 2025) | Chine (−40,4 Md $US, 2025) |
Comparer la balance commerciale de 2 pays au choix
Sources :
- Banque mondiale | Économie et croissance (1960–2025, mis à jour en octobre 2026)
- TradeMap (2001–2025, mis à jour en octobre 2026)
Creative Commons Attribution (CC BY) : vous pouvez copier, partager, adapter et réutiliser ce contenu, y compris à des fins commerciales, à condition de citer statistics.wiki et d’indiquer les modifications apportées. Les sources citées ci-dessus peuvent avoir leurs propres conditions de licence.