
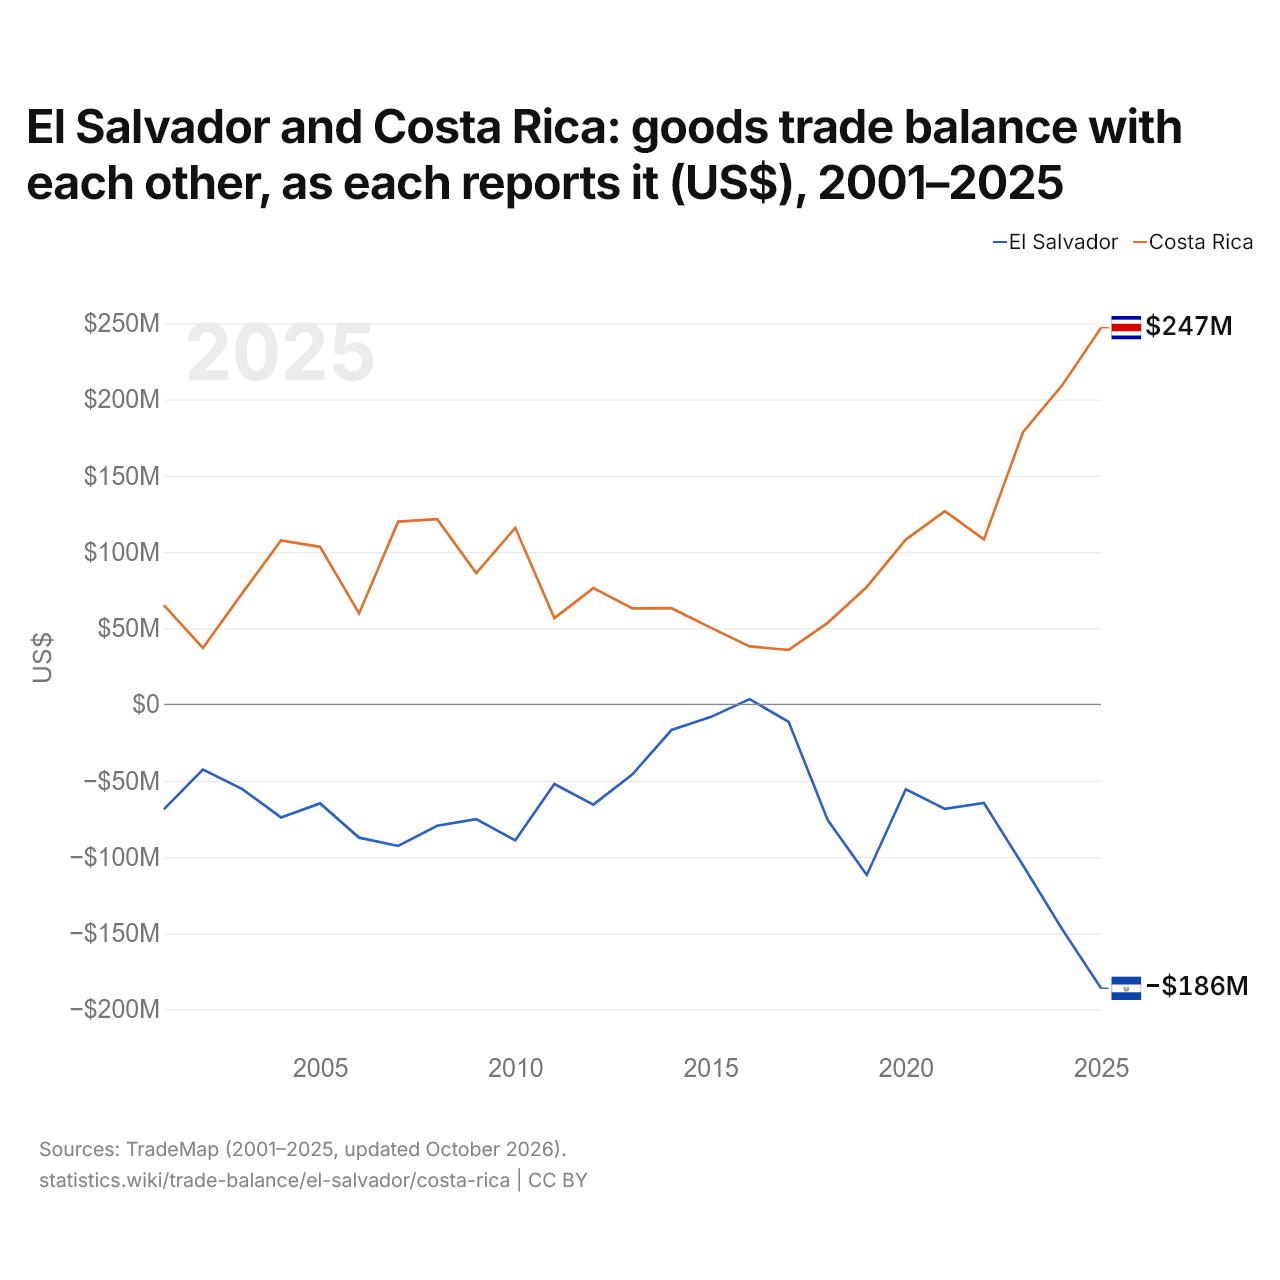
Le Salvador et le Costa Rica : solde de leur commerce de biens bilatéral, selon chacun ($ US), 2001–2025
| Année | $ US | |
|---|---|---|
| Salvador | Costa Rica | |
| 2025 | −186 128 000 $ US | 247 015 000 $ US |
| 2024 | −147 295 000 $ US | 209 152 000 $ US |
| 2023 | −105 481 000 $ US | 178 486 000 $ US |
| 2022 | −64 655 000 $ US | 108 218 000 $ US |
| 2021 | −68 506 000 $ US | 126 710 000 $ US |
| 2020 | −55 597 000 $ US | 108 095 000 $ US |
| 2019 | −111 845 000 $ US | 77 012 000 $ US |
| 2018 | −75 849 000 $ US | 53 497 000 $ US |
| 2017 | −11 466 000 $ US | 35 713 000 $ US |
| 2016 | 3 480 000 $ US | 38 075 000 $ US |
| 2015 | −8 309 000 $ US | 50 382 000 $ US |
| 2014 | −16 781 000 $ US | 63 106 000 $ US |
| 2013 | −45 823 000 $ US | 62 952 000 $ US |
| 2012 | −65 676 000 $ US | 76 256 000 $ US |
| 2011 | −52 216 000 $ US | 56 602 000 $ US |
| 2010 | −89 126 000 $ US | 115 817 000 $ US |
| 2009 | −75 194 000 $ US | 86 149 000 $ US |
| 2008 | −79 528 000 $ US | 121 532 000 $ US |
| 2007 | −92 794 000 $ US | 119 886 000 $ US |
| 2006 | −87 345 000 $ US | 59 673 000 $ US |
| 2005 | −64 875 000 $ US | 103 326 000 $ US |
| 2004 | −74 075 000 $ US | 107 468 000 $ US |
| 2003 | −55 331 000 $ US | 72 683 000 $ US |
| 2002 | −42 692 000 $ US | 37 018 000 $ US |
| 2001 | −68 840 000 $ US | 65 065 000 $ US |
En 2025, selon le Salvador, son commerce de biens avec le Costa Rica affichait un déficit de 186 millions de dollars ; selon le Costa Rica, son commerce de biens avec le Salvador affichait un excédent de 247 millions de dollars. En 2001, les chiffres étaient un déficit de 68,8 millions de dollars pour le Salvador et un excédent de 65,1 millions de dollars pour le Costa Rica.
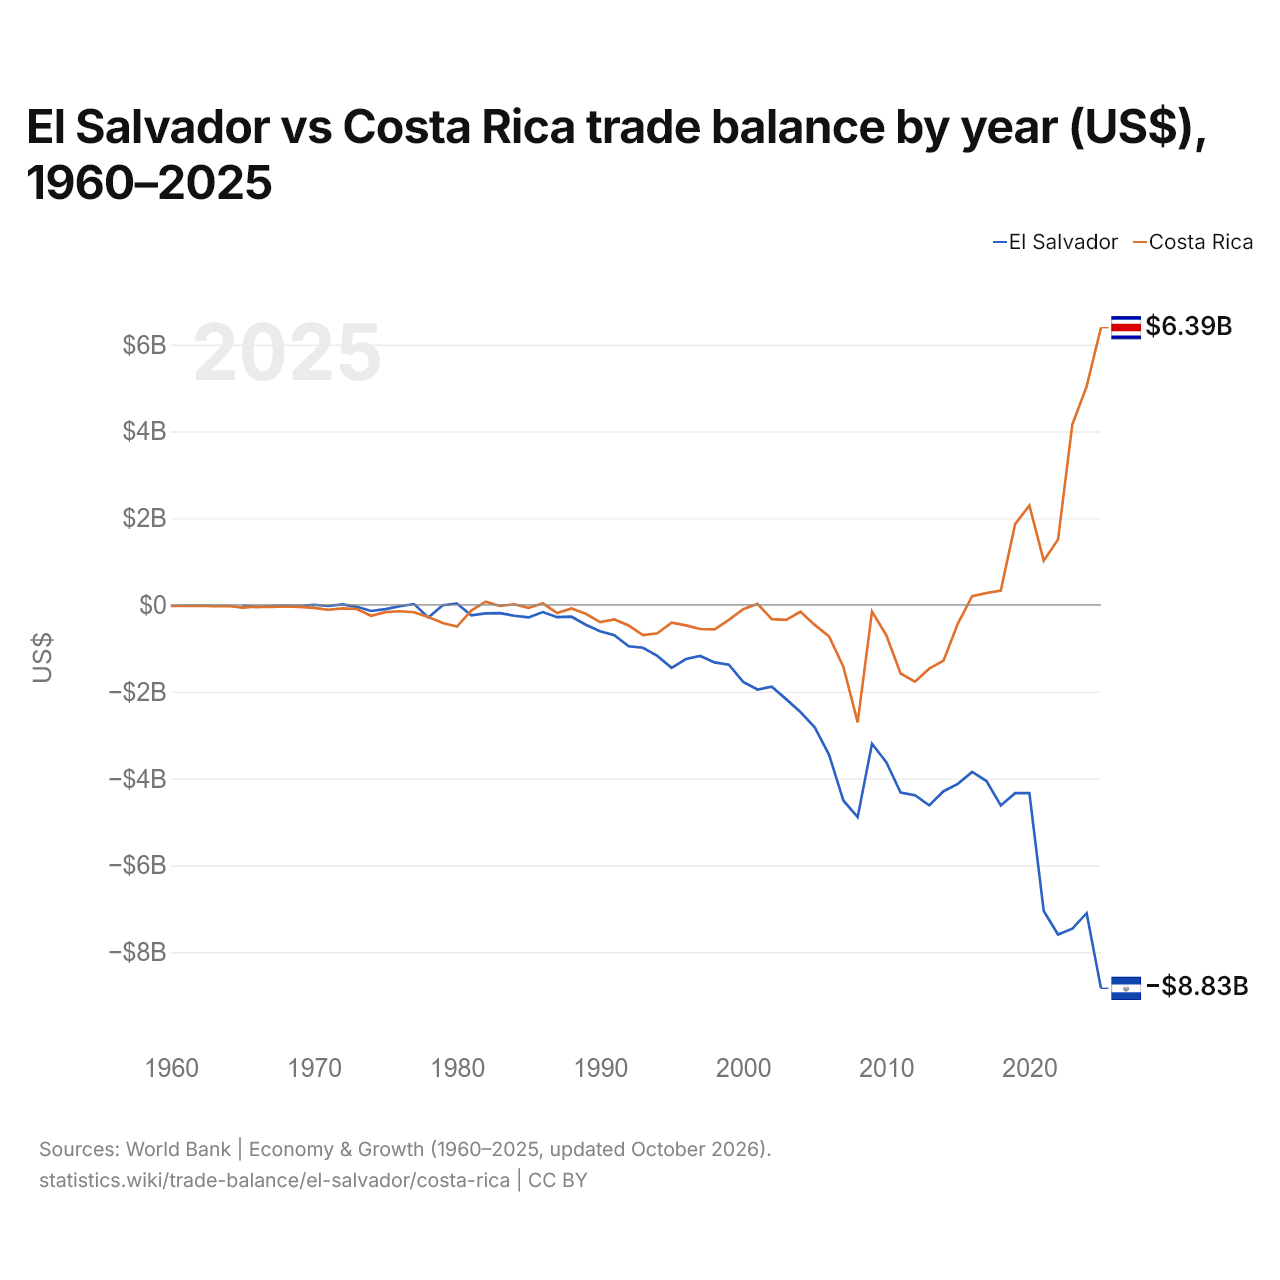
Salvador vs Costa Rica : balance commerciale par année ($ US), 1960–2025
| Année | $ US | |
|---|---|---|
 Salvador |
 Costa Rica |
|
| 2025 | −8 833 780 000 $ US | 6 388 241 982 $ US |
| 2024 | −7 102 510 000 $ US | 5 035 307 503 $ US |
| 2023 | −7 461 110 000 $ US | 4 159 883 783 $ US |
| 2022 | −7 595 970 000 $ US | 1 508 939 813 $ US |
| 2021 | −7 052 280 000 $ US | 1 020 579 727 $ US |
| 2020 | −4 337 760 000 $ US | 2 291 858 848 $ US |
| 2019 | −4 335 980 000 $ US | 1 861 743 506 $ US |
| 2018 | −4 622 570 000 $ US | 331 875 262 $ US |
| 2017 | −4 057 900 000 $ US | 274 387 327 $ US |
| 2016 | −3 846 900 000 $ US | 201 088 459 $ US |
| 2015 | −4 122 300 000 $ US | −430 226 387 $ US |
| 2014 | −4 292 460 000 $ US | −1 282 418 430 $ US |
| 2013 | −4 618 410 000 $ US | −1 468 936 015 $ US |
| 2012 | −4 385 540 000 $ US | −1 769 252 761 $ US |
| 2011 | −4 323 100 000 $ US | −1 579 738 366 $ US |
| 2010 | −3 623 900 000 $ US | −697 914 668 $ US |
| 2009 | −3 198 000 000 $ US | −152 101 398 $ US |
| 2008 | −4 889 700 000 $ US | −2 707 039 847 $ US |
| 2007 | −4 505 900 000 $ US | −1 422 824 731 $ US |
| 2006 | −3 452 170 000 $ US | −723 827 090 $ US |
| 2005 | −2 819 470 000 $ US | −459 655 981 $ US |
| 2004 | −2 466 327 000 $ US | −156 546 480 $ US |
| 2003 | −2 170 692 600 $ US | −342 720 363 $ US |
| 2002 | −1 886 066 700 $ US | −325 752 876 $ US |
| 2001 | −1 949 502 700 $ US | 26 262 657 $ US |
| 2000 | −1 774 285 500 $ US | −99 732 308 $ US |
| 1999 | −1 376 411 000 $ US | −345 378 745 $ US |
| 1998 | −1 323 240 700 $ US | −562 742 719 $ US |
| 1997 | −1 176 867 900 $ US | −554 419 175 $ US |
| 1996 | −1 246 211 200 $ US | −471 011 506 $ US |
| 1995 | −1 449 972 700 $ US | −407 096 810 $ US |
| 1994 | −1 175 191 700 $ US | −653 309 769 $ US |
| 1993 | −987 523 100 $ US | −696 116 962 $ US |
| 1992 | −953 944 800 $ US | −474 694 622 $ US |
| 1991 | −698 660 500 $ US | −333 904 177 $ US |
| 1990 | −608 053 458 $ US | −394 370 767 $ US |
| 1989 | −457 015 400 $ US | −203 773 887 $ US |
| 1988 | −271 267 100 $ US | −82 456 788 $ US |
| 1987 | −281 417 600 $ US | −187 400 032 $ US |
| 1986 | −165 115 800 $ US | 37 374 552 $ US |
| 1985 | −287 422 100 $ US | −68 700 990 $ US |
| 1984 | −248 349 900 $ US | 15 024 920 $ US |
| 1983 | −190 070 900 $ US | −23 463 184 $ US |
| 1982 | −193 513 600 $ US | 76 088 041 $ US |
| 1981 | −237 480 000 $ US | −128 771 636 $ US |
| 1980 | 32 760 000 $ US | −499 626 604 $ US |
| 1979 | −5 880 000 $ US | −414 469 078 $ US |
| 1978 | −289 760 100 $ US | −276 581 097 $ US |
| 1977 | 20 360 000 $ US | −167 934 656 $ US |
| 1976 | −29 640 000 $ US | −144 795 799 $ US |
| 1975 | −97 400 000 $ US | −166 394 399 $ US |
| 1974 | −140 160 000 $ US | −249 609 079 $ US |
| 1973 | −43 600 000 $ US | −92 857 300 $ US |
| 1972 | 12 240 000 $ US | −78 975 132 $ US |
| 1971 | −23 520 000 $ US | −111 065 280 $ US |
| 1970 | 3 240 000 $ US | −66 415 094 $ US |
| 1969 | −27 360 000 $ US | −45 720 755 $ US |
| 1968 | −17 720 000 $ US | −36 286 792 $ US |
| 1967 | −29 480 000 $ US | −44 332 075 $ US |
| 1966 | −47 560 000 $ US | −38 792 453 $ US |
| 1965 | −21 280 000 $ US | −63 003 774 $ US |
| 1964 | - | −22 510 940 $ US |
| 1963 | - | −25 804 123 $ US |
| 1962 | - | −15 939 610 $ US |
| 1961 | - | −20 571 792 $ US |
| 1960 | - | −24 821 248 $ US |
En 2025, la balance commerciale du Salvador affichait un déficit de 8,83 milliards de dollars et celle du Costa Rica un excédent de 6,39 milliards de dollars. En 1965, la balance commerciale du Salvador affichait un déficit de 21,3 millions de dollars et celle du Costa Rica un déficit de 63 millions de dollars.
De 1965 à 2025, la balance commerciale du Salvador a été excédentaire pendant 4 des 61 années, et celle du Costa Rica pendant 14. Les balances commerciales du Salvador et du Costa Rica ont été déficitaires en même temps pendant 43 de ces années, la dernière fois en 2015.
Salvador vs Costa Rica : chiffres de la balance commerciale
|
Salvador
|
Costa Rica
|
|
|---|---|---|
| Biens et services, $ US | −8,83 Md $US (2025) | +6,39 Md $US (2025) |
| % du PIB | −24,1 % (2025) | +6,2 % (2025) |
| Années d'excédent depuis 2000 | 0 sur 26 | 11 sur 26 |
| Solde des biens entre les deux, chiffres propres | −186 M $US (2025) | +247 M $US (2025) |
| Premier excédent en biens avec | Honduras (+348 M $US, 2025) | Pays-Bas (+1,97 Md $US, 2025) |
| Premier déficit en biens avec | Chine (−3,52 Md $US, 2025) | Chine (−4,18 Md $US, 2025) |
Comparer la balance commerciale de 2 pays au choix
Sources :
- Banque mondiale | Économie et croissance (1960–2025, mis à jour en octobre 2026)
- TradeMap (2001–2025, mis à jour en octobre 2026)
Creative Commons Attribution (CC BY) : vous pouvez copier, partager, adapter et réutiliser ce contenu, y compris à des fins commerciales, à condition de citer statistics.wiki et d’indiquer les modifications apportées. Les sources citées ci-dessus peuvent avoir leurs propres conditions de licence.