
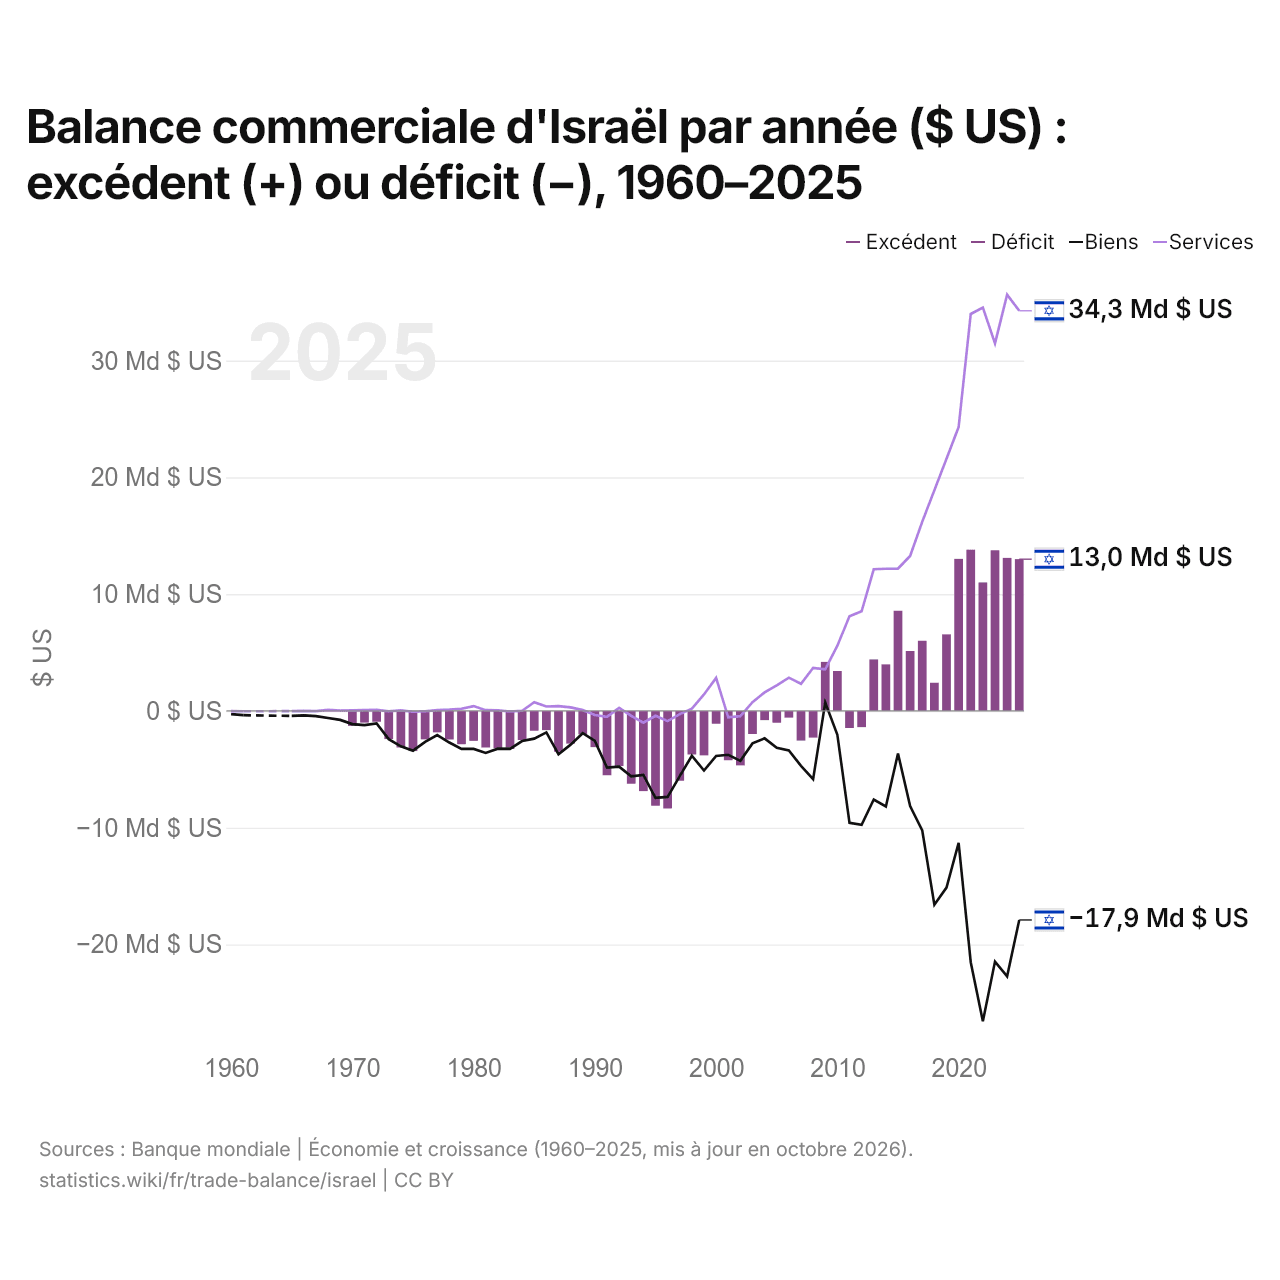
Balance commerciale d'Israël par année ($ US) : excédent (+) ou déficit (−), 1960–2025
| Année | $ US | ||
|---|---|---|---|
| Biens et services | Biens | Services | |
| 2025 | 12 994 365 505 $ US | −17 900 900 000 $ US | 34 261 500 000 $ US |
| 2024 | 13 100 279 099 $ US | −22 727 800 000 $ US | 35 641 000 000 $ US |
| 2023 | 13 754 663 733 $ US | −21 463 200 000 $ US | 31 466 900 000 $ US |
| 2022 | 11 000 808 302 $ US | −26 580 800 000 $ US | 34 541 200 000 $ US |
| 2021 | 13 804 496 055 $ US | −21 519 900 000 $ US | 33 990 200 000 $ US |
| 2020 | 13 021 165 408 $ US | −11 300 500 000 $ US | 24 300 800 000 $ US |
| 2019 | 6 557 503 906 $ US | −15 132 000 000 $ US | 21 599 100 000 $ US |
| 2018 | 2 413 018 727 $ US | −16 591 300 000 $ US | 18 902 600 000 $ US |
| 2017 | 6 004 796 901 $ US | −10 237 700 000 $ US | 16 196 300 000 $ US |
| 2016 | 5 128 475 225 $ US | −8 143 300 000 $ US | 13 264 900 000 $ US |
| 2015 | 8 575 319 326 $ US | −3 651 600 000 $ US | 12 188 600 000 $ US |
| 2014 | 3 984 226 053 $ US | −8 188 300 000 $ US | 12 169 300 000 $ US |
| 2013 | 4 406 103 796 $ US | −7 588 000 000 $ US | 12 127 100 000 $ US |
| 2012 | −1 392 248 402 $ US | −9 759 100 000 $ US | 8 525 000 000 $ US |
| 2011 | −1 462 187 515 $ US | −9 592 100 000 $ US | 8 104 100 000 $ US |
| 2010 | 3 412 251 219 $ US | −2 040 700 000 $ US | 5 578 900 000 $ US |
| 2009 | 4 198 677 110 $ US | 715 400 000 $ US | 3 565 100 000 $ US |
| 2008 | −2 287 048 495 $ US | −5 848 200 000 $ US | 3 678 300 000 $ US |
| 2007 | −2 539 773 861 $ US | −4 703 200 000 $ US | 2 321 800 000 $ US |
| 2006 | −575 153 283 $ US | −3 391 100 000 $ US | 2 847 600 000 $ US |
| 2005 | −1 009 500 635 $ US | −3 161 600 000 $ US | 2 180 100 000 $ US |
| 2004 | −793 186 301 $ US | −2 349 700 000 $ US | 1 580 400 000 $ US |
| 2003 | −1 975 804 879 $ US | −2 779 000 000 $ US | 749 800 000 $ US |
| 2002 | −4 669 753 894 $ US | −4 278 200 000 $ US | −451 600 000 $ US |
| 2001 | −4 222 578 168 $ US | −3 755 100 000 $ US | −554 100 000 $ US |
| 2000 | −1 098 518 628 $ US | −3 857 000 000 $ US | 2 831 300 000 $ US |
| 1999 | −3 810 722 999 $ US | −5 109 300 000 $ US | 1 405 700 000 $ US |
| 1998 | −3 730 624 984 $ US | −3 839 600 000 $ US | 185 600 000 $ US |
| 1997 | −5 975 502 116 $ US | −5 583 100 000 $ US | −275 000 000 $ US |
| 1996 | −8 351 877 056 $ US | −7 365 000 000 $ US | −875 200 000 $ US |
| 1995 | −8 115 948 262 $ US | −7 438 200 000 $ US | −418 400 000 $ US |
| 1994 | −6 867 235 894 $ US | −5 485 800 000 $ US | −1 011 000 000 $ US |
| 1993 | −6 232 770 220 $ US | −5 606 700 000 $ US | −430 600 000 $ US |
| 1992 | −4 720 523 362 $ US | −4 768 600 000 $ US | 266 700 000 $ US |
| 1991 | −5 509 077 267 $ US | −4 860 600 000 $ US | −507 200 000 $ US |
| 1990 | −3 103 552 723 $ US | −2 563 500 000 $ US | −352 500 000 $ US |
| 1989 | −2 010 870 382 $ US | −1 904 800 000 $ US | 71 900 000 $ US |
| 1988 | −2 800 375 258 $ US | −2 890 200 000 $ US | 297 100 000 $ US |
| 1987 | −3 498 185 125 $ US | −3 706 800 000 $ US | 408 100 000 $ US |
| 1986 | −1 649 481 113 $ US | −1 840 600 000 $ US | 380 600 000 $ US |
| 1985 | −1 698 280 601 $ US | −2 376 200 000 $ US | 747 700 000 $ US |
| 1984 | −2 488 666 439 $ US | −2 578 600 000 $ US | 11 600 000 $ US |
| 1983 | −3 259 483 986 $ US | −3 249 700 000 $ US | −48 400 000 $ US |
| 1982 | −3 188 683 128 $ US | −3 236 700 000 $ US | 56 500 000 $ US |
| 1981 | −3 131 228 070 $ US | −3 599 200 000 $ US | 60 900 000 $ US |
| 1980 | −2 559 607 843 $ US | −3 255 000 000 $ US | 412 000 000 $ US |
| 1979 | −2 851 200 000 $ US | −3 247 000 000 $ US | 185 000 000 $ US |
| 1978 | −2 447 647 059 $ US | −2 710 000 000 $ US | 103 000 000 $ US |
| 1977 | −1 834 000 000 $ US | −2 062 000 000 $ US | 68 000 000 $ US |
| 1976 | −2 433 750 000 $ US | −2 657 000 000 $ US | −27 000 000 $ US |
| 1975 | −3 438 333 333 $ US | −3 408 000 000 $ US | −72 000 000 $ US |
| 1974 | −3 132 500 000 $ US | −3 031 000 000 $ US | 48 000 000 $ US |
| 1973 | −2 412 500 000 $ US | −2 416 000 000 $ US | −32 000 000 $ US |
| 1972 | −925 000 000 $ US | −1 080 000 000 $ US | 93 000 000 $ US |
| 1971 | −1 000 000 000 $ US | −1 212 000 000 $ US | 70 000 000 $ US |
| 1970 | −1 283 333 333 $ US | −1 130 000 000 $ US | 43 000 000 $ US |
| 1969 | - | −770 000 000 $ US | 32 000 000 $ US |
| 1968 | - | −608 000 000 $ US | 83 000 000 $ US |
| 1967 | - | −442 000 000 $ US | −23 000 000 $ US |
| 1966 | - | −385 000 000 $ US | −4 000 000 $ US |
| 1965 | - | −432 000 000 $ US | −24 000 000 $ US |
| 1964 | - | - | - |
| 1963 | - | - | - |
| 1962 | - | - | - |
| 1961 | - | −366 000 000 $ US | −30 000 000 $ US |
| 1960 | - | −280 000 000 $ US | −25 000 000 $ US |
En 2025, la balance commerciale d'Israël affichait un excédent de 13 milliards de dollars, contre un déficit de 1,28 milliard de dollars en 1970. Le plus grand déficit a été de 8,35 milliards de dollars, en 1996, et le plus grand excédent de 13,8 milliards de dollars, en 2021. La balance commerciale d'Israël est excédentaire chaque année depuis 2013.
En 2025, le solde commercial d'Israël était le 14e plus élevé de 44 pays situés en Asie, où les soldes allaient d'un déficit de 68,9 milliards de dollars en Inde à un excédent de 816 milliards de dollars en Chine. De 2016 à 2025, les soldes commerciaux d'Israël ont totalisé un excédent de 97,8 milliards de dollars, contre un excédent de 16,3 milliards de dollars de 2006 à 2015. En 2025, les transactions courantes d'Israël affichaient un excédent de 2,0 % du PIB.
Commerce de biens d'Israël avec ses 10 principaux partenaires commerciaux, selon Israël, 2025
| Pays | Exportations vers | Importations depuis | Solde | |
|---|---|---|---|---|
 États-Unis |
16,1 Md $US | 9,99 Md $US | +6,12 Md $US | vs USA |
 Chine |
2,79 Md $US | 20,8 Md $US | −18,0 Md $US | vs Chine |
 Allemagne |
3,03 Md $US | 5,92 Md $US | −2,88 Md $US | vs Allemagne |
 Italie |
1,29 Md $US | 4,05 Md $US | −2,76 Md $US | vs Italie |
 Inde |
2,47 Md $US | 2,20 Md $US | +269 M $US | vs Inde |
 Pays-Bas |
2,64 Md $US | 1,56 Md $US | +1,08 Md $US | vs Pays-Bas |
 France |
1,41 Md $US | 2,43 Md $US | −1,01 Md $US | vs France |
 Royaume-Uni |
1,52 Md $US | 2,12 Md $US | −597 M $US | vs R.-U. |
 Corée du Sud |
1,12 Md $US | 2,52 Md $US | −1,40 Md $US | vs Corée du Sud |
 Espagne |
1,00 Md $US | 1,91 Md $US | −908 M $US | vs Espagne |
Balance commerciale d'Israël : excédent (+) ou déficit (−)
| Biens et services, $ US, 2025 | +13,0 Md $US |
|---|---|
| % du PIB, 2025 | +2,1 % |
| Années d'excédent, 2000–2025 | 15 |
| Biens, $ US, 2025 | −17,9 Md $US |
| Services, $ US, 2025 | +34,3 Md $US |
| Premier excédent en biens, 2025 | États-Unis +6,12 Md $US |
| Premier déficit en biens, 2025 | Chine −18,0 Md $US |
Comparer la balance commerciale d'Israël avec celle d'autres pays
Sources :
- TradeMap (2025, mis à jour en octobre 2026)
- Banque mondiale | Économie et croissance (1960–2025, mis à jour en octobre 2026)
Creative Commons Attribution (CC BY) : vous pouvez copier, partager, adapter et réutiliser ce contenu, y compris à des fins commerciales, à condition de citer statistics.wiki et d’indiquer les modifications apportées. Les sources citées ci-dessus peuvent avoir leurs propres conditions de licence.