
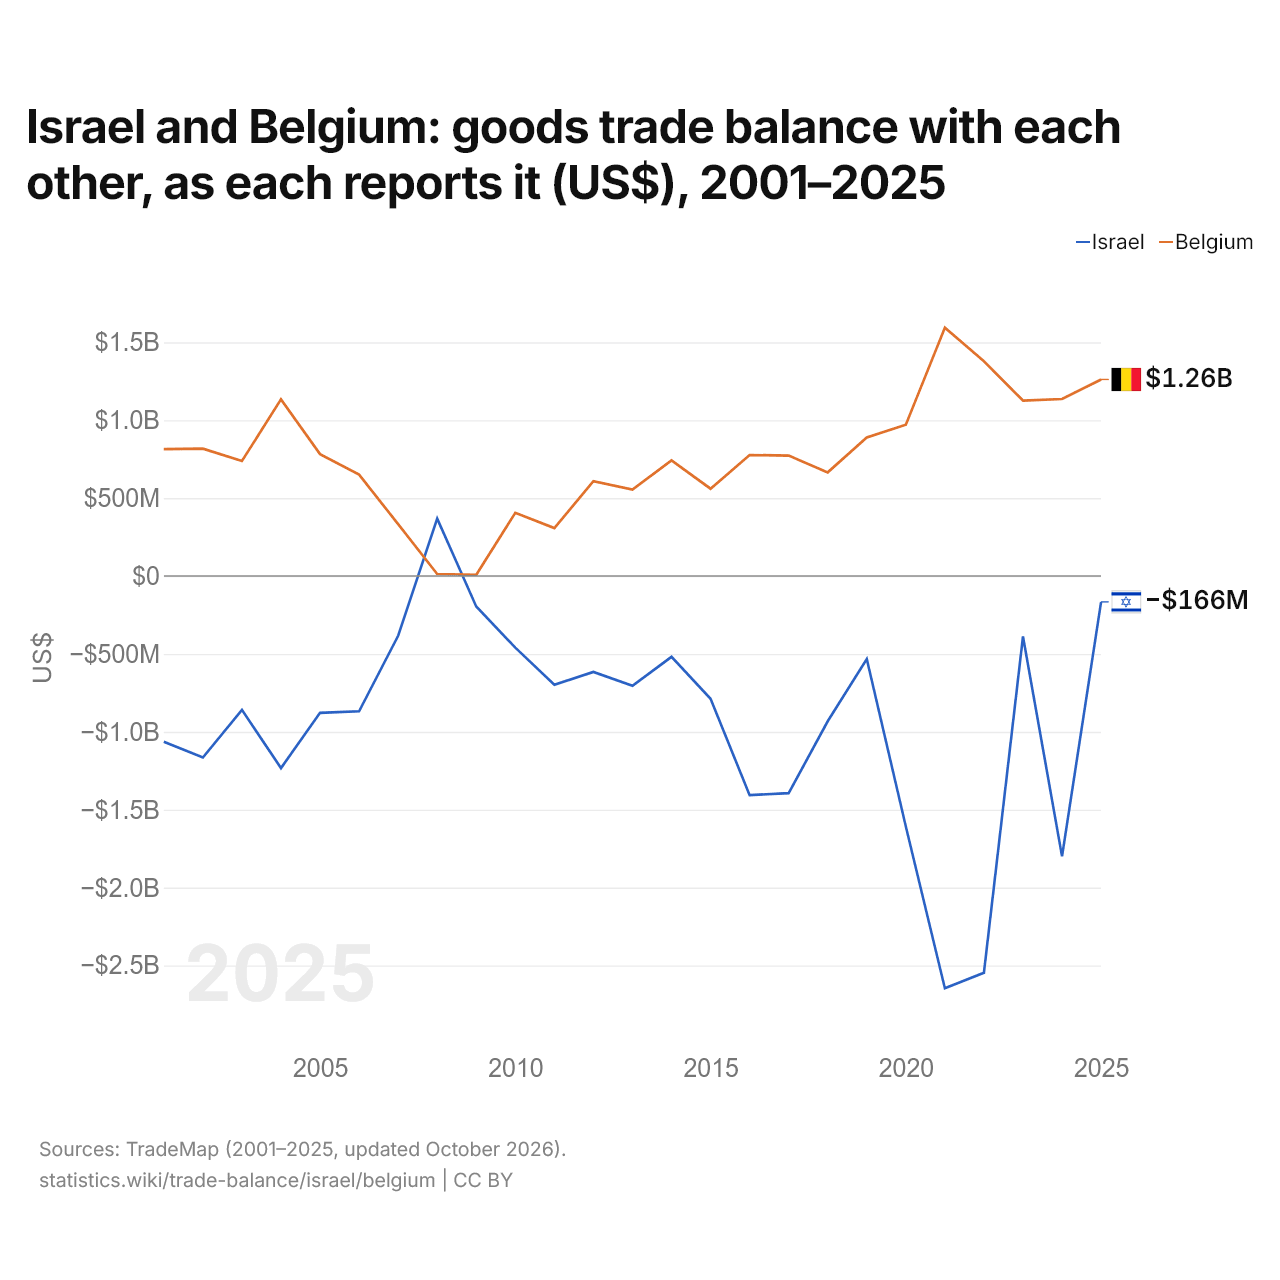
Israël et la Belgique : solde de leur commerce de biens bilatéral, selon chacun ($ US), 2001–2025
| Année | $ US | |
|---|---|---|
| Israël | Belgique | |
| 2025 | −165 954 000 $ US | 1 261 655 000 $ US |
| 2024 | −1 799 631 000 $ US | 1 135 978 000 $ US |
| 2023 | −387 855 000 $ US | 1 126 031 000 $ US |
| 2022 | −2 546 169 000 $ US | 1 377 843 000 $ US |
| 2021 | −2 646 399 000 $ US | 1 593 805 000 $ US |
| 2020 | −1 607 752 000 $ US | 970 684 000 $ US |
| 2019 | −532 902 000 $ US | 889 860 000 $ US |
| 2018 | −932 433 000 $ US | 665 207 000 $ US |
| 2017 | −1 393 959 000 $ US | 773 083 000 $ US |
| 2016 | −1 406 653 000 $ US | 776 548 000 $ US |
| 2015 | −787 688 000 $ US | 560 329 000 $ US |
| 2014 | −518 830 000 $ US | 741 651 000 $ US |
| 2013 | −705 267 000 $ US | 555 071 000 $ US |
| 2012 | −615 897 000 $ US | 608 247 000 $ US |
| 2011 | −697 660 000 $ US | 307 355 000 $ US |
| 2010 | −459 615 000 $ US | 405 826 000 $ US |
| 2009 | −195 949 000 $ US | 7 766 000 $ US |
| 2008 | 368 254 000 $ US | 12 786 000 $ US |
| 2007 | −383 804 000 $ US | 332 613 000 $ US |
| 2006 | −868 521 000 $ US | 650 853 000 $ US |
| 2005 | −878 079 000 $ US | 782 063 000 $ US |
| 2004 | −1 232 971 000 $ US | 1 133 667 000 $ US |
| 2003 | −858 924 000 $ US | 737 967 000 $ US |
| 2002 | −1 165 145 000 $ US | 817 664 000 $ US |
| 2001 | −1 064 210 000 $ US | 814 838 000 $ US |
En 2025, selon Israël, son commerce de biens avec la Belgique affichait un déficit de 166 millions de dollars ; selon la Belgique, son commerce de biens avec Israël affichait un excédent de 1,26 milliard de dollars. En 2001, les chiffres étaient un déficit de 1,06 milliard de dollars pour Israël et un excédent de 815 millions de dollars pour la Belgique.
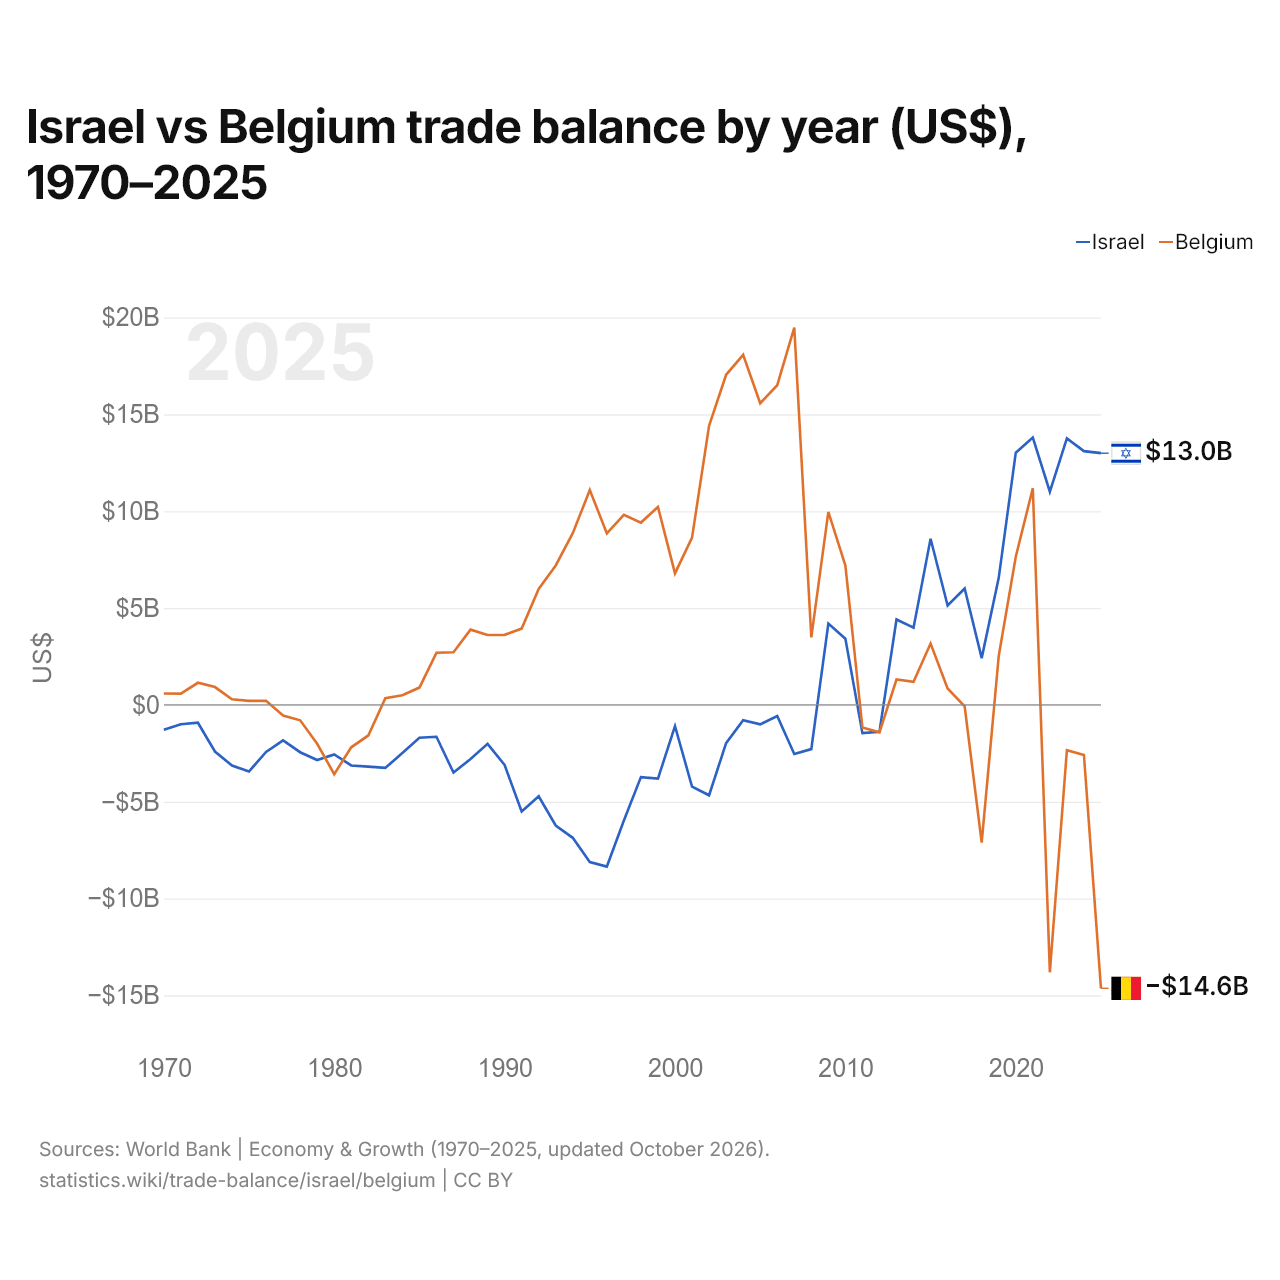
Israël vs Belgique : balance commerciale par année ($ US), 1970–2025
| Année | $ US | |
|---|---|---|
 Israël |
 Belgique |
|
| 2025 | 12 994 365 505 $ US | −14 637 349 567 $ US |
| 2024 | 13 100 279 099 $ US | −2 589 378 795 $ US |
| 2023 | 13 754 663 733 $ US | −2 348 299 205 $ US |
| 2022 | 11 000 808 302 $ US | −13 809 679 840 $ US |
| 2021 | 13 804 496 055 $ US | 11 185 411 660 $ US |
| 2020 | 13 021 165 408 $ US | 7 646 774 510 $ US |
| 2019 | 6 557 503 906 $ US | 2 519 265 437 $ US |
| 2018 | 2 413 018 727 $ US | −7 117 140 449 $ US |
| 2017 | 6 004 796 901 $ US | −76 479 416 $ US |
| 2016 | 5 128 475 225 $ US | 846 891 572 $ US |
| 2015 | 8 575 319 326 $ US | 3 166 438 839 $ US |
| 2014 | 3 984 226 053 $ US | 1 191 266 653 $ US |
| 2013 | 4 406 103 796 $ US | 1 306 071 280 $ US |
| 2012 | −1 392 248 402 $ US | −1 422 261 060 $ US |
| 2011 | −1 462 187 515 $ US | −1 174 531 842 $ US |
| 2010 | 3 412 251 219 $ US | 7 194 531 778 $ US |
| 2009 | 4 198 677 110 $ US | 9 960 978 144 $ US |
| 2008 | −2 287 048 495 $ US | 3 480 542 817 $ US |
| 2007 | −2 539 773 861 $ US | 19 473 396 555 $ US |
| 2006 | −575 153 283 $ US | 16 503 842 056 $ US |
| 2005 | −1 009 500 635 $ US | 15 569 789 759 $ US |
| 2004 | −793 186 301 $ US | 18 069 920 173 $ US |
| 2003 | −1 975 804 879 $ US | 17 041 157 540 $ US |
| 2002 | −4 669 753 894 $ US | 14 411 205 478 $ US |
| 2001 | −4 222 578 168 $ US | 8 634 316 460 $ US |
| 2000 | −1 098 518 628 $ US | 6 783 287 644 $ US |
| 1999 | −3 810 722 999 $ US | 10 216 533 029 $ US |
| 1998 | −3 730 624 984 $ US | 9 409 313 181 $ US |
| 1997 | −5 975 502 116 $ US | 9 815 741 994 $ US |
| 1996 | −8 351 877 056 $ US | 8 856 286 645 $ US |
| 1995 | −8 115 948 262 $ US | 11 089 490 969 $ US |
| 1994 | −6 867 235 894 $ US | 8 858 973 957 $ US |
| 1993 | −6 232 770 220 $ US | 7 197 266 791 $ US |
| 1992 | −4 720 523 362 $ US | 5 983 582 183 $ US |
| 1991 | −5 509 077 267 $ US | 3 934 812 758 $ US |
| 1990 | −3 103 552 723 $ US | 3 612 875 423 $ US |
| 1989 | −2 010 870 382 $ US | 3 607 222 563 $ US |
| 1988 | −2 800 375 258 $ US | 3 884 174 438 $ US |
| 1987 | −3 498 185 125 $ US | 2 713 639 114 $ US |
| 1986 | −1 649 481 113 $ US | 2 687 310 818 $ US |
| 1985 | −1 698 280 601 $ US | 890 002 718 $ US |
| 1984 | −2 488 666 439 $ US | 495 069 813 $ US |
| 1983 | −3 259 483 986 $ US | 344 979 882 $ US |
| 1982 | −3 188 683 128 $ US | −1 582 876 567 $ US |
| 1981 | −3 131 228 070 $ US | −2 193 369 187 $ US |
| 1980 | −2 559 607 843 $ US | −3 577 711 408 $ US |
| 1979 | −2 851 200 000 $ US | −2 010 039 901 $ US |
| 1978 | −2 447 647 059 $ US | −799 154 605 $ US |
| 1977 | −1 834 000 000 $ US | −549 247 046 $ US |
| 1976 | −2 433 750 000 $ US | 208 368 861 $ US |
| 1975 | −3 438 333 333 $ US | 202 501 919 $ US |
| 1974 | −3 132 500 000 $ US | 288 928 128 $ US |
| 1973 | −2 412 500 000 $ US | 916 582 488 $ US |
| 1972 | −925 000 000 $ US | 1 138 651 819 $ US |
| 1971 | −1 000 000 000 $ US | 581 774 525 $ US |
| 1970 | −1 283 333 333 $ US | 583 597 418 $ US |
En 2025, la balance commerciale d'Israël affichait un excédent de 13 milliards de dollars et celle de la Belgique un déficit de 14,6 milliards de dollars. En 1970, la balance commerciale d'Israël affichait un déficit de 1,28 milliard de dollars et celle de la Belgique un excédent de 584 millions de dollars.
De 1970 à 2025, la balance commerciale d'Israël a été excédentaire pendant 15 des 56 années, et celle de la Belgique pendant 42. Les balances commerciales d'Israël et de la Belgique ont été déficitaires en même temps pendant 8 de ces années, la dernière fois en 2012.
Israël vs Belgique : chiffres de la balance commerciale
|
Israël
|
Belgique
|
|
|---|---|---|
| Biens et services, $ US | +13,0 Md $US (2025) | −14,6 Md $US (2025) |
| % du PIB | +2,1 % (2025) | −2,0 % (2025) |
| Années d'excédent depuis 2000 | 15 sur 26 | 18 sur 26 |
| Solde des biens entre les deux, chiffres propres | −166 M $US (2025) | +1,26 Md $US (2025) |
| Premier excédent en biens avec | États-Unis (+6,12 Md $US, 2025) | Allemagne (+42,1 Md $US, 2025) |
| Premier déficit en biens avec | Chine (−18,0 Md $US, 2025) | Pays-Bas (−33,2 Md $US, 2025) |
Comparer la balance commerciale de 2 pays au choix
Sources :
- Banque mondiale | Économie et croissance (1970–2025, mis à jour en octobre 2026)
- TradeMap (2001–2025, mis à jour en octobre 2026)
Creative Commons Attribution (CC BY) : vous pouvez copier, partager, adapter et réutiliser ce contenu, y compris à des fins commerciales, à condition de citer statistics.wiki et d’indiquer les modifications apportées. Les sources citées ci-dessus peuvent avoir leurs propres conditions de licence.