
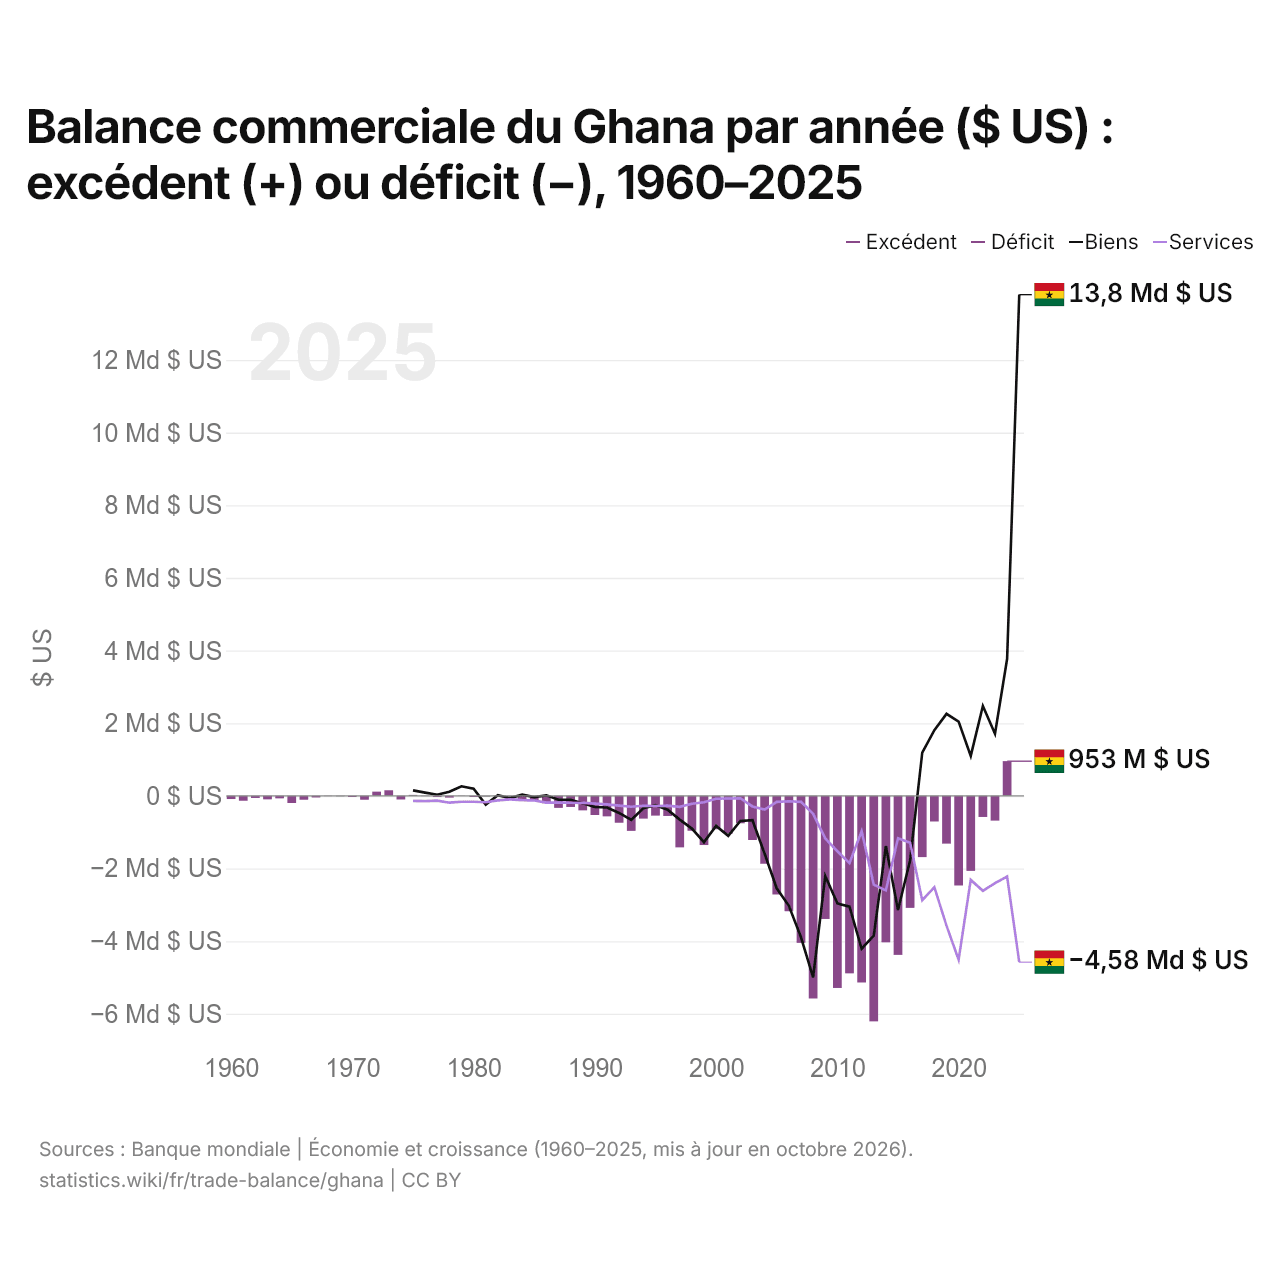
Balance commerciale du Ghana par année ($ US) : excédent (+) ou déficit (−), 1960–2025
| Année | $ US | ||
|---|---|---|---|
| Biens et services | Biens | Services | |
| 2025 | - | 13 795 881 149 $ US | −4 579 273 067 $ US |
| 2024 | 953 399 973 $ US | 3 773 259 263 $ US | −2 224 537 879 $ US |
| 2023 | −681 612 946 $ US | 1 707 311 813 $ US | −2 404 949 004 $ US |
| 2022 | −582 015 087 $ US | 2 474 468 535 $ US | −2 616 208 775 $ US |
| 2021 | −2 065 454 600 $ US | 1 098 797 425 $ US | −2 314 341 962 $ US |
| 2020 | −2 467 550 988 $ US | 2 042 966 219 $ US | −4 511 264 068 $ US |
| 2019 | −1 316 200 284 $ US | 2 256 825 173 $ US | −3 572 745 360 $ US |
| 2018 | −705 366 714 $ US | 1 808 644 838 $ US | −2 514 446 668 $ US |
| 2017 | −1 687 540 151 $ US | 1 187 080 000 $ US | −2 873 010 000 $ US |
| 2016 | −3 082 608 043 $ US | −1 773 326 761 $ US | −1 293 279 525 $ US |
| 2015 | −4 379 043 716 $ US | −3 143 866 544 $ US | −1 166 597 086 $ US |
| 2014 | −4 031 316 042 $ US | −1 383 251 077 $ US | −2 602 387 886 $ US |
| 2013 | −6 207 746 512 $ US | −3 848 317 612 $ US | −2 443 763 056 $ US |
| 2012 | −5 138 161 192 $ US | −4 210 816 027 $ US | −976 259 356 $ US |
| 2011 | −4 886 494 040 $ US | −3 052 326 680 $ US | −1 856 316 039 $ US |
| 2010 | −5 288 265 245 $ US | −2 962 020 000 $ US | −1 525 930 000 $ US |
| 2009 | −3 389 200 672 $ US | −2 206 560 000 $ US | −1 173 410 000 $ US |
| 2008 | −5 579 663 206 $ US | −4 998 768 803 $ US | −497 165 396 $ US |
| 2007 | −4 047 884 399 $ US | −3 893 975 747 $ US | −166 725 108 $ US |
| 2006 | −3 175 919 428 $ US | −3 027 000 496 $ US | −149 972 486 $ US |
| 2005 | −2 715 483 386 $ US | −2 545 113 868 $ US | −166 601 653 $ US |
| 2004 | −1 870 753 812 $ US | −1 592 811 402 $ US | −379 476 887 $ US |
| 2003 | −1 215 821 146 $ US | −670 263 125 $ US | −291 979 272 $ US |
| 2002 | −755 774 800 $ US | −691 828 996 $ US | −66 012 459 $ US |
| 2001 | −1 040 642 603 $ US | −1 101 397 845 $ US | −74 360 037 $ US |
| 2000 | −919 032 737 $ US | −830 233 759 $ US | −79 390 452 $ US |
| 1999 | −1 354 406 829 $ US | −1 274 400 000 $ US | −178 200 000 $ US |
| 1998 | −961 957 641 $ US | −900 800 000 $ US | −218 530 000 $ US |
| 1997 | −1 418 345 573 $ US | −653 860 000 $ US | −303 804 000 $ US |
| 1996 | −553 292 937 $ US | −380 650 000 $ US | −268 000 000 $ US |
| 1995 | −544 960 555 $ US | −256 600 000 $ US | −281 100 000 $ US |
| 1994 | −626 545 496 $ US | −342 200 000 $ US | −273 300 000 $ US |
| 1993 | −964 654 468 $ US | −664 400 000 $ US | −300 600 000 $ US |
| 1992 | −740 526 497 $ US | −470 200 000 $ US | −270 900 000 $ US |
| 1991 | −565 315 671 $ US | −321 000 000 $ US | −233 552 000 $ US |
| 1990 | −528 394 040 $ US | −308 200 000 $ US | −214 100 000 $ US |
| 1989 | −399 173 615 $ US | −203 400 000 $ US | −195 000 000 $ US |
| 1988 | −305 562 698 $ US | −112 400 000 $ US | −191 300 000 $ US |
| 1987 | −331 027 211 $ US | −107 100 000 $ US | −188 200 000 $ US |
| 1986 | −204 161 059 $ US | 14 200 000 $ US | −185 920 000 $ US |
| 1985 | −132 195 378 $ US | −36 300 000 $ US | −129 700 000 $ US |
| 1984 | −120 303 327 $ US | 32 900 000 $ US | −119 200 000 $ US |
| 1983 | −17 570 547 $ US | −60 600 000 $ US | −96 500 000 $ US |
| 1982 | 14 379 085 $ US | 18 300 000 $ US | −124 308 912 $ US |
| 1981 | −23 953 488 $ US | −243 600 000 $ US | −176 200 000 $ US |
| 1980 | −30 601 660 $ US | 195 300 000 $ US | −163 200 000 $ US |
| 1979 | 2 849 003 $ US | 262 600 000 $ US | −163 936 668 $ US |
| 1978 | −48 691 099 $ US | 112 499 025 $ US | −189 331 777 $ US |
| 1977 | −33 428 571 $ US | 29 391 439 $ US | −132 783 217 $ US |
| 1976 | −9 322 034 $ US | 88 783 097 $ US | −147 826 900 $ US |
| 1975 | 26 063 830 $ US | 150 435 610 $ US | −141 044 254 $ US |
| 1974 | −100 621 118 $ US | - | - |
| 1973 | 152 013 058 $ US | - | - |
| 1972 | 116 307 445 $ US | - | - |
| 1971 | −108 286 464 $ US | - | - |
| 1970 | −30 396 585 $ US | - | - |
| 1969 | −11 766 420 $ US | - | - |
| 1968 | −7 844 280 $ US | - | - |
| 1967 | −44 144 369 $ US | - | - |
| 1966 | −106 455 106 $ US | - | - |
| 1965 | −197 502 236 $ US | - | - |
| 1964 | −68 635 529 $ US | - | - |
| 1963 | −96 650 031 $ US | - | - |
| 1962 | −58 830 453 $ US | - | - |
| 1961 | −134 469 608 $ US | - | - |
| 1960 | −88 245 680 $ US | - | - |
La balance commerciale du Ghana affiche un excédent de 953 millions de dollars (2024), contre un déficit de 88,2 millions de dollars en 1960. Le plus grand déficit a été de 6,21 milliards de dollars, en 2013. En 2025, le commerce de biens affichait un excédent de 13,8 milliards de dollars et celui de services un déficit de 4,58 milliards de dollars.
Le solde commercial du Ghana est le 10e plus élevé de 50 pays situés en Afrique, où les soldes vont d'un déficit de 42,7 milliards de dollars en Égypte en 2025 à un excédent de 13,8 milliards de dollars en Angola en 2025. Sur les dix années à partir de 2015, les soldes commerciaux du Ghana ont totalisé un déficit de 16 milliards de dollars, contre un déficit de 44,5 milliards de dollars de 2005 à 2014. En 2025, les transactions courantes du Ghana affichaient un excédent de 8,2 % du PIB.
Commerce de biens du Ghana avec ses 10 principaux partenaires commerciaux, selon le Ghana, 2025
| Pays | Exportations vers | Importations depuis | Solde | |
|---|---|---|---|---|
 EAU |
8,28 Md $US | 1,22 Md $US | +7,07 Md $US | |
 Inde |
5,12 Md $US | 1,38 Md $US | +3,74 Md $US | |
 Chine |
1,56 Md $US | 4,59 Md $US | −3,03 Md $US | vs Chine |
 Suisse |
4,53 Md $US | 340 M $US | +4,19 Md $US | vs Suisse |
 Afrique du Sud |
3,29 Md $US | 328 M $US | +2,96 Md $US | vs Afrique du Sud |
 États-Unis |
1,04 Md $US | 1,42 Md $US | −375 M $US | |
 Pays-Bas |
1,44 Md $US | 908 M $US | +533 M $US | |
 Belgique |
412 M $US | 1,01 Md $US | −597 M $US | vs Belgique |
 Nigeria |
225 M $US | 906 M $US | −682 M $US | |
 Burkina Faso |
941 M $US | 107 M $US | +834 M $US | vs Burkina Faso |
Balance commerciale du Ghana : excédent (+) ou déficit (−)
| Biens et services, $ US, 2024 | +953 M $US |
|---|---|
| % du PIB, 2024 | +1,1 % |
| Années d'excédent, 2000–2024 | 1 |
| Biens, $ US, 2025 | +13,8 Md $US |
| Services, $ US, 2025 | −4,58 Md $US |
| Premier excédent en biens, 2025 | Émirats arabes unis +7,07 Md $US |
| Premier déficit en biens, 2025 | Chine −3,03 Md $US |
Comparer la balance commerciale du Ghana avec celle d'autres pays
Sources :
- TradeMap (2025, mis à jour en octobre 2026)
- Banque mondiale | Économie et croissance (1960–2025, mis à jour en octobre 2026)
Creative Commons Attribution (CC BY) : vous pouvez copier, partager, adapter et réutiliser ce contenu, y compris à des fins commerciales, à condition de citer statistics.wiki et d’indiquer les modifications apportées. Les sources citées ci-dessus peuvent avoir leurs propres conditions de licence.