
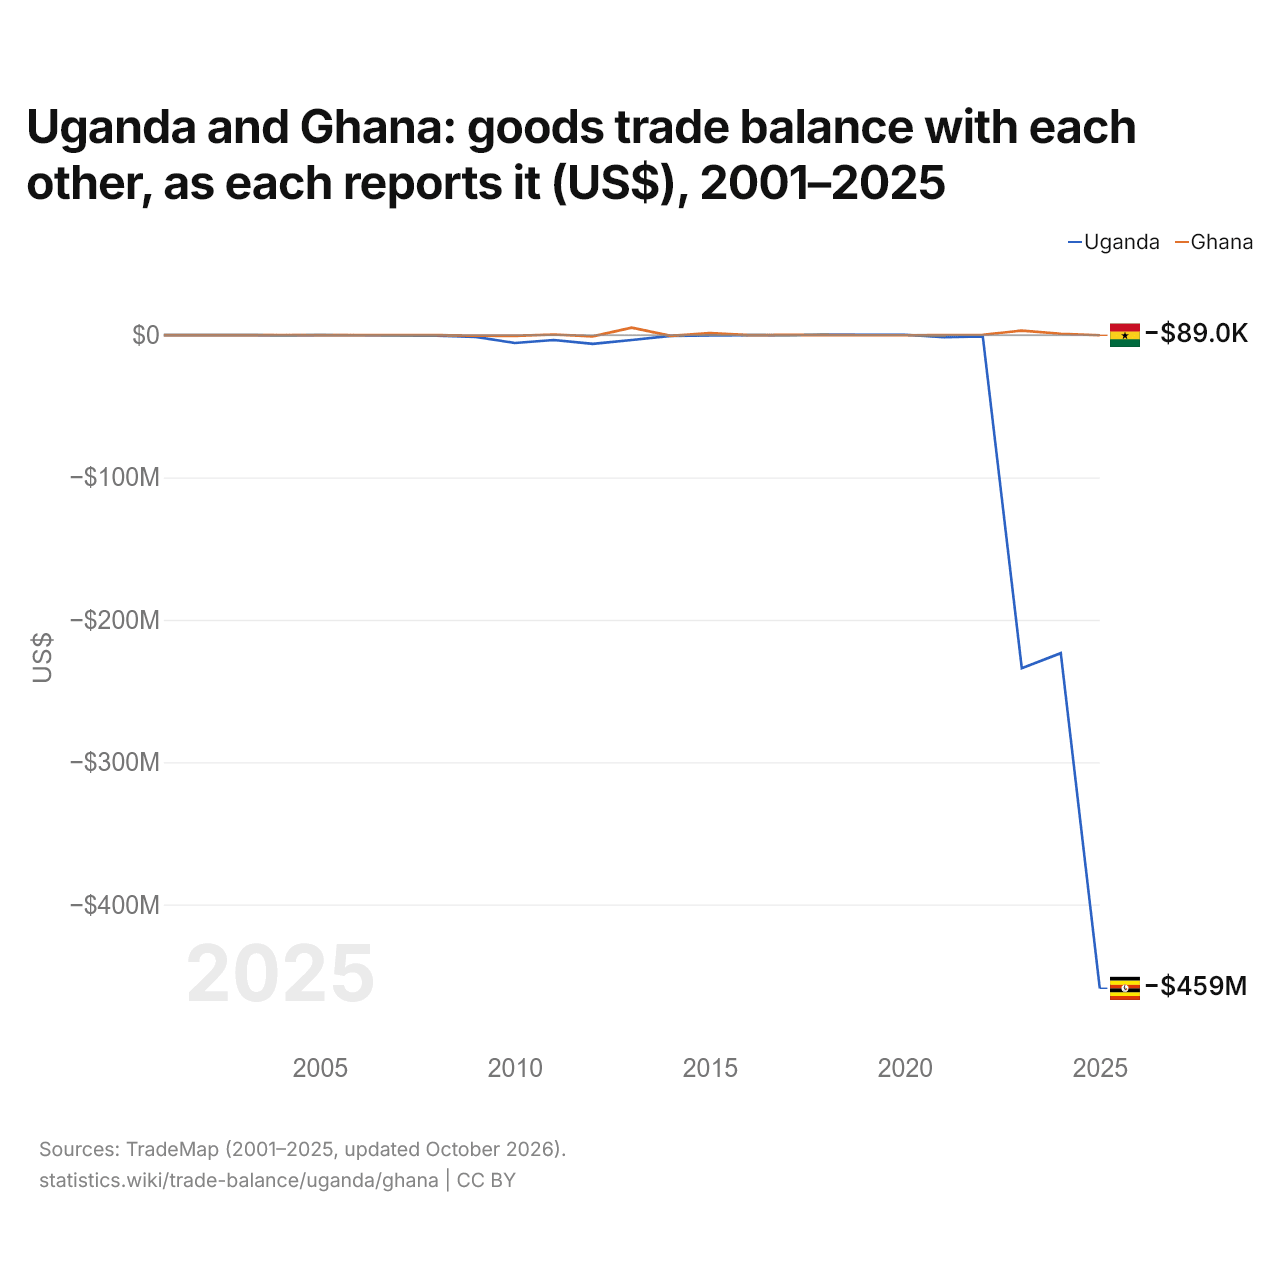
L'Ouganda et le Ghana : solde de leur commerce de biens bilatéral, selon chacun ($ US), 2001–2025
| Année | $ US | |
|---|---|---|
| Ouganda | Ghana | |
| 2025 | −458 859 000 $ US | −89 000 $ US |
| 2024 | −223 439 000 $ US | 964 000 $ US |
| 2023 | −233 995 000 $ US | 3 212 000 $ US |
| 2022 | −801 000 $ US | 312 000 $ US |
| 2021 | −1 354 000 $ US | 86 000 $ US |
| 2020 | 261 000 $ US | −90 000 $ US |
| 2019 | 309 000 $ US | −90 000 $ US |
| 2018 | 448 000 $ US | 71 000 $ US |
| 2017 | −38 000 $ US | 167 000 $ US |
| 2016 | −1 000 $ US | −4 000 $ US |
| 2015 | −178 000 $ US | 1 495 000 $ US |
| 2014 | −559 000 $ US | −490 000 $ US |
| 2013 | −3 391 000 $ US | 5 242 000 $ US |
| 2012 | −6 102 000 $ US | −806 000 $ US |
| 2011 | −3 427 000 $ US | 491 000 $ US |
| 2010 | −5 495 000 $ US | −528 000 $ US |
| 2009 | −1 242 000 $ US | −410 000 $ US |
| 2008 | −323 000 $ US | 41 000 $ US |
| 2007 | −222 000 $ US | 84 000 $ US |
| 2006 | −81 000 $ US | 3 000 $ US |
| 2005 | 10 000 $ US | 6 000 $ US |
| 2004 | −106 000 $ US | 126 000 $ US |
| 2003 | 113 000 $ US | −8 000 $ US |
| 2002 | −31 000 $ US | 38 000 $ US |
| 2001 | −7 000 $ US | 38 000 $ US |
En 2025, selon l'Ouganda, son commerce de biens avec le Ghana affichait un déficit de 459 millions de dollars ; selon le Ghana, son commerce de biens avec l'Ouganda affichait un déficit de 89 000 dollars. En 2001, les chiffres étaient un déficit de 7 000 dollars pour l'Ouganda et un excédent de 38 000 dollars pour le Ghana.
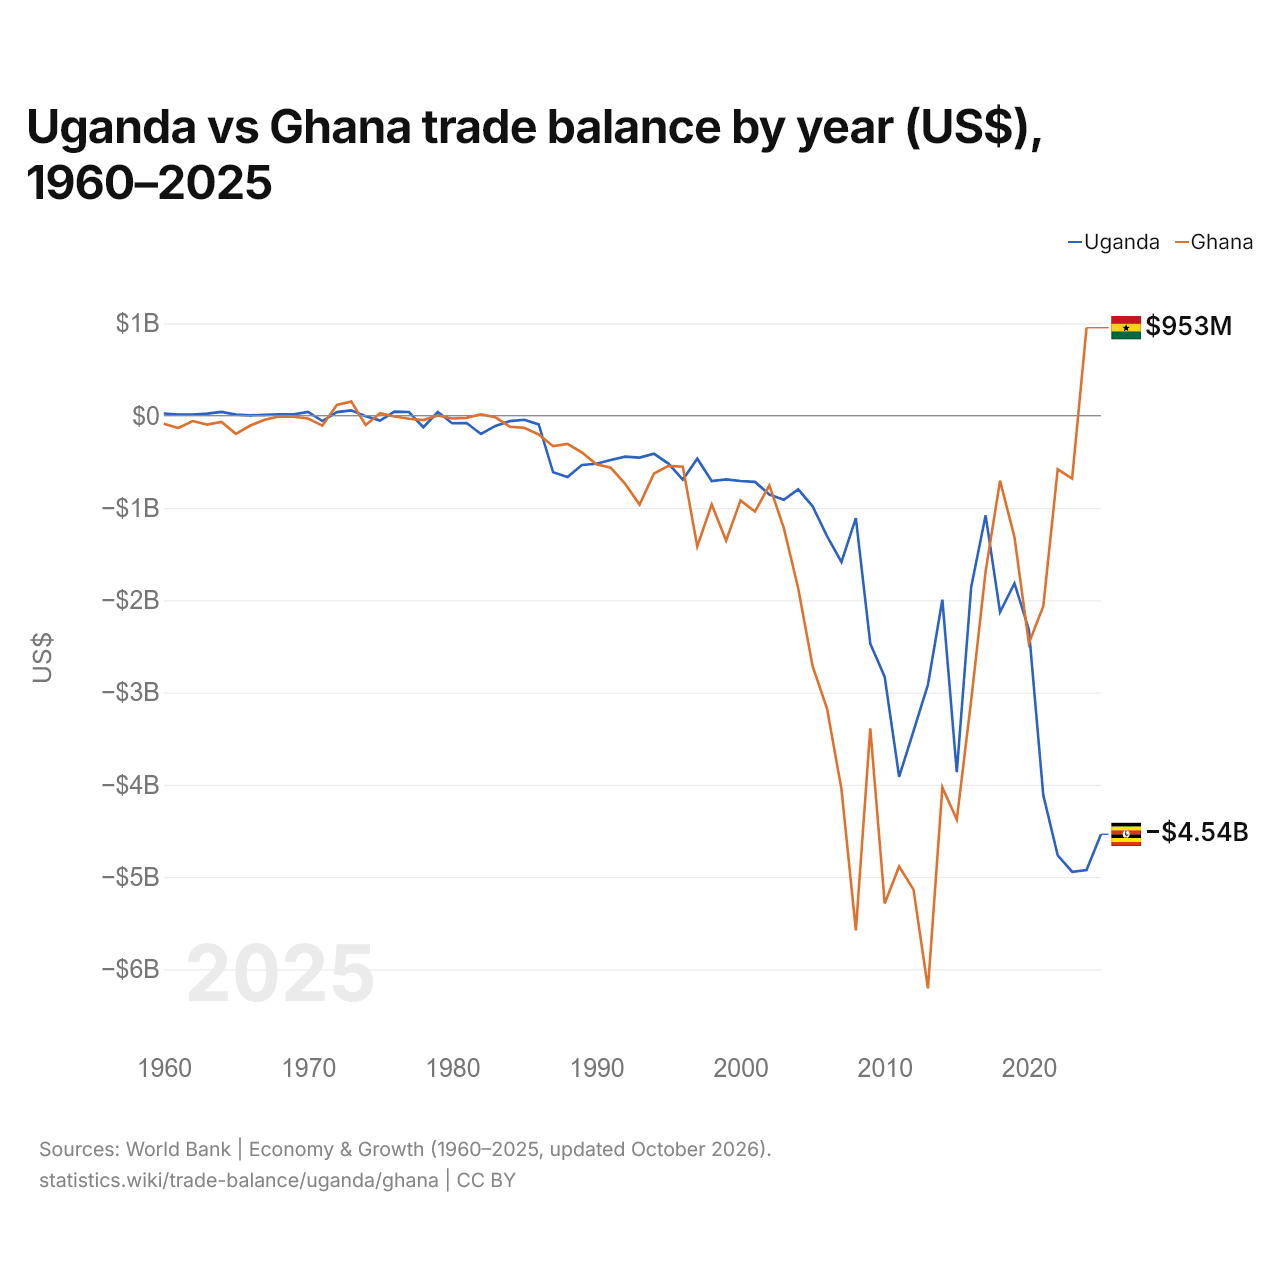
Ouganda vs Ghana : balance commerciale par année ($ US), 1960–2025
| Année | $ US | |
|---|---|---|
 Ouganda |
 Ghana |
|
| 2025 | −4 537 252 018 $ US | - |
| 2024 | −4 926 255 865 $ US | 953 399 973 $ US |
| 2023 | −4 944 332 557 $ US | −681 612 946 $ US |
| 2022 | −4 766 731 243 $ US | −582 015 087 $ US |
| 2021 | −4 114 427 872 $ US | −2 065 454 600 $ US |
| 2020 | −2 320 354 562 $ US | −2 467 550 988 $ US |
| 2019 | −1 818 185 984 $ US | −1 316 200 284 $ US |
| 2018 | −2 128 501 545 $ US | −705 366 714 $ US |
| 2017 | −1 080 604 950 $ US | −1 687 540 151 $ US |
| 2016 | −1 855 923 175 $ US | −3 082 608 043 $ US |
| 2015 | −3 865 296 279 $ US | −4 379 043 716 $ US |
| 2014 | −1 995 219 703 $ US | −4 031 316 042 $ US |
| 2013 | −2 915 602 908 $ US | −6 207 746 512 $ US |
| 2012 | −3 418 340 125 $ US | −5 138 161 192 $ US |
| 2011 | −3 914 243 128 $ US | −4 886 494 040 $ US |
| 2010 | −2 832 795 043 $ US | −5 288 265 245 $ US |
| 2009 | −2 471 758 273 $ US | −3 389 200 672 $ US |
| 2008 | −1 111 619 930 $ US | −5 579 663 206 $ US |
| 2007 | −1 586 288 050 $ US | −4 047 884 399 $ US |
| 2006 | −1 305 321 670 $ US | −3 175 919 428 $ US |
| 2005 | −982 580 658 $ US | −2 715 483 386 $ US |
| 2004 | −799 214 600 $ US | −1 870 753 812 $ US |
| 2003 | −912 561 144 $ US | −1 215 821 146 $ US |
| 2002 | −855 807 414 $ US | −755 774 800 $ US |
| 2001 | −718 020 537 $ US | −1 040 642 603 $ US |
| 2000 | −708 892 333 $ US | −919 032 737 $ US |
| 1999 | −691 128 207 $ US | −1 354 406 829 $ US |
| 1998 | −708 909 866 $ US | −961 957 641 $ US |
| 1997 | −466 409 535 $ US | −1 418 345 573 $ US |
| 1996 | −692 906 552 $ US | −553 292 937 $ US |
| 1995 | −520 277 743 $ US | −544 960 555 $ US |
| 1994 | −413 340 605 $ US | −626 545 496 $ US |
| 1993 | −454 558 163 $ US | −964 654 468 $ US |
| 1992 | −443 762 232 $ US | −740 526 497 $ US |
| 1991 | −480 765 196 $ US | −565 315 671 $ US |
| 1990 | −522 041 941 $ US | −528 394 040 $ US |
| 1989 | −534 973 266 $ US | −399 173 615 $ US |
| 1988 | −664 216 667 $ US | −305 562 698 $ US |
| 1987 | −614 174 488 $ US | −331 027 211 $ US |
| 1986 | −95 262 953 $ US | −204 161 059 $ US |
| 1985 | −44 693 327 $ US | −132 195 378 $ US |
| 1984 | −59 033 912 $ US | −120 303 327 $ US |
| 1983 | −111 666 667 $ US | −17 570 547 $ US |
| 1982 | −199 000 000 $ US | 14 379 085 $ US |
| 1981 | −80 000 000 $ US | −23 953 488 $ US |
| 1980 | −82 000 000 $ US | −30 601 660 $ US |
| 1979 | 40 000 000 $ US | 2 849 003 $ US |
| 1978 | −126 086 957 $ US | −48 691 099 $ US |
| 1977 | 39 764 706 $ US | −33 428 571 $ US |
| 1976 | 43 600 000 $ US | −9 322 034 $ US |
| 1975 | −53 444 444 $ US | 26 063 830 $ US |
| 1974 | −6 843 456 $ US | −100 621 118 $ US |
| 1973 | 57 819 653 $ US | 152 013 058 $ US |
| 1972 | 38 919 222 $ US | 116 307 445 $ US |
| 1971 | −58 658 827 $ US | −108 286 464 $ US |
| 1970 | 40 739 185 $ US | −30 396 585 $ US |
| 1969 | 13 859 723 $ US | −11 766 420 $ US |
| 1968 | 13 719 726 $ US | −7 844 280 $ US |
| 1967 | 8 819 824 $ US | −44 144 369 $ US |
| 1966 | 2 239 955 $ US | −106 455 106 $ US |
| 1965 | 10 779 784 $ US | −197 502 236 $ US |
| 1964 | 40 079 035 $ US | −68 635 529 $ US |
| 1963 | 22 771 535 $ US | −96 650 031 $ US |
| 1962 | 11 946 222 $ US | −58 830 453 $ US |
| 1961 | 12 253 449 $ US | −134 469 608 $ US |
| 1960 | 23 328 320 $ US | −88 245 680 $ US |
La balance commerciale de l'Ouganda affichait un déficit de 4,93 milliards de dollars (2024) et celle du Ghana un excédent de 953 millions de dollars (2024). En 1960, la balance commerciale de l'Ouganda affichait un excédent de 23,3 millions de dollars et celle du Ghana un déficit de 88,2 millions de dollars.
Depuis 1960, la balance commerciale de l'Ouganda a été excédentaire pendant 16 des 65 années, et celle du Ghana pendant 6. Les balances commerciales de l'Ouganda et du Ghana ont été déficitaires en même temps pendant 46 de ces années, la dernière fois en 2023.
Ouganda vs Ghana : chiffres de la balance commerciale
|
Ouganda
|
Ghana
|
|
|---|---|---|
| Biens et services, $ US | −4,54 Md $US (2025) | +953 M $US (2024) |
| % du PIB | −7,3 % (2025) | +1,1 % (2024) |
| Années d'excédent depuis 2000 | 0 sur 26 | 1 sur 25 |
| Solde des biens entre les deux, chiffres propres | −459 M $US (2025) | −89,0 k $US (2025) |
| Premier excédent en biens avec | Émirats arabes unis (+4,05 Md $US, 2025) | Émirats arabes unis (+7,07 Md $US, 2025) |
| Premier déficit en biens avec | Chine (−3,21 Md $US, 2025) | Chine (−3,03 Md $US, 2025) |
Comparer la balance commerciale de 2 pays au choix
Sources :
- Banque mondiale | Économie et croissance (1960–2025, mis à jour en octobre 2026)
- TradeMap (2001–2025, mis à jour en octobre 2026)
Creative Commons Attribution (CC BY) : vous pouvez copier, partager, adapter et réutiliser ce contenu, y compris à des fins commerciales, à condition de citer statistics.wiki et d’indiquer les modifications apportées. Les sources citées ci-dessus peuvent avoir leurs propres conditions de licence.