
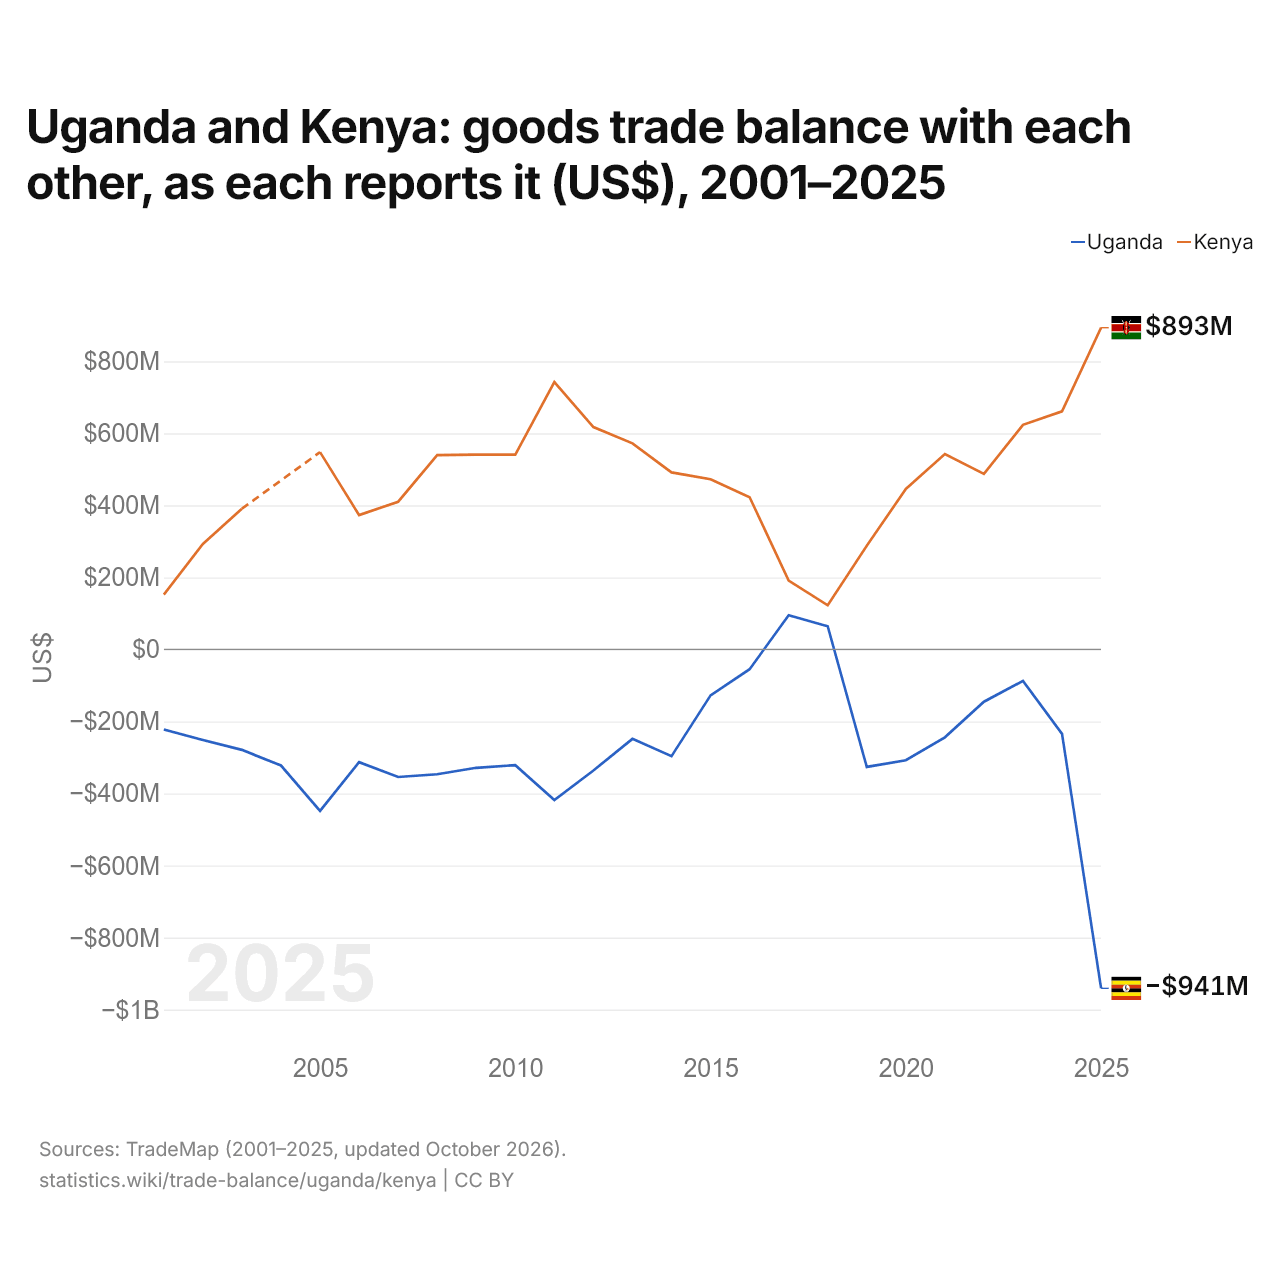
L'Ouganda et le Kenya : solde de leur commerce de biens bilatéral, selon chacun ($ US), 2001–2025
| Année | $ US | |
|---|---|---|
| Ouganda | Kenya | |
| 2025 | −940 917 000 $ US | 893 285 000 $ US |
| 2024 | −234 379 000 $ US | 661 091 000 $ US |
| 2023 | −87 411 000 $ US | 623 646 000 $ US |
| 2022 | −145 224 000 $ US | 487 398 000 $ US |
| 2021 | −244 163 000 $ US | 542 371 000 $ US |
| 2020 | −307 682 000 $ US | 445 348 000 $ US |
| 2019 | −326 266 000 $ US | 287 957 000 $ US |
| 2018 | 64 272 000 $ US | 122 601 000 $ US |
| 2017 | 94 770 000 $ US | 191 253 000 $ US |
| 2016 | −54 893 000 $ US | 422 722 000 $ US |
| 2015 | −127 518 000 $ US | 472 597 000 $ US |
| 2014 | −296 452 000 $ US | 491 598 000 $ US |
| 2013 | −248 389 000 $ US | 572 124 000 $ US |
| 2012 | −336 104 000 $ US | 617 508 000 $ US |
| 2011 | −417 993 000 $ US | 742 518 000 $ US |
| 2010 | −321 230 000 $ US | 540 975 000 $ US |
| 2009 | −328 685 000 $ US | 540 991 000 $ US |
| 2008 | −346 702 000 $ US | 539 297 000 $ US |
| 2007 | −354 257 000 $ US | 410 031 000 $ US |
| 2006 | −312 963 000 $ US | 373 006 000 $ US |
| 2005 | −448 249 000 $ US | 547 759 000 $ US |
| 2004 | −322 295 000 $ US | - |
| 2003 | −278 895 000 $ US | 390 849 000 $ US |
| 2002 | −251 367 000 $ US | 293 018 000 $ US |
| 2001 | −222 423 000 $ US | 152 140 000 $ US |
En 2025, selon l'Ouganda, son commerce de biens avec le Kenya affichait un déficit de 941 millions de dollars ; selon le Kenya, son commerce de biens avec l'Ouganda affichait un excédent de 893 millions de dollars. En 2001, les chiffres étaient un déficit de 222 millions de dollars pour l'Ouganda et un excédent de 152 millions de dollars pour le Kenya.
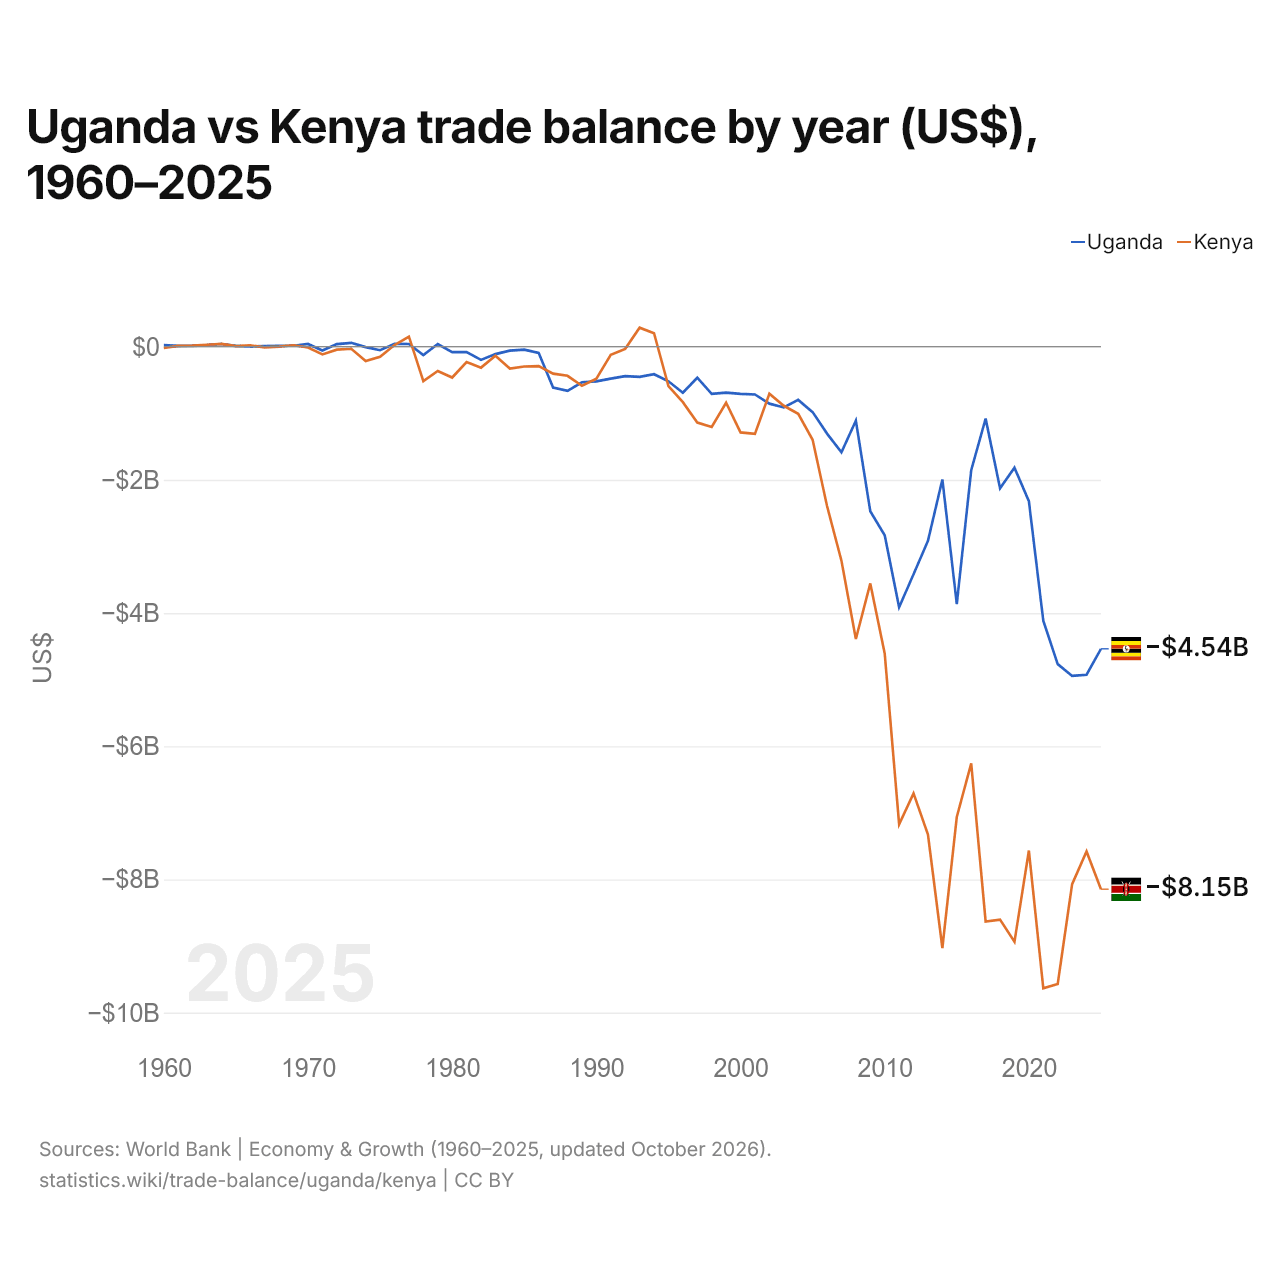
Ouganda vs Kenya : balance commerciale par année ($ US), 1960–2025
| Année | $ US | |
|---|---|---|
 Ouganda |
 Kenya |
|
| 2025 | −4 537 252 018 $ US | −8 146 837 172 $ US |
| 2024 | −4 926 255 865 $ US | −7 580 642 169 $ US |
| 2023 | −4 944 332 557 $ US | −8 070 176 487 $ US |
| 2022 | −4 766 731 243 $ US | −9 569 384 770 $ US |
| 2021 | −4 114 427 872 $ US | −9 634 802 145 $ US |
| 2020 | −2 320 354 562 $ US | −7 566 473 444 $ US |
| 2019 | −1 818 185 984 $ US | −8 937 164 424 $ US |
| 2018 | −2 128 501 545 $ US | −8 603 277 971 $ US |
| 2017 | −1 080 604 950 $ US | −8 631 666 733 $ US |
| 2016 | −1 855 923 175 $ US | −6 258 683 308 $ US |
| 2015 | −3 865 296 279 $ US | −7 061 070 722 $ US |
| 2014 | −1 995 219 703 $ US | −9 030 714 940 $ US |
| 2013 | −2 915 602 908 $ US | −7 326 740 668 $ US |
| 2012 | −3 418 340 125 $ US | −6 707 709 330 $ US |
| 2011 | −3 914 243 128 $ US | −7 172 553 509 $ US |
| 2010 | −2 832 795 043 $ US | −4 606 657 577 $ US |
| 2009 | −2 471 758 273 $ US | −3 555 176 337 $ US |
| 2008 | −1 111 619 930 $ US | −4 390 150 820 $ US |
| 2007 | −1 586 288 050 $ US | −3 213 973 760 $ US |
| 2006 | −1 305 321 670 $ US | −2 393 148 429 $ US |
| 2005 | −982 580 658 $ US | −1 397 997 983 $ US |
| 2004 | −799 214 600 $ US | −1 007 002 544 $ US |
| 2003 | −912 561 144 $ US | −888 105 848 $ US |
| 2002 | −855 807 414 $ US | −706 917 924 $ US |
| 2001 | −718 020 537 $ US | −1 309 467 862 $ US |
| 2000 | −708 892 333 $ US | −1 287 547 741 $ US |
| 1999 | −691 128 207 $ US | −841 697 403 $ US |
| 1998 | −708 909 866 $ US | −1 206 265 938 $ US |
| 1997 | −466 409 535 $ US | −1 139 017 853 $ US |
| 1996 | −692 906 552 $ US | −832 478 531 $ US |
| 1995 | −520 277 743 $ US | −593 650 220 $ US |
| 1994 | −413 340 605 $ US | 201 180 099 $ US |
| 1993 | −454 558 163 $ US | 284 643 208 $ US |
| 1992 | −443 762 232 $ US | −33 667 387 $ US |
| 1991 | −480 765 196 $ US | −123 448 965 $ US |
| 1990 | −522 041 941 $ US | −483 112 588 $ US |
| 1989 | −534 973 266 $ US | −587 299 190 $ US |
| 1988 | −664 216 667 $ US | −437 199 897 $ US |
| 1987 | −614 174 488 $ US | −405 900 103 $ US |
| 1986 | −95 262 953 $ US | −292 799 146 $ US |
| 1985 | −44 693 327 $ US | −297 399 994 $ US |
| 1984 | −59 033 912 $ US | −328 400 774 $ US |
| 1983 | −111 666 667 $ US | −135 299 726 $ US |
| 1982 | −199 000 000 $ US | −315 199 172 $ US |
| 1981 | −80 000 000 $ US | −230 339 924 $ US |
| 1980 | −82 000 000 $ US | −463 735 483 $ US |
| 1979 | 40 000 000 $ US | −365 202 295 $ US |
| 1978 | −126 086 957 $ US | −517 246 978 $ US |
| 1977 | 39 764 706 $ US | 151 270 558 $ US |
| 1976 | 43 600 000 $ US | 24 142 285 $ US |
| 1975 | −53 444 444 $ US | −152 794 704 $ US |
| 1974 | −6 843 456 $ US | −214 479 634 $ US |
| 1973 | 57 819 653 $ US | −31 994 266 $ US |
| 1972 | 38 919 222 $ US | −45 079 982 $ US |
| 1971 | −58 658 827 $ US | −116 480 233 $ US |
| 1970 | 40 739 185 $ US | −13 439 995 $ US |
| 1969 | 13 859 723 $ US | 20 999 992 $ US |
| 1968 | 13 719 726 $ US | 1 399 999 $ US |
| 1967 | 8 819 824 $ US | −11 199 996 $ US |
| 1966 | 2 239 955 $ US | 17 919 993 $ US |
| 1965 | 10 779 784 $ US | 6 999 997 $ US |
| 1964 | 40 079 035 $ US | 41 719 997 $ US |
| 1963 | 22 771 535 $ US | 28 447 989 $ US |
| 1962 | 11 946 222 $ US | 16 603 979 $ US |
| 1961 | 12 253 449 $ US | 12 585 995 $ US |
| 1960 | 23 328 320 $ US | −20 370 006 $ US |
En 2025, la balance commerciale de l'Ouganda affichait un déficit de 4,54 milliards de dollars et celle du Kenya un déficit de 8,15 milliards de dollars ; le déficit du Kenya était 1,8 fois plus grand. En 1960, la balance commerciale de l'Ouganda affichait un excédent de 23,3 millions de dollars et celle du Kenya un déficit de 20,4 millions de dollars.
De 1960 à 2025, la balance commerciale de l'Ouganda a été excédentaire pendant 16 des 66 années, et celle du Kenya pendant 12. Les balances commerciales de l'Ouganda et du Kenya ont été déficitaires en même temps pendant 48 de ces années, la dernière fois en 2025.
Ouganda vs Kenya : chiffres de la balance commerciale
|
Ouganda
|
Kenya
|
|
|---|---|---|
| Biens et services, $ US | −4,54 Md $US (2025) | −8,15 Md $US (2025) |
| % du PIB | −7,3 % (2025) | −6,0 % (2025) |
| Années d'excédent depuis 2000 | 0 sur 26 | 0 sur 26 |
| Solde des biens entre les deux, chiffres propres | −941 M $US (2025) | +893 M $US (2025) |
| Premier excédent en biens avec | Émirats arabes unis (+4,05 Md $US, 2025) | Ouganda (+893 M $US, 2025) |
| Premier déficit en biens avec | Chine (−3,21 Md $US, 2025) | Chine (−5,06 Md $US, 2025) |
Comparer la balance commerciale de 2 pays au choix
Sources :
- Banque mondiale | Économie et croissance (1960–2025, mis à jour en octobre 2026)
- TradeMap (2001–2025, mis à jour en octobre 2026)
Creative Commons Attribution (CC BY) : vous pouvez copier, partager, adapter et réutiliser ce contenu, y compris à des fins commerciales, à condition de citer statistics.wiki et d’indiquer les modifications apportées. Les sources citées ci-dessus peuvent avoir leurs propres conditions de licence.