
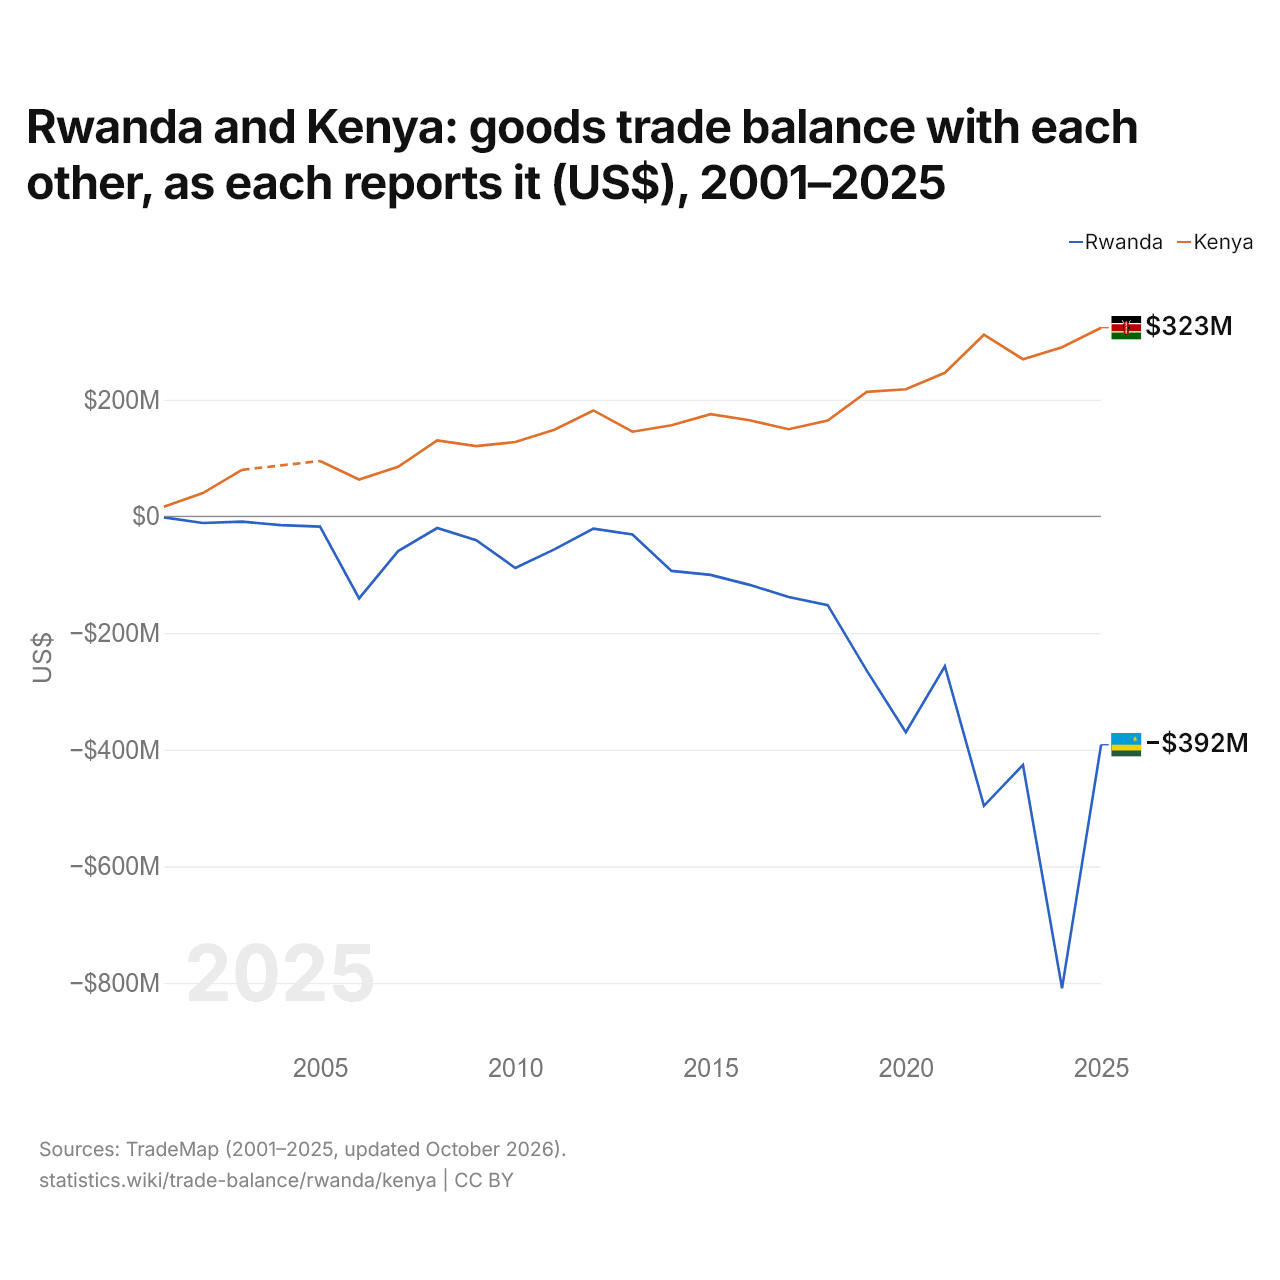
Le Rwanda et le Kenya : solde de leur commerce de biens bilatéral, selon chacun ($ US), 2001–2025
| Année | $ US | |
|---|---|---|
| Rwanda | Kenya | |
| 2025 | −391 554 000 $ US | 323 415 000 $ US |
| 2024 | −809 085 000 $ US | 289 920 000 $ US |
| 2023 | −426 129 000 $ US | 269 355 000 $ US |
| 2022 | −496 255 000 $ US | 311 455 000 $ US |
| 2021 | −256 963 000 $ US | 246 205 000 $ US |
| 2020 | −370 019 000 $ US | 217 805 000 $ US |
| 2019 | −264 514 000 $ US | 213 497 000 $ US |
| 2018 | −152 167 000 $ US | 164 307 000 $ US |
| 2017 | −138 219 000 $ US | 149 349 000 $ US |
| 2016 | −117 424 000 $ US | 164 850 000 $ US |
| 2015 | −100 256 000 $ US | 175 195 000 $ US |
| 2014 | −93 593 000 $ US | 156 067 000 $ US |
| 2013 | −31 159 000 $ US | 145 062 000 $ US |
| 2012 | −20 964 000 $ US | 181 591 000 $ US |
| 2011 | −56 584 000 $ US | 148 607 000 $ US |
| 2010 | −88 577 000 $ US | 127 470 000 $ US |
| 2009 | −40 802 000 $ US | 120 281 000 $ US |
| 2008 | −20 053 000 $ US | 130 028 000 $ US |
| 2007 | −59 595 000 $ US | 84 875 000 $ US |
| 2006 | −140 740 000 $ US | 63 219 000 $ US |
| 2005 | −17 530 000 $ US | 94 854 000 $ US |
| 2004 | −15 142 000 $ US | - |
| 2003 | −9 045 000 $ US | 79 732 000 $ US |
| 2002 | −11 370 000 $ US | 39 904 000 $ US |
| 2001 | −1 750 000 $ US | 16 415 000 $ US |
En 2025, selon le Rwanda, son commerce de biens avec le Kenya affichait un déficit de 392 millions de dollars ; selon le Kenya, son commerce de biens avec le Rwanda affichait un excédent de 323 millions de dollars. En 2001, les chiffres étaient un déficit de 1,75 million de dollars pour le Rwanda et un excédent de 16,4 millions de dollars pour le Kenya.
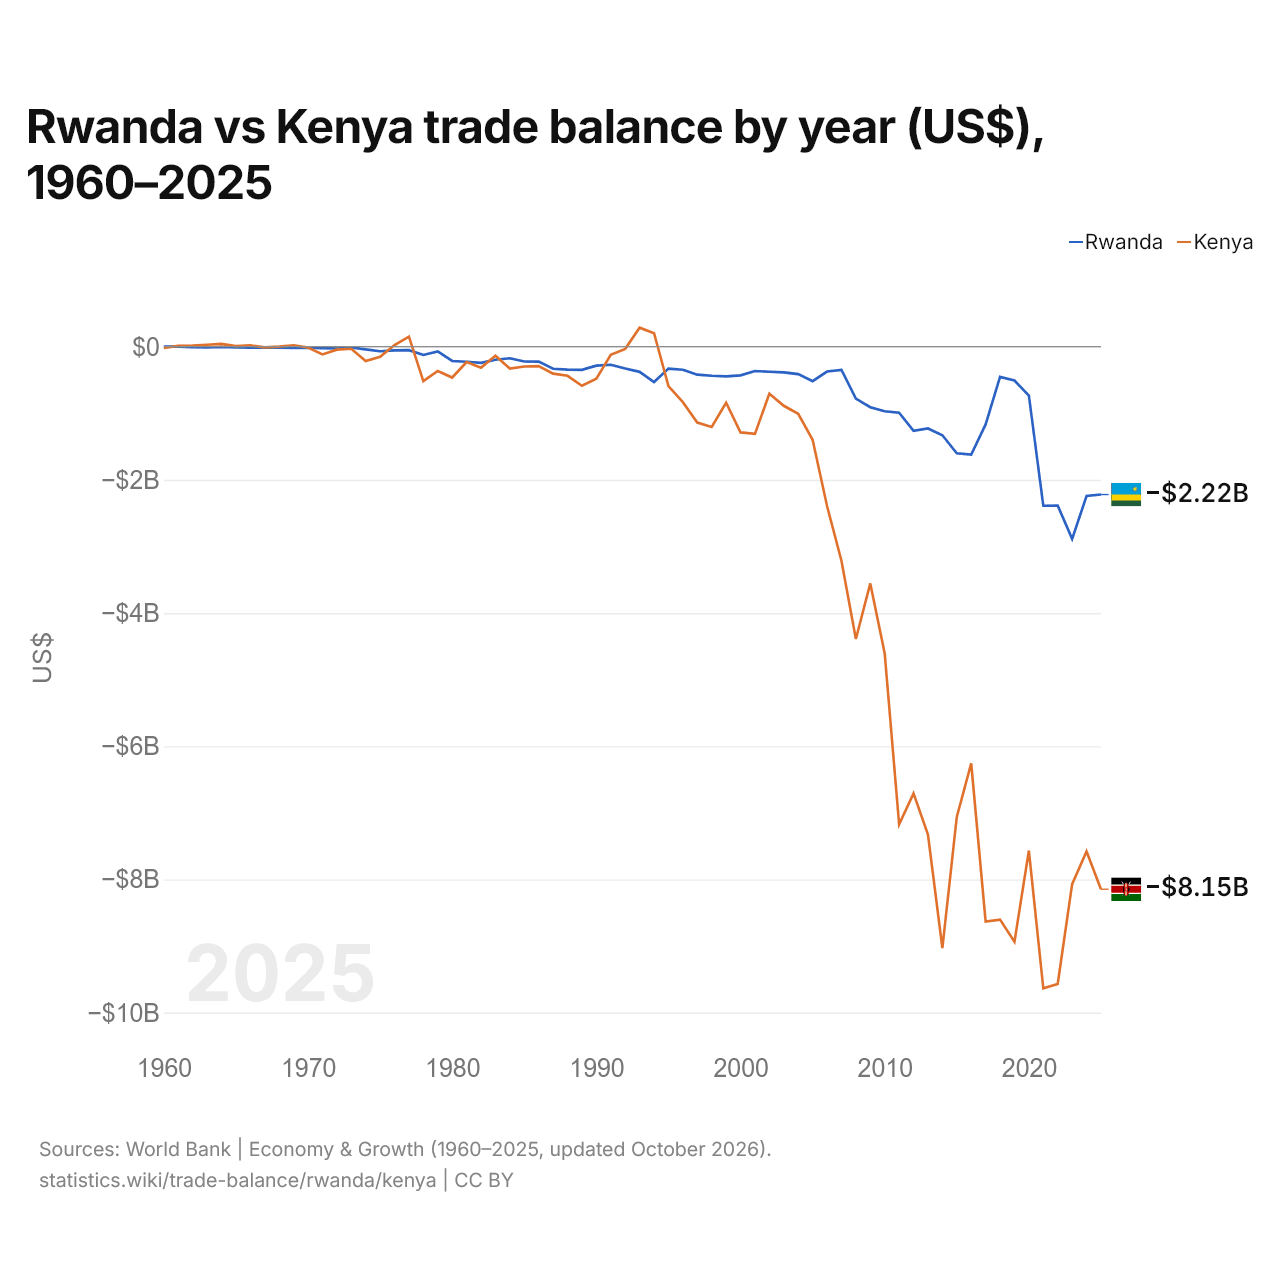
Rwanda vs Kenya : balance commerciale par année ($ US), 1960–2025
| Année | $ US | |
|---|---|---|
 Rwanda |
 Kenya |
|
| 2025 | −2 220 697 592 $ US | −8 146 837 172 $ US |
| 2024 | −2 243 138 772 $ US | −7 580 642 169 $ US |
| 2023 | −2 885 990 257 $ US | −8 070 176 487 $ US |
| 2022 | −2 386 643 900 $ US | −9 569 384 770 $ US |
| 2021 | −2 388 900 952 $ US | −9 634 802 145 $ US |
| 2020 | −735 624 874 $ US | −7 566 473 444 $ US |
| 2019 | −508 272 759 $ US | −8 937 164 424 $ US |
| 2018 | −454 699 558 $ US | −8 603 277 971 $ US |
| 2017 | −1 167 692 781 $ US | −8 631 666 733 $ US |
| 2016 | −1 620 828 877 $ US | −6 258 683 308 $ US |
| 2015 | −1 601 701 319 $ US | −7 061 070 722 $ US |
| 2014 | −1 330 524 198 $ US | −9 030 714 940 $ US |
| 2013 | −1 227 893 331 $ US | −7 326 740 668 $ US |
| 2012 | −1 264 864 308 $ US | −6 707 709 330 $ US |
| 2011 | −992 826 165 $ US | −7 172 553 509 $ US |
| 2010 | −970 622 548 $ US | −4 606 657 577 $ US |
| 2009 | −909 760 712 $ US | −3 555 176 337 $ US |
| 2008 | −779 008 892 $ US | −4 390 150 820 $ US |
| 2007 | −349 206 059 $ US | −3 213 973 760 $ US |
| 2006 | −373 384 365 $ US | −2 393 148 429 $ US |
| 2005 | −518 240 751 $ US | −1 397 997 983 $ US |
| 2004 | −411 862 671 $ US | −1 007 002 544 $ US |
| 2003 | −387 132 791 $ US | −888 105 848 $ US |
| 2002 | −377 495 209 $ US | −706 917 924 $ US |
| 2001 | −365 964 580 $ US | −1 309 467 862 $ US |
| 2000 | −430 355 717 $ US | −1 287 547 741 $ US |
| 1999 | −445 121 872 $ US | −841 697 403 $ US |
| 1998 | −437 459 662 $ US | −1 206 265 938 $ US |
| 1997 | −421 177 922 $ US | −1 139 017 853 $ US |
| 1996 | −346 796 512 $ US | −832 478 531 $ US |
| 1995 | −329 822 046 $ US | −593 650 220 $ US |
| 1994 | −530 681 448 $ US | 201 180 099 $ US |
| 1993 | −378 379 089 $ US | 284 643 208 $ US |
| 1992 | −327 954 558 $ US | −33 667 387 $ US |
| 1991 | −271 810 140 $ US | −123 448 965 $ US |
| 1990 | −284 713 741 $ US | −483 112 588 $ US |
| 1989 | −347 697 227 $ US | −587 299 190 $ US |
| 1988 | −344 047 837 $ US | −437 199 897 $ US |
| 1987 | −331 641 455 $ US | −405 900 103 $ US |
| 1986 | −225 192 562 $ US | −292 799 146 $ US |
| 1985 | −223 290 887 $ US | −297 399 994 $ US |
| 1984 | −173 898 152 $ US | −328 400 774 $ US |
| 1983 | −196 325 859 $ US | −135 299 726 $ US |
| 1982 | −243 493 366 $ US | −315 199 172 $ US |
| 1981 | −227 254 894 $ US | −230 339 924 $ US |
| 1980 | −215 023 166 $ US | −463 735 483 $ US |
| 1979 | −71 271 181 $ US | −365 202 295 $ US |
| 1978 | −124 550 207 $ US | −517 246 978 $ US |
| 1977 | −52 245 112 $ US | 151 270 558 $ US |
| 1976 | −55 770 304 $ US | 24 142 285 $ US |
| 1975 | −68 598 651 $ US | −152 794 704 $ US |
| 1974 | −41 280 127 $ US | −214 479 634 $ US |
| 1973 | −13 400 577 $ US | −31 994 266 $ US |
| 1972 | −27 491 651 $ US | −45 079 982 $ US |
| 1971 | −22 305 366 $ US | −116 480 233 $ US |
| 1970 | −14 988 251 $ US | −13 439 995 $ US |
| 1969 | −17 920 834 $ US | 20 999 992 $ US |
| 1968 | −16 171 710 $ US | 1 399 999 $ US |
| 1967 | −12 752 559 $ US | −11 199 996 $ US |
| 1966 | −15 768 881 $ US | 17 919 993 $ US |
| 1965 | −12 277 257 $ US | 6 999 997 $ US |
| 1964 | −4 213 956 $ US | 41 719 997 $ US |
| 1963 | −11 751 824 $ US | 28 447 989 $ US |
| 1962 | −7 628 495 $ US | 16 603 979 $ US |
| 1961 | −571 012 $ US | 12 585 995 $ US |
| 1960 | 206 401 $ US | −20 370 006 $ US |
En 2025, la balance commerciale du Rwanda affichait un déficit de 2,22 milliards de dollars et celle du Kenya un déficit de 8,15 milliards de dollars ; le déficit du Kenya était 3,7 fois plus grand. En 1960, la balance commerciale du Rwanda affichait un excédent de 206 000 dollars et celle du Kenya un déficit de 20,4 millions de dollars.
De 1960 à 2025, la balance commerciale du Rwanda a été excédentaire pendant une des 66 années, et celle du Kenya pendant 12. Les balances commerciales du Rwanda et du Kenya ont été déficitaires en même temps pendant 53 de ces années, la dernière fois en 2025.
Rwanda vs Kenya : chiffres de la balance commerciale
|
Rwanda
|
Kenya
|
|
|---|---|---|
| Biens et services, $ US | −2,22 Md $US (2025) | −8,15 Md $US (2025) |
| % du PIB | −13,6 % (2025) | −6,0 % (2025) |
| Années d'excédent depuis 2000 | 0 sur 26 | 0 sur 26 |
| Solde des biens entre les deux, chiffres propres | −392 M $US (2025) | +323 M $US (2025) |
| Premier excédent en biens avec | République démocratique du Congo (+811 M $US, 2025) | Ouganda (+893 M $US, 2025) |
| Premier déficit en biens avec | Chine (−1,09 Md $US, 2025) | Chine (−5,06 Md $US, 2025) |
Comparer la balance commerciale de 2 pays au choix
Sources :
- Banque mondiale | Économie et croissance (1960–2025, mis à jour en octobre 2026)
- TradeMap (2001–2025, mis à jour en octobre 2026)
Creative Commons Attribution (CC BY) : vous pouvez copier, partager, adapter et réutiliser ce contenu, y compris à des fins commerciales, à condition de citer statistics.wiki et d’indiquer les modifications apportées. Les sources citées ci-dessus peuvent avoir leurs propres conditions de licence.