
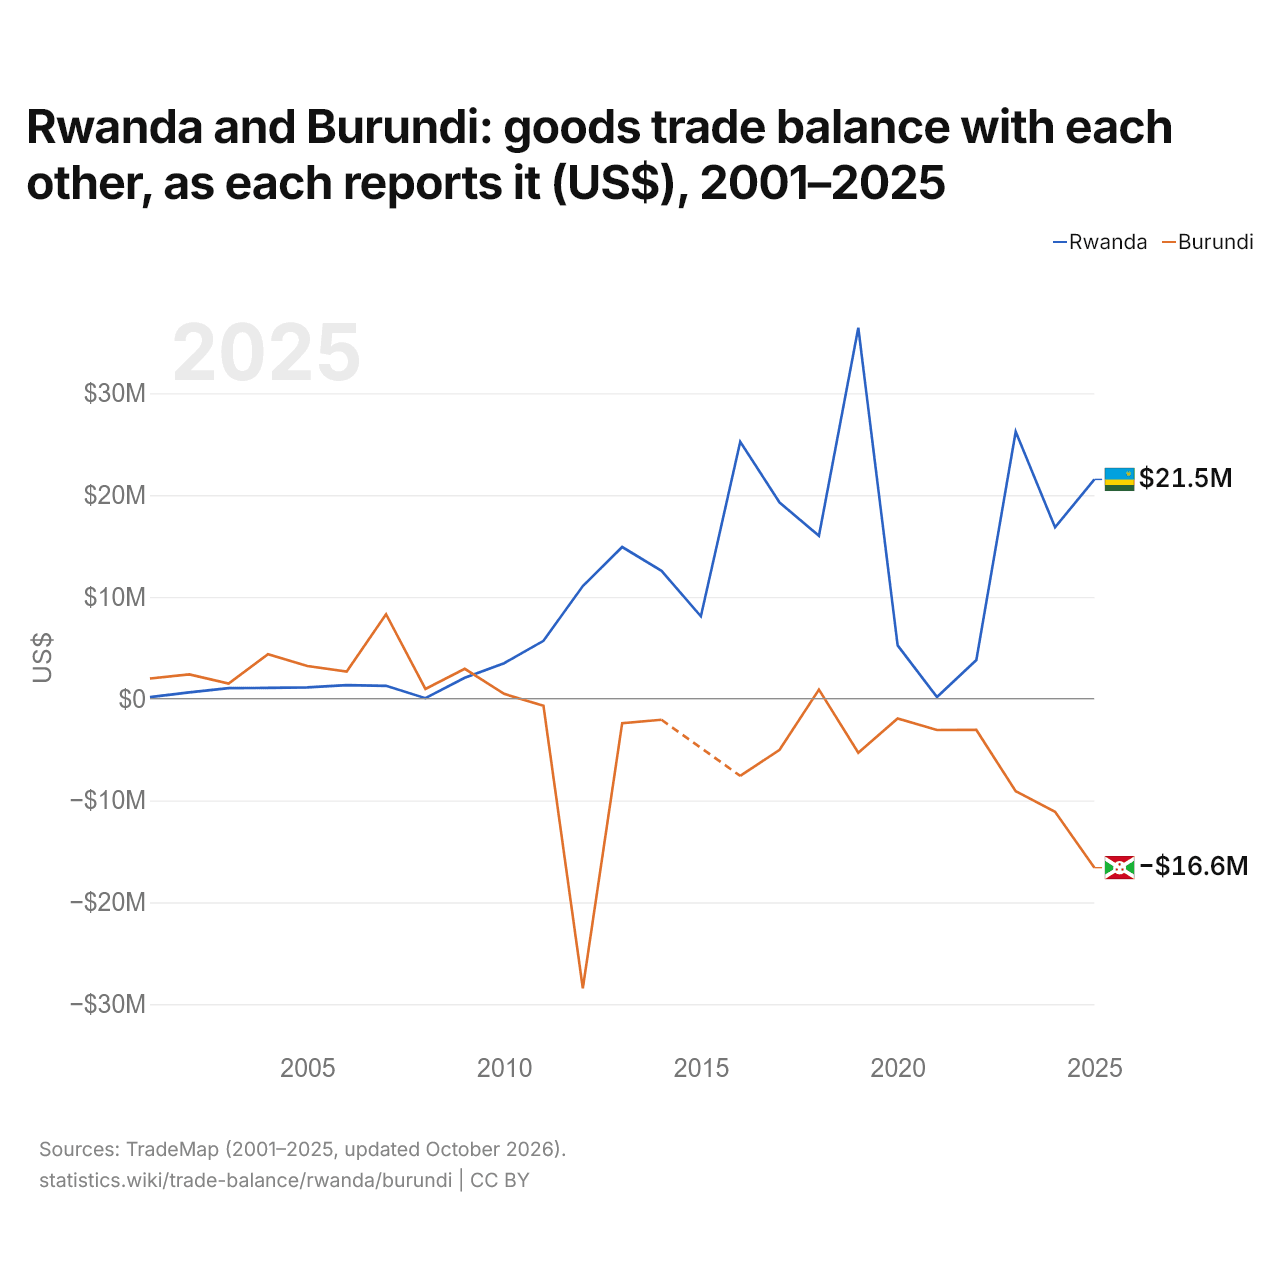
Le Rwanda et le Burundi : solde de leur commerce de biens bilatéral, selon chacun ($ US), 2001–2025
| Année | $ US | |
|---|---|---|
| Rwanda | Burundi | |
| 2025 | 21 538 000 $ US | −16 598 000 $ US |
| 2024 | 16 829 000 $ US | −11 103 000 $ US |
| 2023 | 26 228 000 $ US | −9 087 000 $ US |
| 2022 | 3 792 000 $ US | −3 070 000 $ US |
| 2021 | 169 000 $ US | −3 073 000 $ US |
| 2020 | 5 237 000 $ US | −1 943 000 $ US |
| 2019 | 36 440 000 $ US | −5 315 000 $ US |
| 2018 | 15 998 000 $ US | 893 000 $ US |
| 2017 | 19 267 000 $ US | −5 018 000 $ US |
| 2016 | 25 233 000 $ US | −7 587 000 $ US |
| 2015 | 8 094 000 $ US | - |
| 2014 | 12 554 000 $ US | −2 069 000 $ US |
| 2013 | 14 898 000 $ US | −2 401 000 $ US |
| 2012 | 11 067 000 $ US | −28 446 000 $ US |
| 2011 | 5 686 000 $ US | −689 000 $ US |
| 2010 | 3 488 000 $ US | 472 000 $ US |
| 2009 | 2 050 000 $ US | 2 942 000 $ US |
| 2008 | 50 000 $ US | 963 000 $ US |
| 2007 | 1 267 000 $ US | 8 296 000 $ US |
| 2006 | 1 326 000 $ US | 2 663 000 $ US |
| 2005 | 1 114 000 $ US | 3 216 000 $ US |
| 2004 | 1 060 000 $ US | 4 377 000 $ US |
| 2003 | 1 039 000 $ US | 1 494 000 $ US |
| 2002 | 615 000 $ US | 2 384 000 $ US |
| 2001 | 151 000 $ US | 1 986 000 $ US |
En 2025, selon le Rwanda, son commerce de biens avec le Burundi affichait un excédent de 21,5 millions de dollars ; selon le Burundi, son commerce de biens avec le Rwanda affichait un déficit de 16,6 millions de dollars. En 2001, les chiffres étaient un excédent de 151 000 dollars pour le Rwanda et un excédent de 1,99 million de dollars pour le Burundi.
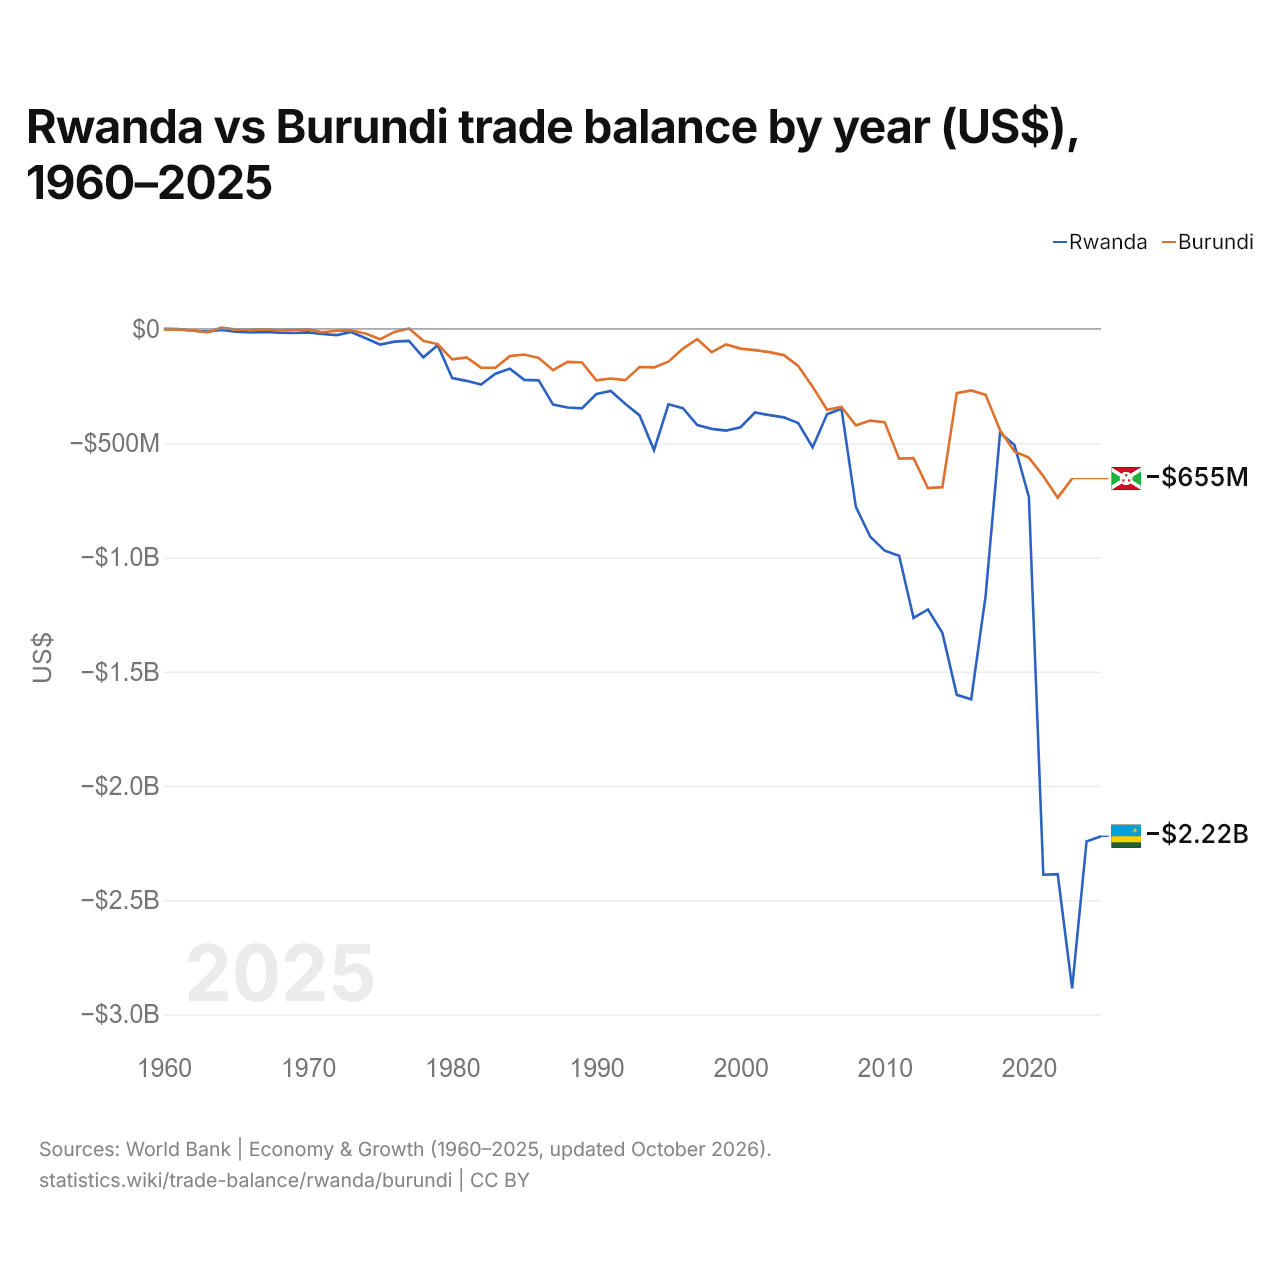
Rwanda vs Burundi : balance commerciale par année ($ US), 1960–2025
| Année | $ US | |
|---|---|---|
 Rwanda |
 Burundi |
|
| 2025 | −2 220 697 592 $ US | - |
| 2024 | −2 243 138 772 $ US | - |
| 2023 | −2 885 990 257 $ US | −655 155 826 $ US |
| 2022 | −2 386 643 900 $ US | −738 734 924 $ US |
| 2021 | −2 388 900 952 $ US | −644 543 325 $ US |
| 2020 | −735 624 874 $ US | −563 532 029 $ US |
| 2019 | −508 272 759 $ US | −536 467 699 $ US |
| 2018 | −454 699 558 $ US | −443 665 763 $ US |
| 2017 | −1 167 692 781 $ US | −288 434 958 $ US |
| 2016 | −1 620 828 877 $ US | −269 000 714 $ US |
| 2015 | −1 601 701 319 $ US | −281 158 301 $ US |
| 2014 | −1 330 524 198 $ US | −692 772 348 $ US |
| 2013 | −1 227 893 331 $ US | −696 594 008 $ US |
| 2012 | −1 264 864 308 $ US | −565 865 585 $ US |
| 2011 | −992 826 165 $ US | −567 896 522 $ US |
| 2010 | −970 622 548 $ US | −408 459 217 $ US |
| 2009 | −909 760 712 $ US | −401 261 931 $ US |
| 2008 | −779 008 892 $ US | −422 300 979 $ US |
| 2007 | −349 206 059 $ US | −341 762 225 $ US |
| 2006 | −373 384 365 $ US | −353 998 272 $ US |
| 2005 | −518 240 751 $ US | −253 584 652 $ US |
| 2004 | −411 862 671 $ US | −161 731 658 $ US |
| 2003 | −387 132 791 $ US | −114 665 349 $ US |
| 2002 | −377 495 209 $ US | −101 541 858 $ US |
| 2001 | −365 964 580 $ US | −92 989 703 $ US |
| 2000 | −430 355 717 $ US | −86 315 512 $ US |
| 1999 | −445 121 872 $ US | −67 783 377 $ US |
| 1998 | −437 459 662 $ US | −102 252 107 $ US |
| 1997 | −421 177 922 $ US | −44 796 367 $ US |
| 1996 | −346 796 512 $ US | −86 321 830 $ US |
| 1995 | −329 822 046 $ US | −143 580 890 $ US |
| 1994 | −530 681 448 $ US | −168 448 010 $ US |
| 1993 | −378 379 089 $ US | −166 880 195 $ US |
| 1992 | −327 954 558 $ US | −224 489 561 $ US |
| 1991 | −271 810 140 $ US | −216 993 754 $ US |
| 1990 | −284 713 741 $ US | −225 312 546 $ US |
| 1989 | −347 697 227 $ US | −147 013 717 $ US |
| 1988 | −344 047 837 $ US | −144 635 191 $ US |
| 1987 | −331 641 455 $ US | −180 963 682 $ US |
| 1986 | −225 192 562 $ US | −127 291 597 $ US |
| 1985 | −223 290 887 $ US | −112 241 235 $ US |
| 1984 | −173 898 152 $ US | −118 934 091 $ US |
| 1983 | −196 325 859 $ US | −170 043 034 $ US |
| 1982 | −243 493 366 $ US | −169 162 222 $ US |
| 1981 | −227 254 894 $ US | −124 952 222 $ US |
| 1980 | −215 023 166 $ US | −133 201 111 $ US |
| 1979 | −71 271 181 $ US | −66 977 778 $ US |
| 1978 | −124 550 207 $ US | −51 983 333 $ US |
| 1977 | −52 245 112 $ US | 1 665 556 $ US |
| 1976 | −55 770 304 $ US | −13 122 319 $ US |
| 1975 | −68 598 651 $ US | −45 155 556 $ US |
| 1974 | −41 280 127 $ US | −19 958 095 $ US |
| 1973 | −13 400 577 $ US | −7 050 201 $ US |
| 1972 | −27 491 651 $ US | −8 244 571 $ US |
| 1971 | −22 305 366 $ US | −14 502 857 $ US |
| 1970 | −14 988 251 $ US | −2 262 857 $ US |
| 1969 | −17 920 834 $ US | −4 633 143 $ US |
| 1968 | −16 171 710 $ US | −5 626 286 $ US |
| 1967 | −12 752 559 $ US | −1 934 857 $ US |
| 1966 | −15 768 881 $ US | −3 666 286 $ US |
| 1965 | −12 277 257 $ US | −3 476 148 $ US |
| 1964 | −4 213 956 $ US | 5 249 998 $ US |
| 1963 | −11 751 824 $ US | −15 750 000 $ US |
| 1962 | −7 628 495 $ US | −7 000 000 $ US |
| 1961 | −571 012 $ US | −3 500 000 $ US |
| 1960 | 206 401 $ US | −1 750 002 $ US |
La balance commerciale du Rwanda affichait un déficit de 2,89 milliards de dollars (2023) et celle du Burundi un déficit de 655 millions de dollars (2023) ; le déficit du Rwanda était 4,4 fois plus grand. En 1960, la balance commerciale du Rwanda affichait un excédent de 206 000 dollars et celle du Burundi un déficit de 1,75 million de dollars.
Depuis 1960, la balance commerciale du Rwanda a été excédentaire pendant une des 64 années, et celle du Burundi pendant 2. Les balances commerciales du Rwanda et du Burundi ont été déficitaires en même temps pendant 61 de ces années, dont la dernière.
Rwanda vs Burundi : chiffres de la balance commerciale
|
Rwanda
|
Burundi
|
|
|---|---|---|
| Biens et services, $ US | −2,22 Md $US (2025) | −655 M $US (2023) |
| % du PIB | −13,6 % (2025) | −19,2 % (2023) |
| Années d'excédent depuis 2000 | 0 sur 26 | 0 sur 24 |
| Solde des biens entre les deux, chiffres propres | +21,5 M $US (2025) | −16,6 M $US (2025) |
| Premier excédent en biens avec | République démocratique du Congo (+811 M $US, 2025) | République démocratique du Congo (+20,6 M $US, 2025) |
| Premier déficit en biens avec | Chine (−1,09 Md $US, 2025) | Chine (−291 M $US, 2025) |
Comparer la balance commerciale de 2 pays au choix
Sources :
- Banque mondiale | Économie et croissance (1960–2025, mis à jour en octobre 2026)
- TradeMap (2001–2025, mis à jour en octobre 2026)
Creative Commons Attribution (CC BY) : vous pouvez copier, partager, adapter et réutiliser ce contenu, y compris à des fins commerciales, à condition de citer statistics.wiki et d’indiquer les modifications apportées. Les sources citées ci-dessus peuvent avoir leurs propres conditions de licence.