
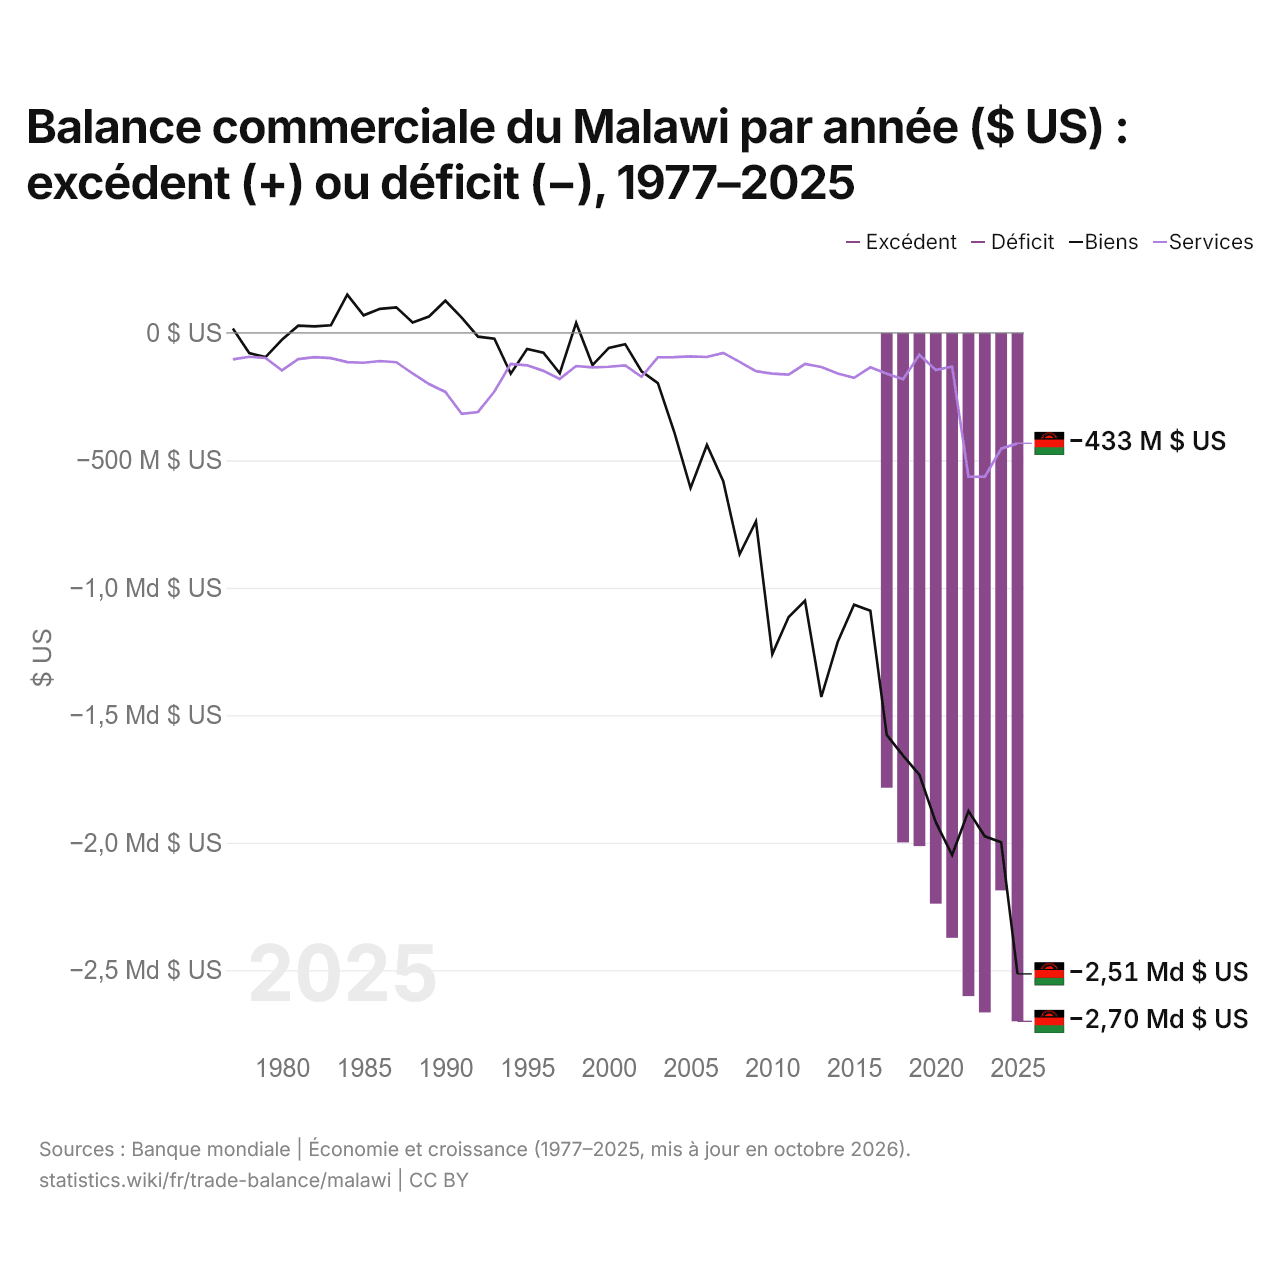
Balance commerciale du Malawi par année ($ US) : excédent (+) ou déficit (−), 1977–2025
| Année | $ US | ||
|---|---|---|---|
| Biens et services | Biens | Services | |
| 2025 | −2 700 469 202 $ US | −2 514 419 831 $ US | −433 420 164 $ US |
| 2024 | −2 186 909 316 $ US | −1 998 280 112 $ US | −454 437 772 $ US |
| 2023 | −2 665 730 786 $ US | −1 974 692 346 $ US | −564 628 507 $ US |
| 2022 | −2 601 633 817 $ US | −1 875 583 185 $ US | −563 690 093 $ US |
| 2021 | −2 373 114 320 $ US | −2 048 402 488 $ US | −132 196 384 $ US |
| 2020 | −2 238 857 165 $ US | −1 919 483 979 $ US | −145 513 975 $ US |
| 2019 | −2 013 265 090 $ US | −1 733 265 682 $ US | −85 704 117 $ US |
| 2018 | −1 998 883 478 $ US | −1 658 353 584 $ US | −181 600 095 $ US |
| 2017 | −1 784 242 184 $ US | −1 576 854 792 $ US | −160 138 244 $ US |
| 2016 | - | −1 089 984 248 $ US | −135 139 412 $ US |
| 2015 | - | −1 066 224 474 $ US | −176 339 051 $ US |
| 2014 | - | −1 212 682 456 $ US | −159 369 459 $ US |
| 2013 | - | −1 428 208 826 $ US | −134 057 752 $ US |
| 2012 | - | −1 050 473 303 $ US | −122 176 521 $ US |
| 2011 | - | −1 114 506 216 $ US | −163 495 252 $ US |
| 2010 | - | −1 260 069 731 $ US | −159 812 801 $ US |
| 2009 | - | −739 972 407 $ US | −150 078 034 $ US |
| 2008 | - | −868 509 265 $ US | −113 920 620 $ US |
| 2007 | - | −582 119 957 $ US | −78 596 307 $ US |
| 2006 | - | −439 643 949 $ US | −94 749 206 $ US |
| 2005 | - | −608 596 397 $ US | −92 046 783 $ US |
| 2004 | - | −388 778 826 $ US | −94 888 115 $ US |
| 2003 | - | −196 860 076 $ US | −95 846 738 $ US |
| 2002 | - | −150 791 718 $ US | −172 479 375 $ US |
| 2001 | - | −44 298 971 $ US | −127 767 024 $ US |
| 2000 | - | −58 842 022 $ US | −132 831 072 $ US |
| 1999 | - | −126 571 154 $ US | −135 479 001 $ US |
| 1998 | - | 38 962 529 $ US | −130 025 618 $ US |
| 1997 | - | −158 413 396 $ US | −180 383 838 $ US |
| 1996 | - | −77 915 145 $ US | −149 098 120 $ US |
| 1995 | - | −63 304 374 $ US | −127 254 245 $ US |
| 1994 | - | −160 087 015 $ US | −121 643 971 $ US |
| 1993 | - | −22 781 070 $ US | −230 104 703 $ US |
| 1992 | - | −15 041 870 $ US | −310 328 762 $ US |
| 1991 | - | 59 679 397 $ US | −317 945 288 $ US |
| 1990 | - | 126 132 256 $ US | −231 779 929 $ US |
| 1989 | - | 63 996 540 $ US | −200 759 249 $ US |
| 1988 | - | 40 448 197 $ US | −159 411 185 $ US |
| 1987 | - | 99 966 384 $ US | −115 223 934 $ US |
| 1986 | - | 94 300 422 $ US | −110 420 152 $ US |
| 1985 | - | 68 815 211 $ US | −117 329 062 $ US |
| 1984 | - | 149 782 790 $ US | −114 618 857 $ US |
| 1983 | - | 29 963 482 $ US | −98 998 664 $ US |
| 1982 | - | 25 674 815 $ US | −95 119 977 $ US |
| 1981 | - | 28 258 713 $ US | −103 094 041 $ US |
| 1980 | - | −27 213 543 $ US | −146 780 737 $ US |
| 1979 | - | −95 118 253 $ US | −98 423 520 $ US |
| 1978 | - | −79 407 870 $ US | −93 748 695 $ US |
| 1977 | - | 16 834 120 $ US | −104 105 744 $ US |
En 2025, la balance commerciale du Malawi affichait un déficit de 2,7 milliards de dollars, contre un déficit de 1,78 milliard de dollars en 2017. La balance commerciale du Malawi est déficitaire chaque année depuis 2017.
En 2025, le solde commercial du Malawi était le 38e plus élevé de 50 pays situés en Afrique, où les soldes allaient d'un déficit de 42,7 milliards de dollars en Égypte à un excédent de 13,8 milliards de dollars en Angola. En 2025, les transactions courantes du Malawi affichaient un déficit de 14,0 % du PIB.
Commerce de biens du Malawi avec ses 10 principaux partenaires commerciaux, selon le Malawi, 2025
| Pays | Exportations vers | Importations depuis | Solde | |
|---|---|---|---|---|
 Chine |
63,3 M $US | 799 M $US | −735 M $US | |
 Afrique du Sud |
39,9 M $US | 527 M $US | −487 M $US | vs Afrique du Sud |
 Tanzanie |
21,1 M $US | 533 M $US | −511 M $US | |
 Inde |
51,4 M $US | 231 M $US | −180 M $US | |
 EAU |
17,8 M $US | 262 M $US | −244 M $US | |
 Belgique |
171 M $US | 39,2 M $US | +132 M $US | |
 Mozambique |
16,1 M $US | 194 M $US | −178 M $US | vs Mozambique |
 Zambie |
22,7 M $US | 175 M $US | −153 M $US | vs Zambie |
 Japon |
3,21 M $US | 137 M $US | −134 M $US | |
 États-Unis |
42,5 M $US | 86,3 M $US | −43,8 M $US |
Balance commerciale du Malawi : excédent (+) ou déficit (−)
Comparer la balance commerciale du Malawi avec celle d'autres pays
Sources :
- TradeMap (2025, mis à jour en octobre 2026)
- Banque mondiale | Économie et croissance (1977–2025, mis à jour en octobre 2026)
Creative Commons Attribution (CC BY) : vous pouvez copier, partager, adapter et réutiliser ce contenu, y compris à des fins commerciales, à condition de citer statistics.wiki et d’indiquer les modifications apportées. Les sources citées ci-dessus peuvent avoir leurs propres conditions de licence.