
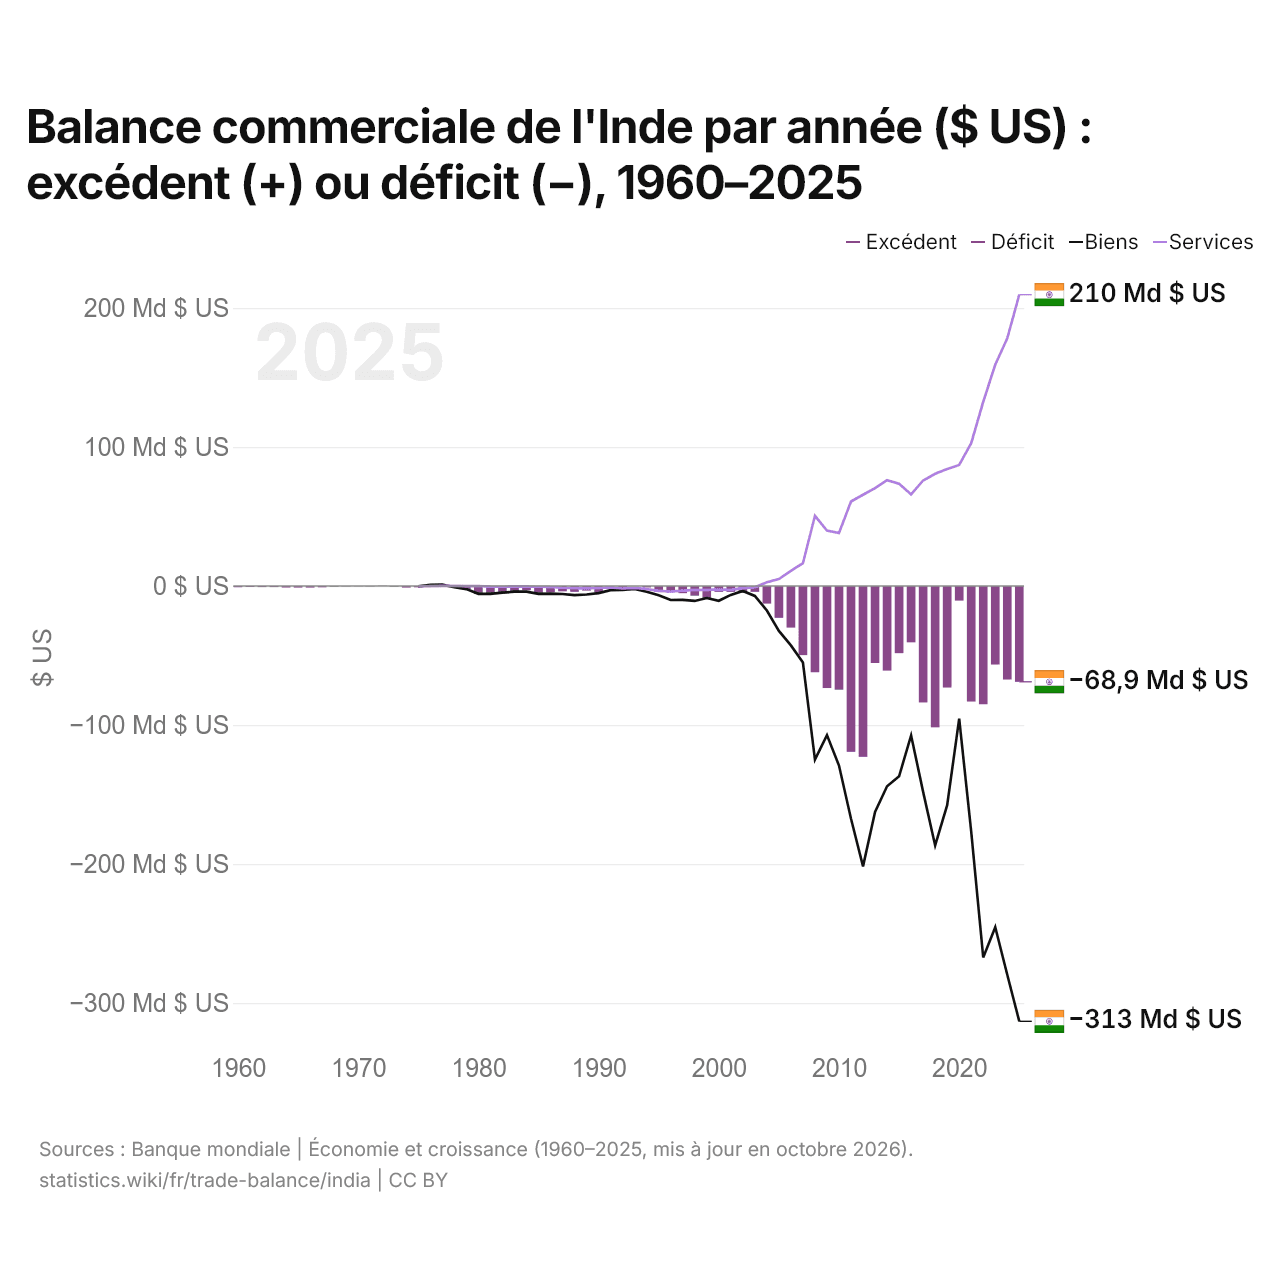
Balance commerciale de l'Inde par année ($ US) : excédent (+) ou déficit (−), 1960–2025
| Année | $ US | ||
|---|---|---|---|
| Biens et services | Biens | Services | |
| 2025 | −68 919 379 155 $ US | −313 173 969 487 $ US | 209 573 007 638 $ US |
| 2024 | −67 270 704 658 $ US | −279 651 205 780 $ US | 178 205 757 137 $ US |
| 2023 | −56 481 801 795 $ US | −245 479 034 905 $ US | 159 142 094 567 $ US |
| 2022 | −85 070 227 555 $ US | −267 187 617 153 $ US | 132 526 651 930 $ US |
| 2021 | −83 133 636 377 $ US | −176 720 830 684 $ US | 102 681 456 256 $ US |
| 2020 | −10 516 218 300 $ US | −95 449 862 090 $ US | 87 107 693 826 $ US |
| 2019 | −73 069 992 885 $ US | −157 678 010 763 $ US | 84 226 339 441 $ US |
| 2018 | −101 665 620 603 $ US | −186 691 649 288 $ US | 80 773 964 347 $ US |
| 2017 | −83 759 204 290 $ US | −148 134 484 997 $ US | 75 922 872 372 $ US |
| 2016 | −40 526 477 692 $ US | −107 475 549 276 $ US | 65 896 343 011 $ US |
| 2015 | −48 309 654 578 $ US | −136 884 248 923 $ US | 73 635 077 528 $ US |
| 2014 | −60 893 612 908 $ US | −144 047 356 697 $ US | 76 077 549 073 $ US |
| 2013 | −55 375 035 766 $ US | −162 576 463 203 $ US | 70 441 411 511 $ US |
| 2012 | −122 906 076 681 $ US | −201 668 377 075 $ US | 65 604 978 049 $ US |
| 2011 | −119 283 327 195 $ US | −167 456 559 194 $ US | 60 769 776 585 $ US |
| 2010 | −74 620 856 173 $ US | −129 179 002 739 $ US | 38 155 340 261 $ US |
| 2009 | −73 425 843 079 $ US | −107 269 363 653 $ US | 39 859 344 862 $ US |
| 2008 | −62 024 910 978 $ US | −124 851 420 881 $ US | 50 491 377 365 $ US |
| 2007 | −49 726 426 539 $ US | −55 081 319 693 $ US | 16 377 607 254 $ US |
| 2006 | −29 981 104 764 $ US | −42 695 648 388 $ US | 10 925 684 130 $ US |
| 2005 | −22 898 356 563 $ US | −32 288 927 608 $ US | 5 012 591 337 $ US |
| 2004 | −12 662 376 777 $ US | −17 617 201 854 $ US | 2 656 948 487 $ US |
| 2003 | −4 233 294 135 $ US | −7 187 862 551 $ US | −976 228 810 $ US |
| 2002 | −5 045 863 334 $ US | −3 561 161 456 $ US | −1 561 045 736 $ US |
| 2001 | −4 254 860 905 $ US | −6 419 076 590 $ US | −2 761 861 819 $ US |
| 2000 | −4 245 772 554 $ US | −10 640 580 424 $ US | −2 502 913 842 $ US |
| 1999 | −8 770 221 354 $ US | −8 678 932 808 $ US | −2 762 296 032 $ US |
| 1998 | −7 005 099 303 $ US | −10 752 254 720 $ US | −2 848 761 594 $ US |
| 1997 | −5 148 241 779 $ US | −10 028 030 528 $ US | −3 332 101 227 $ US |
| 1996 | −4 554 261 385 $ US | −10 051 664 889 $ US | −3 932 649 792 $ US |
| 1995 | −4 249 570 650 $ US | −6 718 787 335 $ US | −3 493 076 887 $ US |
| 1994 | −988 286 716 $ US | −4 150 091 577 $ US | −2 161 626 846 $ US |
| 1993 | 47 187 344 $ US | −2 092 517 089 $ US | −1 389 535 519 $ US |
| 1992 | −2 153 620 947 $ US | −2 911 157 011 $ US | −1 801 013 084 $ US |
| 1991 | 2 039 268 $ US | −2 991 949 367 $ US | −1 019 612 228 $ US |
| 1990 | −4 492 297 406 $ US | −5 150 872 511 $ US | −1 464 684 609 $ US |
| 1989 | −3 362 657 410 $ US | −6 110 394 115 $ US | −1 733 853 539 $ US |
| 1988 | −4 211 604 784 $ US | −6 581 412 615 $ US | −1 530 118 287 $ US |
| 1987 | −3 838 531 827 $ US | −5 776 859 517 $ US | −1 265 775 310 $ US |
| 1986 | −4 548 547 296 $ US | −5 438 418 173 $ US | −717 098 129 $ US |
| 1985 | −5 559 179 686 $ US | −5 616 169 910 $ US | −518 761 350 $ US |
| 1984 | −3 060 529 243 $ US | −4 024 728 084 $ US | −409 464 952 $ US |
| 1983 | −4 398 713 512 $ US | −4 097 695 768 $ US | −414 910 959 $ US |
| 1982 | −4 334 108 792 $ US | −4 819 968 799 $ US | −538 739 722 $ US |
| 1981 | −5 098 906 809 $ US | −5 711 148 537 $ US | −451 576 122 $ US |
| 1980 | −5 786 386 673 $ US | −5 643 555 549 $ US | −9 992 911 $ US |
| 1979 | −2 171 813 477 $ US | −2 221 565 915 $ US | −36 773 251 $ US |
| 1978 | −375 331 507 $ US | −884 155 916 $ US | 51 667 275 $ US |
| 1977 | 143 648 830 $ US | 932 137 784 $ US | 30 291 318 $ US |
| 1976 | 587 355 938 $ US | 787 005 793 $ US | −84 504 603 $ US |
| 1975 | −984 594 448 $ US | −286 205 133 $ US | −213 812 467 $ US |
| 1974 | −1 183 618 321 $ US | - | - |
| 1973 | −440 047 978 $ US | - | - |
| 1972 | 227 671 476 $ US | - | - |
| 1971 | −225 759 297 $ US | - | - |
| 1970 | −60 000 000 $ US | - | - |
| 1969 | −185 333 333 $ US | - | - |
| 1968 | −480 000 000 $ US | - | - |
| 1967 | −958 666 667 $ US | - | - |
| 1966 | −1 152 811 397 $ US | - | - |
| 1965 | −1 134 001 134 $ US | - | - |
| 1964 | −1 106 701 107 $ US | - | - |
| 1963 | −787 500 788 $ US | - | - |
| 1962 | −785 400 785 $ US | - | - |
| 1961 | −648 900 649 $ US | - | - |
| 1960 | −877 800 878 $ US | - | - |
En 2025, la balance commerciale de l'Inde affichait un déficit de 68,9 milliards de dollars, contre un déficit de 878 millions de dollars en 1960. Le plus grand déficit a été de 123 milliards de dollars, en 2012, et le plus grand excédent de 587 millions de dollars, en 1976. La balance commerciale de l'Inde est déficitaire chaque année depuis 1994.
En 2025, le déficit commercial de l'Inde était le plus élevé de 44 pays situés en Asie, devant les Philippines (déficit de 66,7 milliards de dollars). De 2016 à 2025, les soldes commerciaux de l'Inde ont totalisé un déficit de 670 milliards de dollars, contre un déficit de 697 milliards de dollars de 2006 à 2015. En 2025, les transactions courantes de l'Inde affichaient un déficit de 0,5 % du PIB.
Commerce de biens de l'Inde avec ses 10 principaux partenaires commerciaux, selon l'Inde, 2025
| Pays | Exportations vers | Importations depuis | Solde | |
|---|---|---|---|---|
 Chine |
18,1 Md $US | 125 Md $US | −107 Md $US | vs Chine |
 États-Unis |
92,5 Md $US | 49,6 Md $US | +42,9 Md $US | vs USA |
 EAU |
38,7 Md $US | 67,2 Md $US | −28,4 Md $US | vs EAU |
 Russie |
4,48 Md $US | 59,1 Md $US | −54,6 Md $US | vs Russie |
 Arabie saoudite |
10,8 Md $US | 30,5 Md $US | −19,7 Md $US | vs Arabie saoudite |
 Singapour |
10,7 Md $US | 23,7 Md $US | −13,0 Md $US | |
 Allemagne |
11,4 Md $US | 19,1 Md $US | −7,78 Md $US | vs Allemagne |
 Irak |
3,35 Md $US | 26,7 Md $US | −23,3 Md $US | |
 Corée du Sud |
6,01 Md $US | 21,1 Md $US | −15,1 Md $US | vs Corée du Sud |
 Japon |
6,12 Md $US | 20,9 Md $US | −14,8 Md $US | vs Japon |
Balance commerciale de l'Inde : excédent (+) ou déficit (−)
| Biens et services, $ US, 2025 | −68,9 Md $US |
|---|---|
| % du PIB, 2025 | −1,7 % |
| Années d'excédent, 2000–2025 | 0 |
| Biens, $ US, 2025 | −313 Md $US |
| Services, $ US, 2025 | +210 Md $US |
| Premier excédent en biens, 2025 | États-Unis +42,9 Md $US |
| Premier déficit en biens, 2025 | Chine −107 Md $US |
Comparer la balance commerciale de l'Inde avec celle d'autres pays
Sources :
- TradeMap (2025, mis à jour en octobre 2026)
- Banque mondiale | Économie et croissance (1960–2025, mis à jour en octobre 2026)
Creative Commons Attribution (CC BY) : vous pouvez copier, partager, adapter et réutiliser ce contenu, y compris à des fins commerciales, à condition de citer statistics.wiki et d’indiquer les modifications apportées. Les sources citées ci-dessus peuvent avoir leurs propres conditions de licence.