
Balance commerciale de la Turquie par année ($ US) : excédent (+) ou déficit (−), 1960–2025
| Année | $ US | ||
|---|---|---|---|
| Biens et services | Biens | Services | |
| 2025 | −3 755 785 561 $ US | −69 858 000 000 $ US | 63 503 000 000 $ US |
| 2024 | 7 307 197 101 $ US | −55 987 000 000 $ US | 61 369 000 000 $ US |
| 2023 | −21 181 731 331 $ US | −86 279 000 000 $ US | 55 674 000 000 $ US |
| 2022 | −33 486 302 440 $ US | −89 585 000 000 $ US | 52 488 000 000 $ US |
| 2021 | 4 185 993 617 $ US | −29 319 000 000 $ US | 32 838 000 000 $ US |
| 2020 | −21 347 440 639 $ US | −37 876 000 000 $ US | 15 297 000 000 $ US |
| 2019 | 27 009 801 864 $ US | −16 782 000 000 $ US | 42 767 000 000 $ US |
| 2018 | 4 971 181 455 $ US | −40 731 000 000 $ US | 36 416 000 000 $ US |
| 2017 | −26 405 711 552 $ US | −58 575 000 000 $ US | 31 631 000 000 $ US |
| 2016 | −13 983 412 331 $ US | −39 923 000 000 $ US | 25 380 000 000 $ US |
| 2015 | −11 366 572 353 $ US | −49 007 000 000 $ US | 35 941 000 000 $ US |
| 2014 | −25 180 591 325 $ US | −66 574 000 000 $ US | 41 147 000 000 $ US |
| 2013 | −41 005 981 821 $ US | −81 885 000 000 $ US | 39 899 000 000 $ US |
| 2012 | −30 066 833 315 $ US | −65 367 000 000 $ US | 28 708 000 000 $ US |
| 2011 | −56 314 976 402 $ US | −89 160 000 000 $ US | 20 288 000 000 $ US |
| 2010 | −29 450 676 482 $ US | −56 325 000 000 $ US | 16 745 000 000 $ US |
| 2009 | 3 116 333 325 $ US | −24 762 000 000 $ US | 18 726 000 000 $ US |
| 2008 | −22 630 468 482 $ US | −52 917 000 000 $ US | 18 908 000 000 $ US |
| 2007 | −25 026 651 296 $ US | −46 831 000 000 $ US | 14 092 000 000 $ US |
| 2006 | −20 116 184 782 $ US | −40 894 000 000 $ US | 13 904 000 000 $ US |
| 2005 | −10 528 378 745 $ US | −32 936 000 000 $ US | 15 872 000 000 $ US |
| 2004 | −5 268 792 743 $ US | −22 438 000 000 $ US | 12 732 000 000 $ US |
| 2003 | 66 756 414 $ US | −13 411 000 000 $ US | 10 394 000 000 $ US |
| 2002 | 5 845 228 386 $ US | −6 404 000 000 $ US | 7 899 000 000 $ US |
| 2001 | 9 400 731 322 $ US | −3 282 000 000 $ US | 9 055 000 000 $ US |
| 2000 | −6 890 257 814 $ US | −21 959 000 000 $ US | 11 277 000 000 $ US |
| 1999 | −12 805 916 $ US | −9 667 000 000 $ US | 7 398 000 000 $ US |
| 1998 | 2 572 582 501 $ US | −13 927 000 000 $ US | 13 407 000 000 $ US |
| 1997 | 308 677 444 $ US | −14 963 000 000 $ US | 10 827 000 000 $ US |
| 1996 | −1 330 688 533 $ US | −10 189 000 000 $ US | 6 582 000 000 $ US |
| 1995 | 1 537 801 287 $ US | −13 114 000 000 $ US | 9 582 000 000 $ US |
| 1994 | 1 278 297 139 $ US | −4 134 000 000 $ US | 7 019 000 000 $ US |
| 1993 | −10 228 639 053 $ US | −14 044 000 000 $ US | 6 704 000 000 $ US |
| 1992 | −4 698 195 576 $ US | −8 051 000 000 $ US | 5 782 000 000 $ US |
| 1991 | −4 219 534 995 $ US | −7 280 000 000 $ US | 5 154 000 000 $ US |
| 1990 | −6 346 799 540 $ US | −9 427 000 000 $ US | 4 945 000 000 $ US |
| 1989 | −1 690 292 177 $ US | −4 111 000 000 $ US | 3 949 000 000 $ US |
| 1988 | 1 000 632 911 $ US | −1 707 000 000 $ US | 3 727 000 000 $ US |
| 1987 | −1 897 782 964 $ US | −3 162 000 000 $ US | 2 118 000 000 $ US |
| 1986 | −2 110 962 963 $ US | −2 997 000 000 $ US | 1 569 000 000 $ US |
| 1985 | −2 087 931 034 $ US | −2 907 000 000 $ US | 1 531 000 000 $ US |
| 1984 | −2 437 602 180 $ US | −2 848 000 000 $ US | 924 000 000 $ US |
| 1983 | −2 524 444 444 $ US | −2 990 000 000 $ US | 773 000 000 $ US |
| 1982 | −2 029 447 853 $ US | −2 628 000 000 $ US | 887 000 000 $ US |
| 1981 | −3 322 522 523 $ US | −3 864 000 000 $ US | 796 000 000 $ US |
| 1980 | −4 656 578 947 $ US | −4 603 000 000 $ US | 142 000 000 $ US |
| 1979 | −2 387 096 774 $ US | −2 554 000 000 $ US | 307 000 000 $ US |
| 1978 | −2 070 833 333 $ US | −2 081 000 000 $ US | 157 000 000 $ US |
| 1977 | −4 044 444 444 $ US | −3 753 000 000 $ US | −153 000 000 $ US |
| 1976 | −2 987 500 000 $ US | −2 912 000 000 $ US | 63 000 000 $ US |
| 1975 | −3 135 714 286 $ US | −3 101 000 000 $ US | 180 000 000 $ US |
| 1974 | −1 964 285 714 $ US | −2 057 000 000 $ US | 183 000 000 $ US |
| 1973 | −535 714 286 $ US | - | - |
| 1972 | −521 428 571 $ US | - | - |
| 1971 | −473 333 333 $ US | - | - |
| 1970 | −345 454 545 $ US | - | - |
| 1969 | −222 222 222 $ US | - | - |
| 1968 | −244 444 444 $ US | - | - |
| 1967 | −133 333 333 $ US | - | - |
| 1966 | −222 222 222 $ US | - | - |
| 1965 | −100 000 000 $ US | - | - |
| 1964 | −111 111 111 $ US | - | - |
| 1963 | −288 888 889 $ US | - | - |
| 1962 | −211 111 111 $ US | - | - |
| 1961 | −133 333 333 $ US | - | - |
| 1960 | −122 222 222 $ US | - | - |
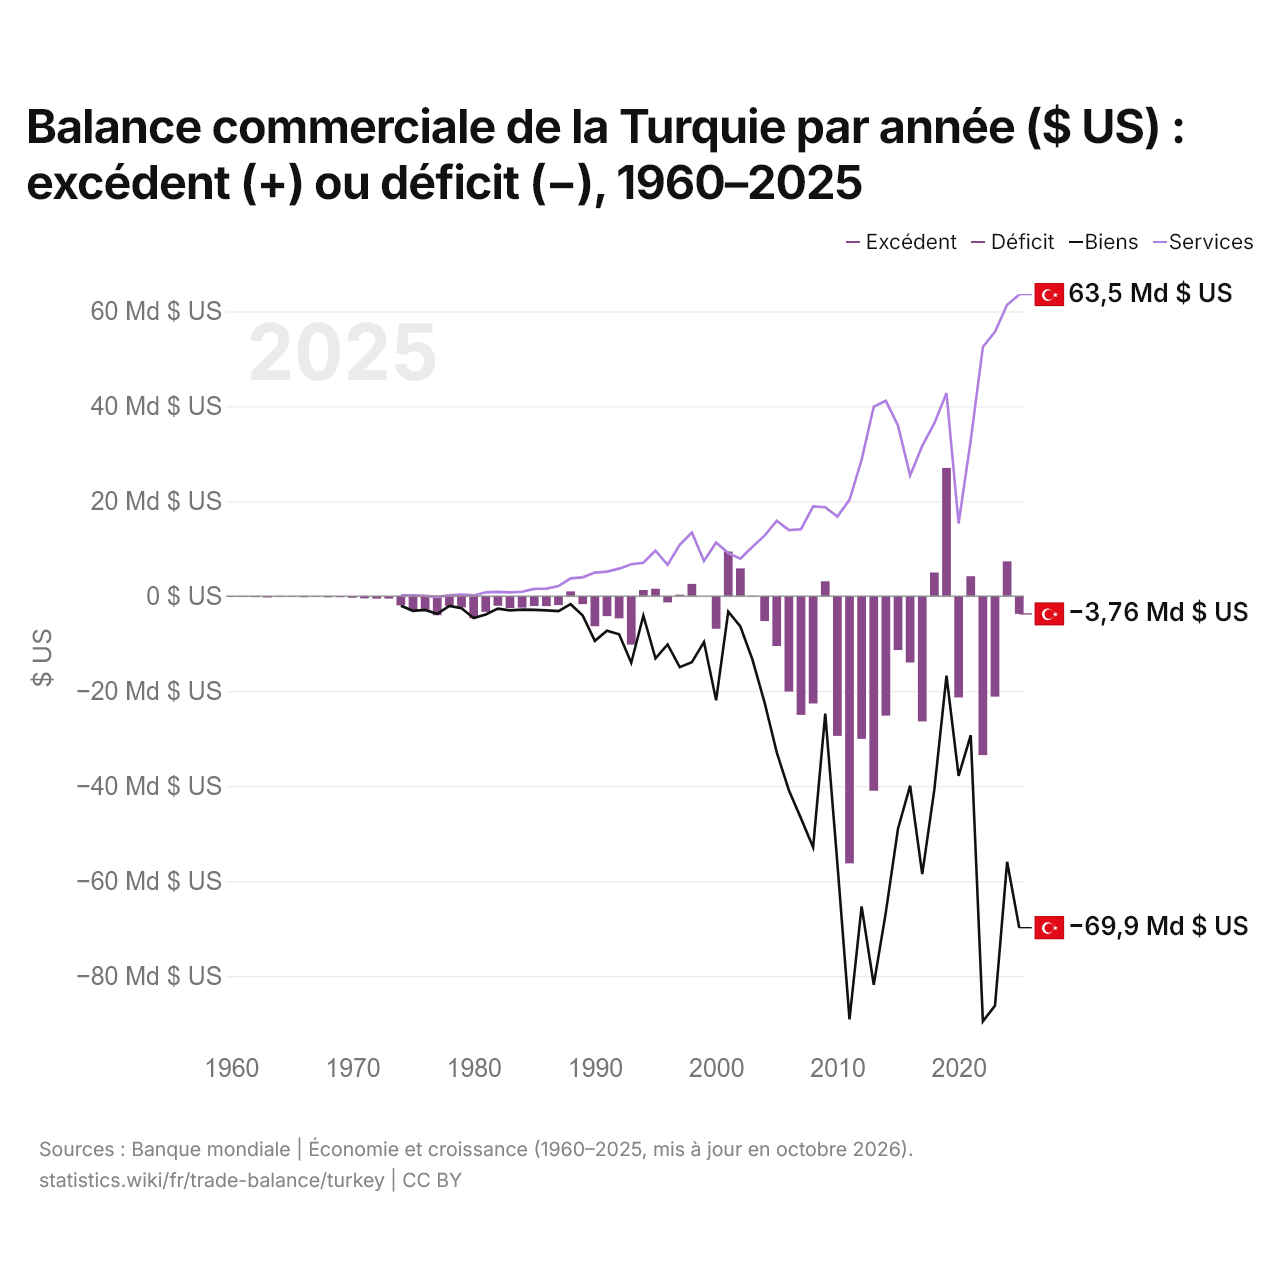
En 2025, la balance commerciale de la Turquie affichait un déficit de 3,76 milliards de dollars, contre un déficit de 122 millions de dollars en 1960. Le plus grand déficit a été de 56,3 milliards de dollars, en 2011, et le plus grand excédent de 27 milliards de dollars, en 2019.
En 2025, le solde commercial de la Turquie était le 28e plus élevé de 44 pays situés en Asie, où les soldes allaient d'un déficit de 68,9 milliards de dollars en Inde à un excédent de 816 milliards de dollars en Chine. De 2016 à 2025, les soldes commerciaux de la Turquie ont totalisé un déficit de 76,7 milliards de dollars, contre un déficit de 258 milliards de dollars de 2006 à 2015. En 2025, les transactions courantes de la Turquie affichaient un déficit de 1,9 % du PIB.
Commerce de biens de la Turquie avec ses 10 principaux partenaires commerciaux, selon la Turquie, 2025
| Pays | Exportations vers | Importations depuis | Solde | |
|---|---|---|---|---|
 Chine |
3,28 Md $US | 49,6 Md $US | −46,3 Md $US | vs Chine |
 Allemagne |
22,2 Md $US | 30,1 Md $US | −7,94 Md $US | vs Allemagne |
 Russie |
6,72 Md $US | 42,4 Md $US | −35,7 Md $US | vs Russie |
 États-Unis |
16,3 Md $US | 18,1 Md $US | −1,75 Md $US | vs USA |
 Italie |
13,2 Md $US | 15,7 Md $US | −2,52 Md $US | vs Italie |
 France |
11,2 Md $US | 12,9 Md $US | −1,66 Md $US | vs France |
 Royaume-Uni |
16,8 Md $US | 7,26 Md $US | +9,52 Md $US | |
 Espagne |
10,4 Md $US | 10,2 Md $US | +241 M $US | vs Espagne |
 EAU |
9,28 Md $US | 9,67 Md $US | −393 M $US | |
 Suisse |
2,24 Md $US | 15,8 Md $US | −13,5 Md $US | vs Suisse |
Balance commerciale de la Turquie : excédent (+) ou déficit (−)
Comparer la balance commerciale de la Turquie avec celle d'autres pays
Sources :
- TradeMap (2025, mis à jour en octobre 2026)
- Banque mondiale | Économie et croissance (1960–2025, mis à jour en octobre 2026)
Creative Commons Attribution (CC BY) : vous pouvez copier, partager, adapter et réutiliser ce contenu, y compris à des fins commerciales, à condition de citer statistics.wiki et d’indiquer les modifications apportées. Les sources citées ci-dessus peuvent avoir leurs propres conditions de licence.