
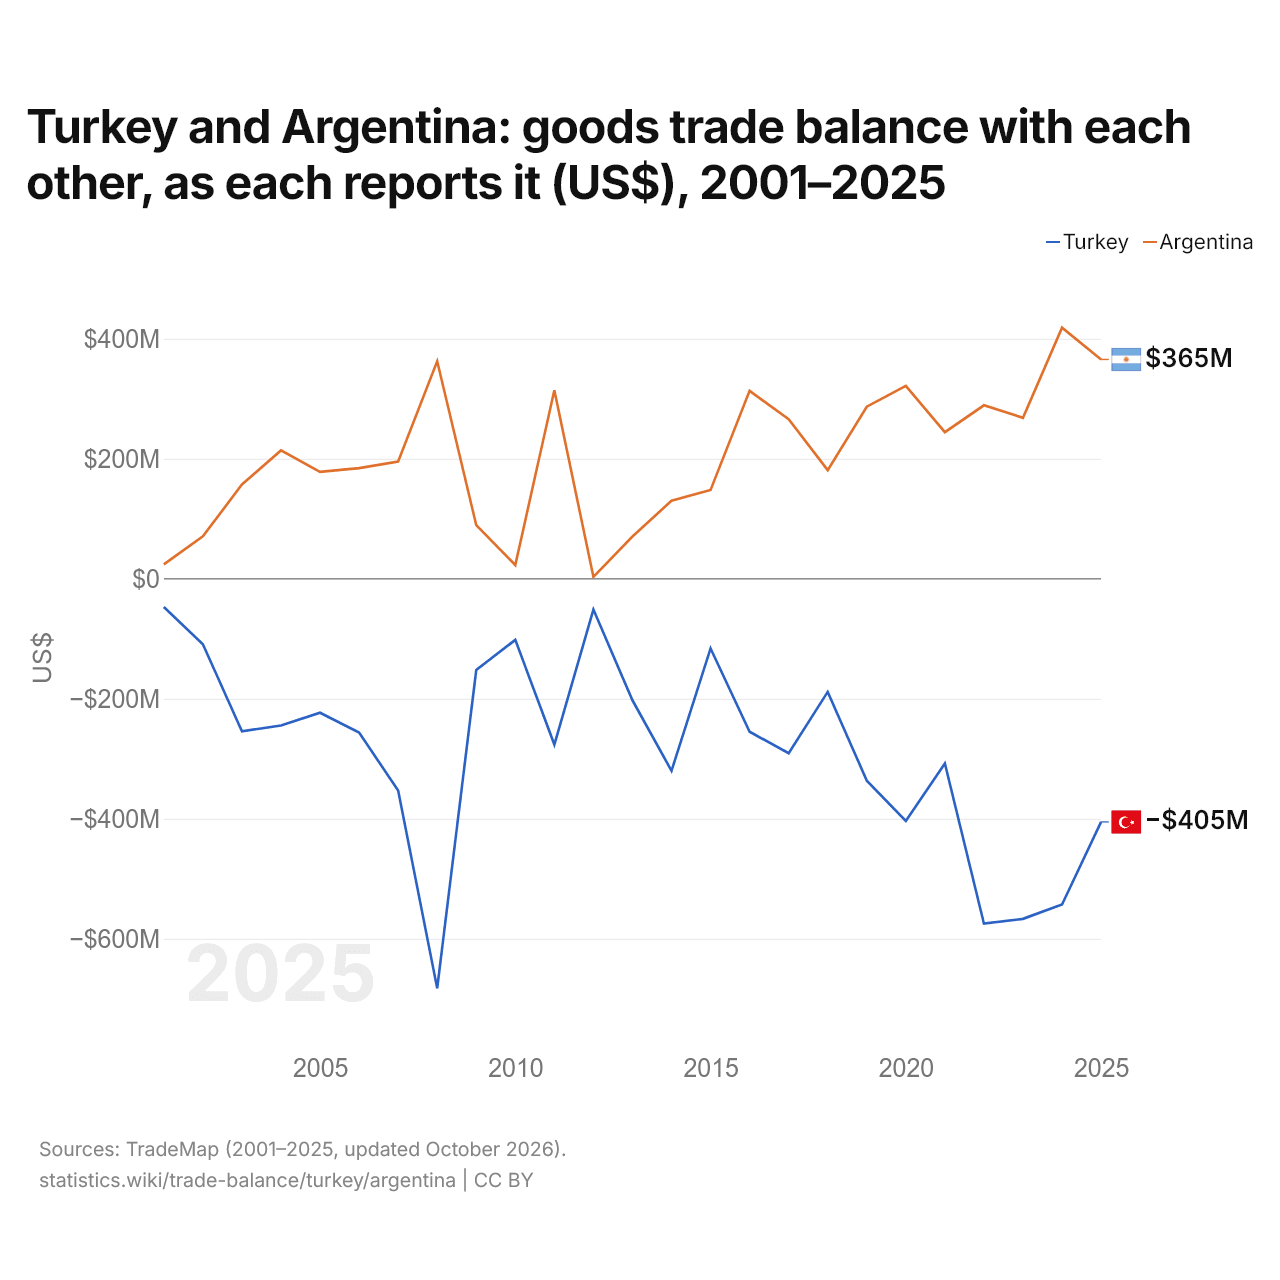
La Turquie et l'Argentine : solde de leur commerce de biens bilatéral, selon chacun ($ US), 2001–2025
| Année | $ US | |
|---|---|---|
| Turquie | Argentine | |
| 2025 | −405 392 000 $ US | 365 457 000 $ US |
| 2024 | −542 970 000 $ US | 418 408 000 $ US |
| 2023 | −566 976 000 $ US | 268 184 000 $ US |
| 2022 | −574 900 000 $ US | 289 074 000 $ US |
| 2021 | −307 892 000 $ US | 244 320 000 $ US |
| 2020 | −403 683 000 $ US | 321 485 000 $ US |
| 2019 | −336 535 000 $ US | 286 763 000 $ US |
| 2018 | −188 624 000 $ US | 180 910 000 $ US |
| 2017 | −290 984 000 $ US | 265 962 000 $ US |
| 2016 | −255 094 000 $ US | 313 125 000 $ US |
| 2015 | −116 188 000 $ US | 147 881 000 $ US |
| 2014 | −320 181 000 $ US | 130 006 000 $ US |
| 2013 | −202 627 000 $ US | 70 237 000 $ US |
| 2012 | −51 412 000 $ US | 3 055 000 $ US |
| 2011 | −276 470 000 $ US | 314 155 000 $ US |
| 2010 | −101 912 000 $ US | 22 791 000 $ US |
| 2009 | −152 087 000 $ US | 89 381 000 $ US |
| 2008 | −682 712 000 $ US | 362 474 000 $ US |
| 2007 | −353 010 000 $ US | 195 401 000 $ US |
| 2006 | −256 334 000 $ US | 184 454 000 $ US |
| 2005 | −223 470 000 $ US | 178 093 000 $ US |
| 2004 | −244 760 000 $ US | 213 834 000 $ US |
| 2003 | −254 237 000 $ US | 156 977 000 $ US |
| 2002 | −109 273 000 $ US | 70 567 000 $ US |
| 2001 | −47 249 000 $ US | 23 999 000 $ US |
En 2025, selon la Turquie, son commerce de biens avec l'Argentine affichait un déficit de 405 millions de dollars ; selon l'Argentine, son commerce de biens avec la Turquie affichait un excédent de 365 millions de dollars. En 2001, les chiffres étaient un déficit de 47,2 millions de dollars pour la Turquie et un excédent de 24 millions de dollars pour l'Argentine.
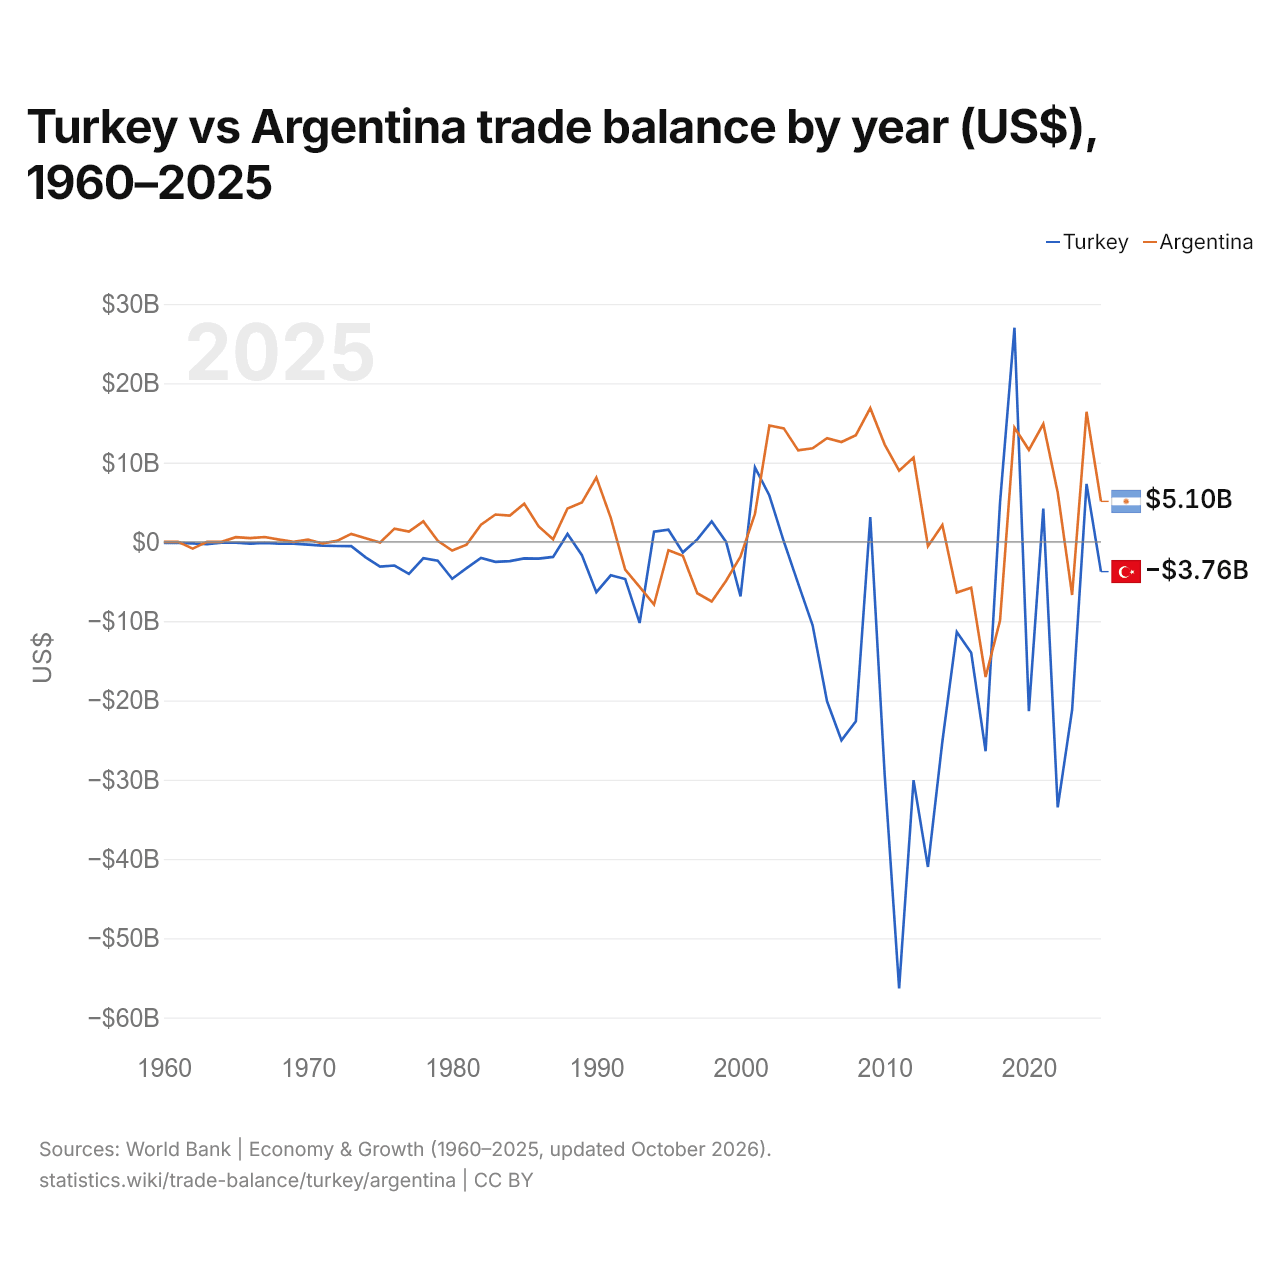
Turquie vs Argentine : balance commerciale par année ($ US), 1960–2025
| Année | $ US | |
|---|---|---|
 Turquie |
 Argentine |
|
| 2025 | −3 755 785 561 $ US | 5 100 613 800 $ US |
| 2024 | 7 307 197 101 $ US | 16 404 309 065 $ US |
| 2023 | −21 181 731 331 $ US | −6 704 568 723 $ US |
| 2022 | −33 486 302 440 $ US | 6 233 148 859 $ US |
| 2021 | 4 185 993 617 $ US | 14 863 213 107 $ US |
| 2020 | −21 347 440 639 $ US | 11 599 718 810 $ US |
| 2019 | 27 009 801 864 $ US | 14 413 857 778 $ US |
| 2018 | 4 971 181 455 $ US | −9 914 710 860 $ US |
| 2017 | −26 405 711 552 $ US | −17 049 937 664 $ US |
| 2016 | −13 983 412 331 $ US | −5 796 649 660 $ US |
| 2015 | −11 366 572 353 $ US | −6 393 090 843 $ US |
| 2014 | −25 180 591 325 $ US | 2 127 192 191 $ US |
| 2013 | −41 005 981 821 $ US | −549 718 918 $ US |
| 2012 | −30 066 833 315 $ US | 10 642 160 447 $ US |
| 2011 | −56 314 976 402 $ US | 8 971 671 281 $ US |
| 2010 | −29 450 676 482 $ US | 12 270 934 023 $ US |
| 2009 | 3 116 333 325 $ US | 16 864 736 859 $ US |
| 2008 | −22 630 468 482 $ US | 13 446 803 975 $ US |
| 2007 | −25 026 651 296 $ US | 12 594 785 133 $ US |
| 2006 | −20 116 184 782 $ US | 13 069 507 212 $ US |
| 2005 | −10 528 378 745 $ US | 11 805 942 344 $ US |
| 2004 | −5 268 792 743 $ US | 11 530 324 282 $ US |
| 2003 | 66 756 414 $ US | 14 311 606 659 $ US |
| 2002 | 5 845 228 386 $ US | 14 670 786 469 $ US |
| 2001 | 9 400 731 322 $ US | 3 508 536 600 $ US |
| 2000 | −6 890 257 814 $ US | −1 846 455 600 $ US |
| 1999 | −12 805 916 $ US | −4 900 400 000 $ US |
| 1998 | 2 572 582 501 $ US | −7 530 100 000 $ US |
| 1997 | 308 677 444 $ US | −6 485 300 000 $ US |
| 1996 | −1 330 688 533 $ US | −1 767 000 000 $ US |
| 1995 | 1 537 801 287 $ US | −1 059 485 000 $ US |
| 1994 | 1 278 297 139 $ US | −7 914 860 000 $ US |
| 1993 | −10 228 639 053 $ US | −5 692 332 332 $ US |
| 1992 | −4 698 195 576 $ US | −3 510 854 173 $ US |
| 1991 | −4 219 534 995 $ US | 3 029 889 879 $ US |
| 1990 | −6 346 799 540 $ US | 8 096 982 795 $ US |
| 1989 | −1 690 292 177 $ US | 4 964 855 541 $ US |
| 1988 | 1 000 632 911 $ US | 4 212 460 577 $ US |
| 1987 | −1 897 782 964 $ US | 323 648 995 $ US |
| 1986 | −2 110 962 963 $ US | 1 945 851 942 $ US |
| 1985 | −2 087 931 034 $ US | 4 815 481 324 $ US |
| 1984 | −2 437 602 180 $ US | 3 312 681 836 $ US |
| 1983 | −2 524 444 444 $ US | 3 447 293 430 $ US |
| 1982 | −2 029 447 853 $ US | 2 166 280 922 $ US |
| 1981 | −3 322 522 523 $ US | −354 736 981 $ US |
| 1980 | −4 656 578 947 $ US | −1 094 188 525 $ US |
| 1979 | −2 387 096 774 $ US | 125 448 026 $ US |
| 1978 | −2 070 833 333 $ US | 2 576 185 988 $ US |
| 1977 | −4 044 444 444 $ US | 1 300 000 008 $ US |
| 1976 | −2 987 500 000 $ US | 1 665 000 247 $ US |
| 1975 | −3 135 714 286 $ US | −81 081 003 $ US |
| 1974 | −1 964 285 714 $ US | 444 444 350 $ US |
| 1973 | −535 714 286 $ US | 1 000 000 034 $ US |
| 1972 | −521 428 571 $ US | 125 000 068 $ US |
| 1971 | −473 333 333 $ US | −199 999 955 $ US |
| 1970 | −345 454 545 $ US | 273 421 120 $ US |
| 1969 | −222 222 222 $ US | 0 $ US |
| 1968 | −244 444 444 $ US | 285 714 230 $ US |
| 1967 | −133 333 333 $ US | 606 060 620 $ US |
| 1966 | −222 222 222 $ US | 476 190 459 $ US |
| 1965 | −100 000 000 $ US | 588 235 264 $ US |
| 1964 | −111 111 111 $ US | 392 $ US |
| 1963 | −288 888 889 $ US | 396 $ US |
| 1962 | −211 111 111 $ US | −860 375 152 $ US |
| 1961 | −133 333 333 $ US | 338 $ US |
| 1960 | −122 222 222 $ US | 338 $ US |
En 2025, la balance commerciale de la Turquie affichait un déficit de 3,76 milliards de dollars et celle de l'Argentine un excédent de 5,1 milliards de dollars. En 1960, la balance commerciale de la Turquie affichait un déficit de 122 millions de dollars et celle de l'Argentine un excédent de 338 dollars.
Sur les années de 1960 à 2025 que les deux pays ont communiquées, la balance commerciale de la Turquie a été excédentaire pendant 13 des 65 années, et celle de l'Argentine pendant 45. Les balances commerciales de la Turquie et de l'Argentine ont été déficitaires en même temps pendant 15 de ces années, la dernière fois en 2023.
Turquie vs Argentine : chiffres de la balance commerciale
|
Turquie
|
Argentine
|
|
|---|---|---|
| Biens et services, $ US | −3,76 Md $US (2025) | +5,10 Md $US (2025) |
| % du PIB | −0,2 % (2025) | +0,7 % (2025) |
| Années d'excédent depuis 2000 | 8 sur 26 | 19 sur 26 |
| Solde des biens entre les deux, chiffres propres | −405 M $US (2025) | +365 M $US (2025) |
| Premier excédent en biens avec | Irak (+10,4 Md $US, 2025) | Chili (+5,47 Md $US, 2025) |
| Premier déficit en biens avec | Chine (−46,3 Md $US, 2025) | Chine (−6,88 Md $US, 2025) |
Comparer la balance commerciale de 2 pays au choix
Sources :
- Banque mondiale | Économie et croissance (1960–2025, mis à jour en octobre 2026)
- TradeMap (2001–2025, mis à jour en octobre 2026)
Creative Commons Attribution (CC BY) : vous pouvez copier, partager, adapter et réutiliser ce contenu, y compris à des fins commerciales, à condition de citer statistics.wiki et d’indiquer les modifications apportées. Les sources citées ci-dessus peuvent avoir leurs propres conditions de licence.