
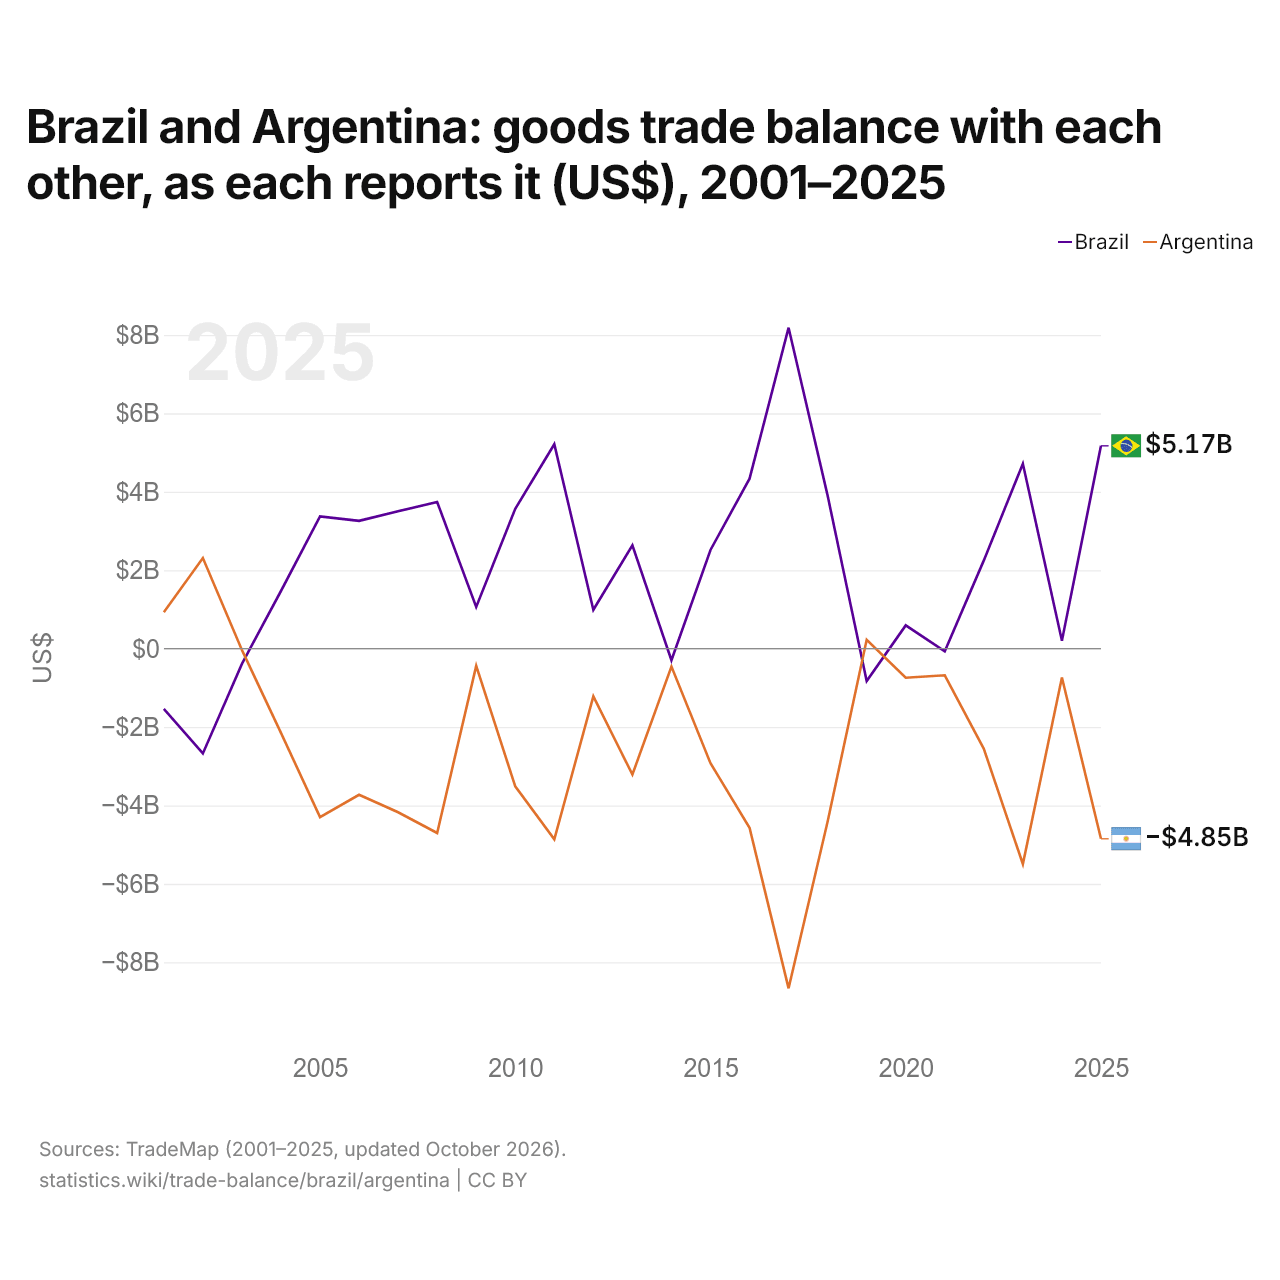
Le Brésil et l'Argentine : solde de leur commerce de biens bilatéral, selon chacun ($ US), 2001–2025
| Année | $ US | |
|---|---|---|
| Brésil | Argentine | |
| 2025 | 5 170 921 000 $ US | −4 850 857 000 $ US |
| 2024 | 200 576 000 $ US | −738 754 000 $ US |
| 2023 | 4 714 702 000 $ US | −5 494 787 000 $ US |
| 2022 | 2 248 708 000 $ US | −2 556 442 000 $ US |
| 2021 | −70 433 000 $ US | −680 793 000 $ US |
| 2020 | 591 642 000 $ US | −743 675 000 $ US |
| 2019 | −828 429 000 $ US | 226 242 000 $ US |
| 2018 | 3 900 154 000 $ US | −4 409 377 000 $ US |
| 2017 | 8 183 622 000 $ US | −8 664 346 000 $ US |
| 2016 | 4 333 176 000 $ US | −4 569 833 000 $ US |
| 2015 | 2 515 426 000 $ US | −2 924 476 000 $ US |
| 2014 | −297 031 000 $ US | −458 113 000 $ US |
| 2013 | 2 635 424 000 $ US | −3 212 485 000 $ US |
| 2012 | 988 805 000 $ US | −1 219 975 000 $ US |
| 2011 | 5 211 541 000 $ US | −4 863 930 000 $ US |
| 2010 | 3 565 998 000 $ US | −3 515 837 000 $ US |
| 2009 | 1 061 505 000 $ US | −439 811 000 $ US |
| 2008 | 3 739 417 000 $ US | −4 703 478 000 $ US |
| 2007 | 3 503 244 000 $ US | −4 174 210 000 $ US |
| 2006 | 3 259 006 000 $ US | −3 730 472 000 $ US |
| 2005 | 3 371 781 000 $ US | −4 297 034 000 $ US |
| 2004 | 1 468 121 000 $ US | −2 150 599 000 $ US |
| 2003 | −389 300 000 $ US | −36 344 000 $ US |
| 2002 | −2 675 358 000 $ US | 2 309 524 000 $ US |
| 2001 | −1 535 663 000 $ US | 927 869 000 $ US |
En 2025, selon le Brésil, son commerce de biens avec l'Argentine affichait un excédent de 5,17 milliards de dollars ; selon l'Argentine, son commerce de biens avec le Brésil affichait un déficit de 4,85 milliards de dollars. En 2001, les chiffres étaient un déficit de 1,54 milliard de dollars pour le Brésil et un excédent de 928 millions de dollars pour l'Argentine.
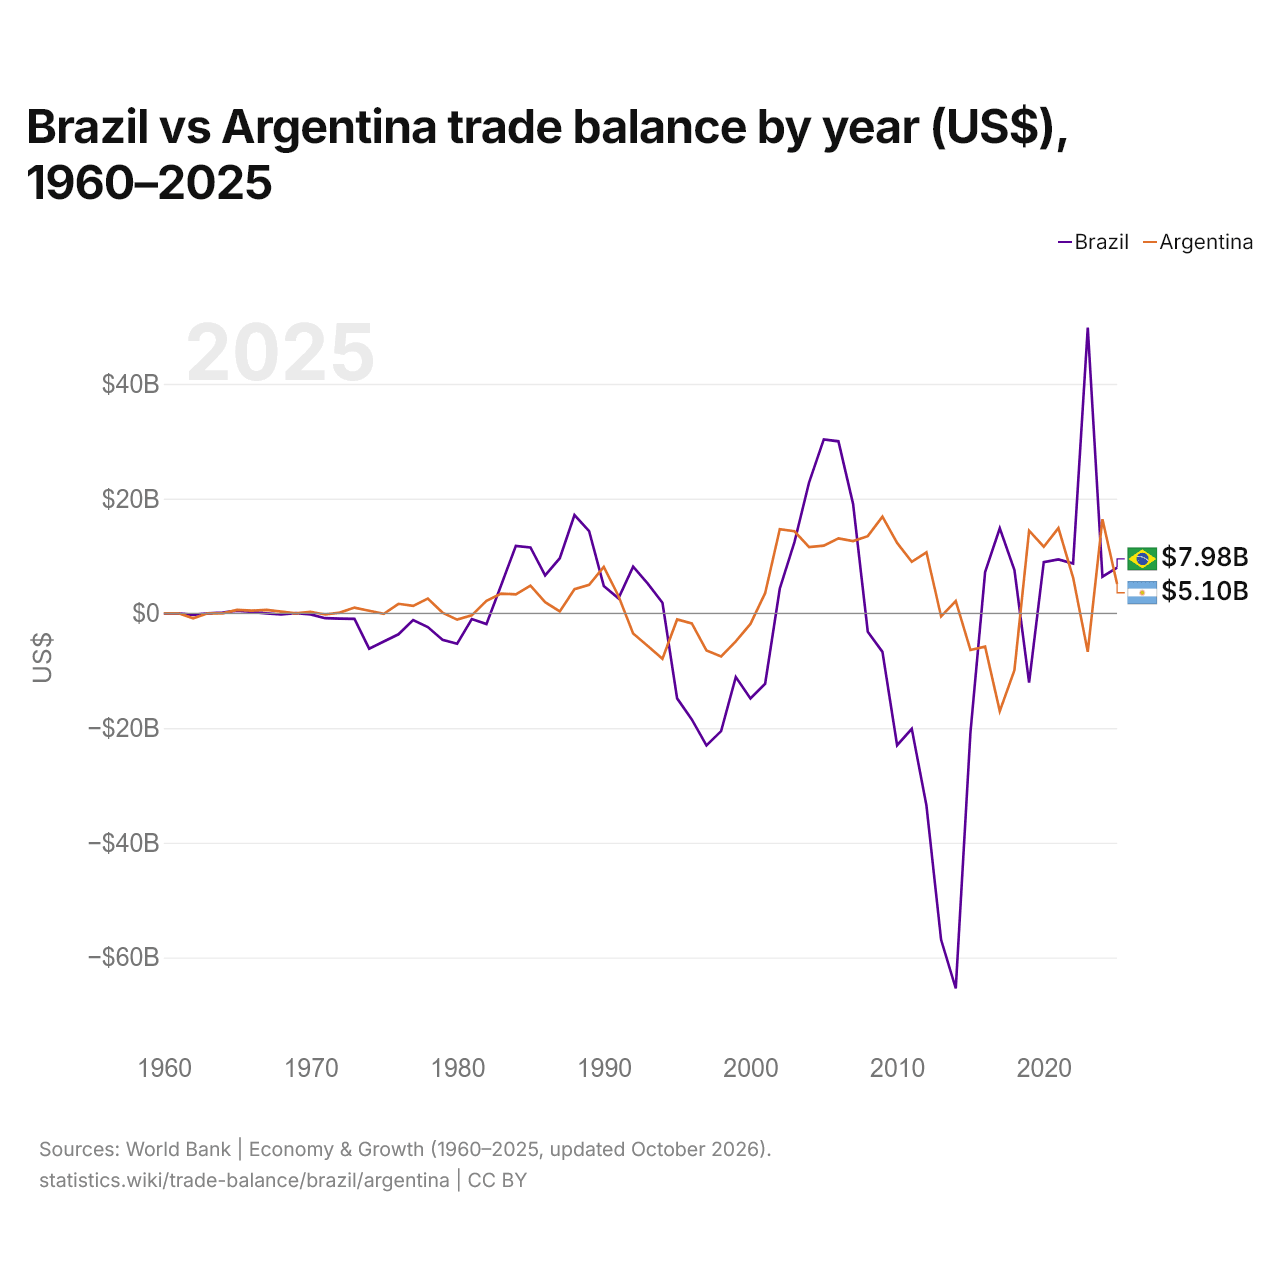
Brésil vs Argentine : balance commerciale par année ($ US), 1960–2025
| Année | $ US | |
|---|---|---|
 Brésil |
 Argentine |
|
| 2025 | 7 978 888 856 $ US | 5 100 613 800 $ US |
| 2024 | 6 396 477 783 $ US | 16 404 309 065 $ US |
| 2023 | 49 791 689 659 $ US | −6 704 568 723 $ US |
| 2022 | 8 695 119 065 $ US | 6 233 148 859 $ US |
| 2021 | 9 397 892 444 $ US | 14 863 213 107 $ US |
| 2020 | 8 930 824 788 $ US | 11 599 718 810 $ US |
| 2019 | −12 071 834 246 $ US | 14 413 857 778 $ US |
| 2018 | 7 548 801 626 $ US | −9 914 710 860 $ US |
| 2017 | 14 820 192 744 $ US | −17 049 937 664 $ US |
| 2016 | 7 176 956 033 $ US | −5 796 649 660 $ US |
| 2015 | −20 783 887 933 $ US | −6 393 090 843 $ US |
| 2014 | −65 368 099 307 $ US | 2 127 192 191 $ US |
| 2013 | −56 911 843 574 $ US | −549 718 918 $ US |
| 2012 | −33 507 264 618 $ US | 10 642 160 447 $ US |
| 2011 | −20 128 178 015 $ US | 8 971 671 281 $ US |
| 2010 | −22 994 190 062 $ US | 12 270 934 023 $ US |
| 2009 | −6 721 885 359 $ US | 16 864 736 859 $ US |
| 2008 | −3 214 805 207 $ US | 13 446 803 975 $ US |
| 2007 | 19 039 021 642 $ US | 12 594 785 133 $ US |
| 2006 | 29 982 705 221 $ US | 13 069 507 212 $ US |
| 2005 | 30 323 248 288 $ US | 11 805 942 344 $ US |
| 2004 | 22 844 658 798 $ US | 11 530 324 282 $ US |
| 2003 | 12 399 391 352 $ US | 14 311 606 659 $ US |
| 2002 | 4 296 672 537 $ US | 14 670 786 469 $ US |
| 2001 | −12 279 677 754 $ US | 3 508 536 600 $ US |
| 2000 | −14 837 154 502 $ US | −1 846 455 600 $ US |
| 1999 | −11 107 588 704 $ US | −4 900 400 000 $ US |
| 1998 | −20 535 451 010 $ US | −7 530 100 000 $ US |
| 1997 | −23 042 055 321 $ US | −6 485 300 000 $ US |
| 1996 | −18 498 238 583 $ US | −1 767 000 000 $ US |
| 1995 | −14 822 816 229 $ US | −1 059 485 000 $ US |
| 1994 | 1 846 111 837 $ US | −7 914 860 000 $ US |
| 1993 | 5 182 689 343 $ US | −5 692 332 332 $ US |
| 1992 | 8 149 820 789 $ US | −3 510 854 173 $ US |
| 1991 | 2 614 204 545 $ US | 3 029 889 879 $ US |
| 1990 | 4 769 166 667 $ US | 8 096 982 795 $ US |
| 1989 | 14 323 932 823 $ US | 4 964 855 541 $ US |
| 1988 | 17 141 241 475 $ US | 4 212 460 577 $ US |
| 1987 | 9 608 553 171 $ US | 323 648 995 $ US |
| 1986 | 6 601 570 908 $ US | 1 945 851 942 $ US |
| 1985 | 11 487 450 960 $ US | 4 815 481 324 $ US |
| 1984 | 11 753 827 696 $ US | 3 312 681 836 $ US |
| 1983 | 4 906 714 630 $ US | 3 447 293 430 $ US |
| 1982 | −1 872 613 598 $ US | 2 166 280 922 $ US |
| 1981 | −999 146 350 $ US | −354 736 981 $ US |
| 1980 | −5 295 341 312 $ US | −1 094 188 525 $ US |
| 1979 | −4 615 615 400 $ US | 125 448 026 $ US |
| 1978 | −2 387 152 106 $ US | 2 576 185 988 $ US |
| 1977 | −1 172 207 021 $ US | 1 300 000 008 $ US |
| 1976 | −3 659 545 985 $ US | 1 665 000 247 $ US |
| 1975 | −4 907 560 236 $ US | −81 081 003 $ US |
| 1974 | −6 172 123 572 $ US | 444 444 350 $ US |
| 1973 | −975 055 647 $ US | 1 000 000 034 $ US |
| 1972 | −927 784 676 $ US | 125 000 068 $ US |
| 1971 | −848 612 874 $ US | −199 999 955 $ US |
| 1970 | −177 912 553 $ US | 273 421 120 $ US |
| 1969 | 24 981 601 $ US | 0 $ US |
| 1968 | −206 594 912 $ US | 285 714 230 $ US |
| 1967 | 0 $ US | 606 060 620 $ US |
| 1966 | 225 450 250 $ US | 476 190 459 $ US |
| 1965 | 474 987 148 $ US | 588 235 264 $ US |
| 1964 | 150 139 739 $ US | 392 $ US |
| 1963 | −17 161 539 $ US | 396 $ US |
| 1962 | −263 069 676 $ US | −860 375 152 $ US |
| 1961 | −9 149 903 $ US | 338 $ US |
| 1960 | −8 829 343 $ US | 338 $ US |
En 2025, la balance commerciale du Brésil affichait un excédent de 7,98 milliards de dollars et celle de l'Argentine un excédent de 5,1 milliards de dollars ; l'excédent du Brésil était 1,6 fois plus grand. En 1960, la balance commerciale du Brésil affichait un déficit de 8,83 millions de dollars et celle de l'Argentine un excédent de 338 dollars.
Sur les années de 1960 à 2025 que les deux pays ont communiquées, la balance commerciale du Brésil a été excédentaire pendant 30 des 64 années, et celle de l'Argentine pendant 44. Les balances commerciales du Brésil et de l'Argentine ont été déficitaires en même temps pendant 13 de ces années, la dernière fois en 2015.
Brésil vs Argentine : chiffres de la balance commerciale
|
Brésil
|
Argentine
|
|
|---|---|---|
| Biens et services, $ US | +7,98 Md $US (2025) | +5,10 Md $US (2025) |
| % du PIB | +0,3 % (2025) | +0,7 % (2025) |
| Années d'excédent depuis 2000 | 15 sur 26 | 19 sur 26 |
| Solde des biens entre les deux, chiffres propres | +5,17 Md $US (2025) | −4,85 Md $US (2025) |
| Premier excédent en biens avec | Chine (+29,1 Md $US, 2025) | Chili (+5,47 Md $US, 2025) |
| Premier déficit en biens avec | États-Unis (−7,94 Md $US, 2025) | Chine (−6,88 Md $US, 2025) |
Comparer la balance commerciale de 2 pays au choix
Sources :
- Banque mondiale | Économie et croissance (1960–2025, mis à jour en octobre 2026)
- TradeMap (2001–2025, mis à jour en octobre 2026)
Creative Commons Attribution (CC BY) : vous pouvez copier, partager, adapter et réutiliser ce contenu, y compris à des fins commerciales, à condition de citer statistics.wiki et d’indiquer les modifications apportées. Les sources citées ci-dessus peuvent avoir leurs propres conditions de licence.