
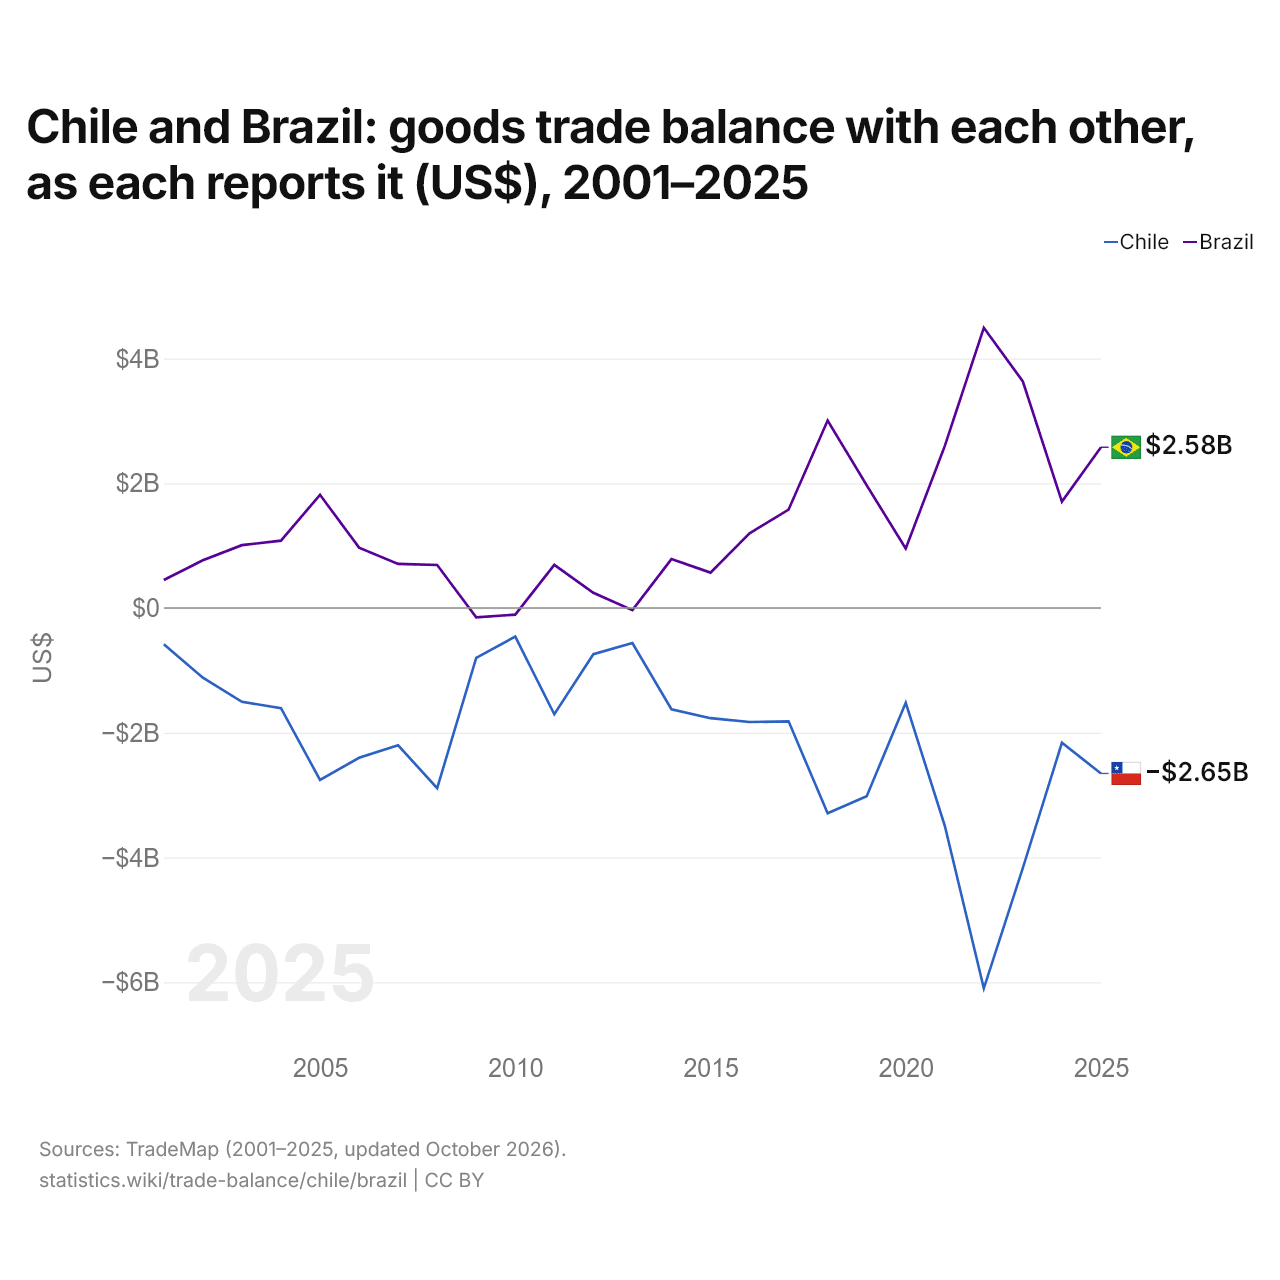
Le Chili et le Brésil : solde de leur commerce de biens bilatéral, selon chacun ($ US), 2001–2025
| Année | $ US | |
|---|---|---|
| Chili | Brésil | |
| 2025 | −2 652 001 000 $ US | 2 577 326 000 $ US |
| 2024 | −2 159 990 000 $ US | 1 705 069 000 $ US |
| 2023 | −4 166 023 000 $ US | 3 631 467 000 $ US |
| 2022 | −6 096 596 000 $ US | 4 494 135 000 $ US |
| 2021 | −3 489 961 000 $ US | 2 597 297 000 $ US |
| 2020 | −1 520 099 000 $ US | 954 289 000 $ US |
| 2019 | −3 016 718 000 $ US | 1 967 979 000 $ US |
| 2018 | −3 291 078 000 $ US | 3 007 304 000 $ US |
| 2017 | −1 816 507 000 $ US | 1 578 750 000 $ US |
| 2016 | −1 827 545 000 $ US | 1 198 611 000 $ US |
| 2015 | −1 766 200 000 $ US | 567 579 000 $ US |
| 2014 | −1 623 443 000 $ US | 784 763 000 $ US |
| 2013 | −561 068 000 $ US | −33 843 000 $ US |
| 2012 | −739 445 000 $ US | 243 801 000 $ US |
| 2011 | −1 703 314 000 $ US | 691 925 000 $ US |
| 2010 | −457 779 000 $ US | −106 646 000 $ US |
| 2009 | −799 377 000 $ US | −149 905 000 $ US |
| 2008 | −2 888 123 000 $ US | 689 358 000 $ US |
| 2007 | −2 200 583 000 $ US | 707 081 000 $ US |
| 2006 | −2 401 586 000 $ US | 967 759 000 $ US |
| 2005 | −2 755 582 000 $ US | 1 815 161 000 $ US |
| 2004 | −1 605 469 000 $ US | 1 079 630 000 $ US |
| 2003 | −1 503 381 000 $ US | 1 008 147 000 $ US |
| 2002 | −1 117 323 000 $ US | 764 753 000 $ US |
| 2001 | −581 239 000 $ US | 449 168 000 $ US |
En 2025, selon le Chili, son commerce de biens avec le Brésil affichait un déficit de 2,65 milliards de dollars ; selon le Brésil, son commerce de biens avec le Chili affichait un excédent de 2,58 milliards de dollars. En 2001, les chiffres étaient un déficit de 581 millions de dollars pour le Chili et un excédent de 449 millions de dollars pour le Brésil.
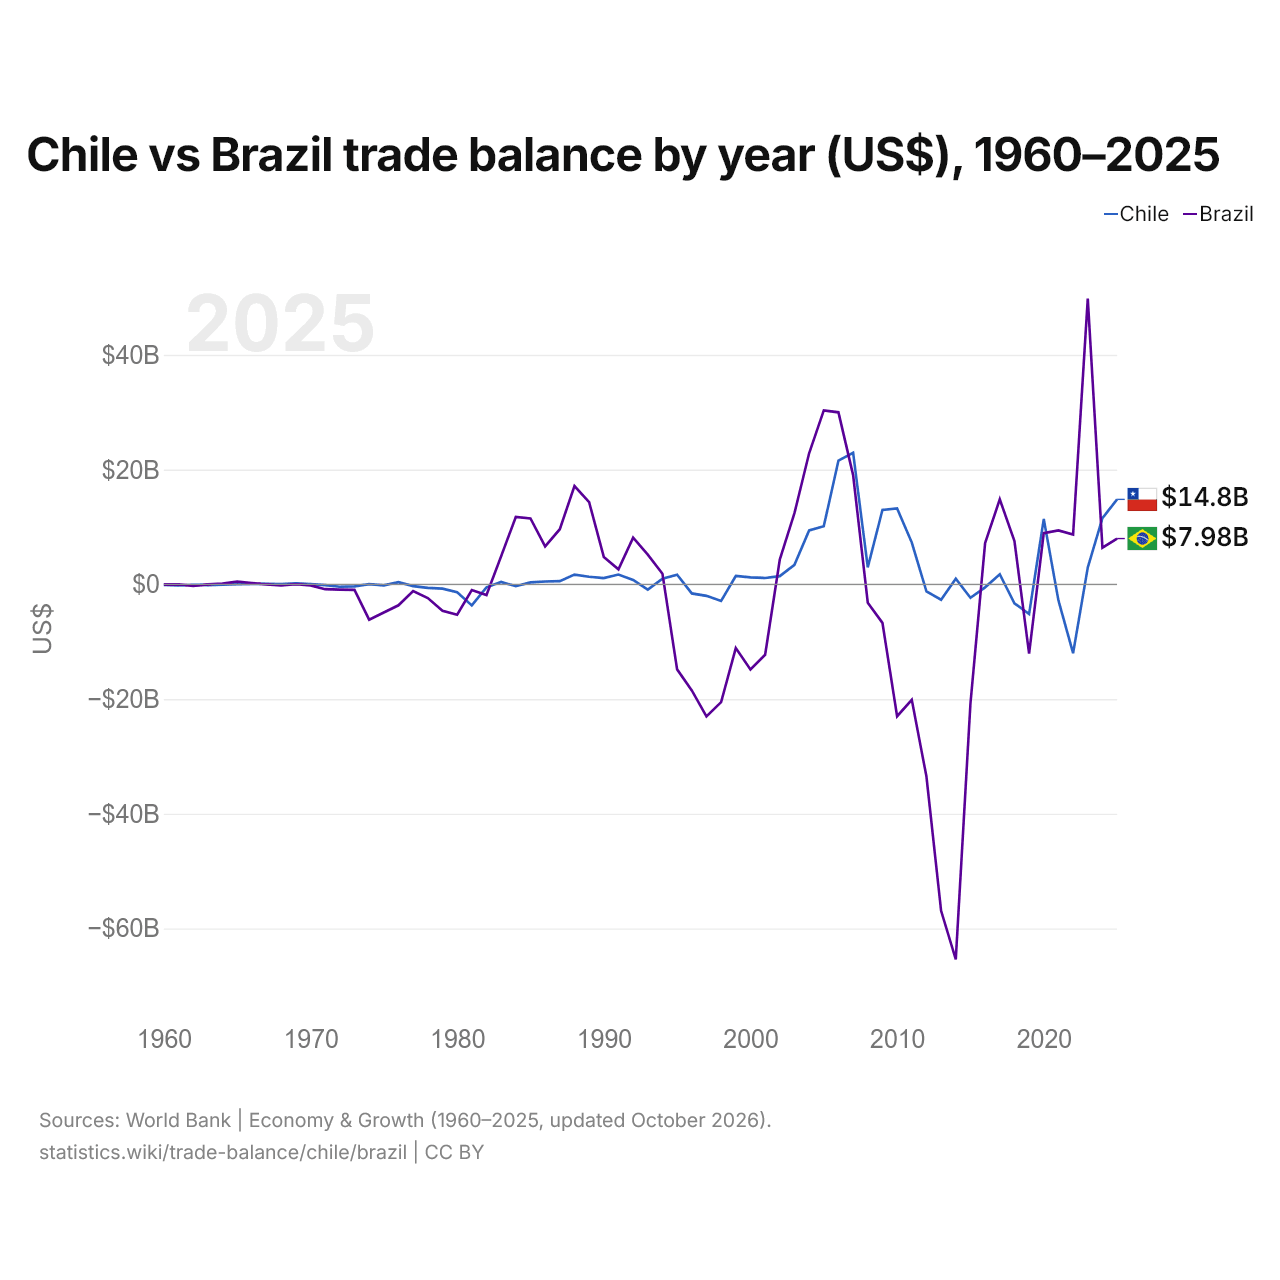
Chili vs Brésil : balance commerciale par année ($ US), 1960–2025
| Année | $ US | |
|---|---|---|
 Chili |
 Brésil |
|
| 2025 | 14 804 975 228 $ US | 7 978 888 856 $ US |
| 2024 | 11 545 176 279 $ US | 6 396 477 783 $ US |
| 2023 | 2 933 166 506 $ US | 49 791 689 659 $ US |
| 2022 | −12 014 002 658 $ US | 8 695 119 065 $ US |
| 2021 | −2 812 122 188 $ US | 9 397 892 444 $ US |
| 2020 | 11 375 796 052 $ US | 8 930 824 788 $ US |
| 2019 | −5 182 833 879 $ US | −12 071 834 246 $ US |
| 2018 | −3 310 530 298 $ US | 7 548 801 626 $ US |
| 2017 | 1 757 984 593 $ US | 14 820 192 744 $ US |
| 2016 | −527 476 210 $ US | 7 176 956 033 $ US |
| 2015 | −2 344 379 586 $ US | −20 783 887 933 $ US |
| 2014 | 968 625 055 $ US | −65 368 099 307 $ US |
| 2013 | −2 686 187 876 $ US | −56 911 843 574 $ US |
| 2012 | −1 241 559 881 $ US | −33 507 264 618 $ US |
| 2011 | 7 284 859 134 $ US | −20 128 178 015 $ US |
| 2010 | 13 219 086 595 $ US | −22 994 190 062 $ US |
| 2009 | 12 961 051 576 $ US | −6 721 885 359 $ US |
| 2008 | 2 965 553 776 $ US | −3 214 805 207 $ US |
| 2007 | 22 911 435 530 $ US | 19 039 021 642 $ US |
| 2006 | 21 568 421 478 $ US | 29 982 705 221 $ US |
| 2005 | 10 136 483 837 $ US | 30 323 248 288 $ US |
| 2004 | 9 394 522 805 $ US | 22 844 658 798 $ US |
| 2003 | 3 387 497 528 $ US | 12 399 391 352 $ US |
| 2002 | 1 426 773 699 $ US | 4 296 672 537 $ US |
| 2001 | 1 109 305 458 $ US | −12 279 677 754 $ US |
| 2000 | 1 202 974 079 $ US | −14 837 154 502 $ US |
| 1999 | 1 453 087 040 $ US | −11 107 588 704 $ US |
| 1998 | −2 909 838 412 $ US | −20 535 451 010 $ US |
| 1997 | −2 009 169 758 $ US | −23 042 055 321 $ US |
| 1996 | −1 587 287 186 $ US | −18 498 238 583 $ US |
| 1995 | 1 678 472 004 $ US | −14 822 816 229 $ US |
| 1994 | 975 504 071 $ US | 1 846 111 837 $ US |
| 1993 | −910 684 560 $ US | 5 182 689 343 $ US |
| 1992 | 767 144 020 $ US | 8 149 820 789 $ US |
| 1991 | 1 706 007 584 $ US | 2 614 204 545 $ US |
| 1990 | 1 074 813 125 $ US | 4 769 166 667 $ US |
| 1989 | 1 325 335 767 $ US | 14 323 932 823 $ US |
| 1988 | 1 690 789 705 $ US | 17 141 241 475 $ US |
| 1987 | 555 122 127 $ US | 9 608 553 171 $ US |
| 1986 | 488 799 123 $ US | 6 601 570 908 $ US |
| 1985 | 339 874 219 $ US | 11 487 450 960 $ US |
| 1984 | −326 526 915 $ US | 11 753 827 696 $ US |
| 1983 | 412 516 962 $ US | 4 906 714 630 $ US |
| 1982 | −515 371 499 $ US | −1 872 613 598 $ US |
| 1981 | −3 683 471 885 $ US | −999 146 350 $ US |
| 1980 | −1 387 218 822 $ US | −5 295 341 312 $ US |
| 1979 | −745 793 488 $ US | −4 615 615 400 $ US |
| 1978 | −613 837 751 $ US | −2 387 152 106 $ US |
| 1977 | −320 362 052 $ US | −1 172 207 021 $ US |
| 1976 | 375 782 332 $ US | −3 659 545 985 $ US |
| 1975 | −187 399 628 $ US | −4 907 560 236 $ US |
| 1974 | 37 116 935 $ US | −6 172 123 572 $ US |
| 1973 | −351 014 126 $ US | −975 055 647 $ US |
| 1972 | −426 238 589 $ US | −927 784 676 $ US |
| 1971 | −131 010 402 $ US | −848 612 874 $ US |
| 1970 | 35 341 639 $ US | −177 912 553 $ US |
| 1969 | 168 513 808 $ US | 24 981 601 $ US |
| 1968 | 43 189 791 $ US | −206 594 912 $ US |
| 1967 | 80 542 423 $ US | 0 $ US |
| 1966 | 67 017 398 $ US | 225 450 250 $ US |
| 1965 | 38 087 742 $ US | 474 987 148 $ US |
| 1964 | −58 309 926 $ US | 150 139 739 $ US |
| 1963 | −138 188 656 $ US | −17 161 539 $ US |
| 1962 | −81 469 754 $ US | −263 069 676 $ US |
| 1961 | −198 972 381 $ US | −9 149 903 $ US |
| 1960 | −114 140 000 $ US | −8 829 343 $ US |
En 2025, la balance commerciale du Chili affichait un excédent de 14,8 milliards de dollars et celle du Brésil un excédent de 7,98 milliards de dollars ; l'excédent du Chili était 1,9 fois plus grand. En 1960, la balance commerciale du Chili affichait un déficit de 114 millions de dollars et celle du Brésil un déficit de 8,83 millions de dollars.
Sur les années de 1960 à 2025 que les deux pays ont communiquées, la balance commerciale du Chili a été excédentaire pendant 37 des 65 années, et celle du Brésil pendant 31. Les balances commerciales du Chili et du Brésil ont été déficitaires en même temps pendant 21 de ces années, la dernière fois en 2019.
Chili vs Brésil : chiffres de la balance commerciale
|
Chili
|
Brésil
|
|
|---|---|---|
| Biens et services, $ US | +14,8 Md $US (2025) | +7,98 Md $US (2025) |
| % du PIB | +4,1 % (2025) | +0,3 % (2025) |
| Années d'excédent depuis 2000 | 18 sur 26 | 15 sur 26 |
| Solde des biens entre les deux, chiffres propres | −2,65 Md $US (2025) | +2,58 Md $US (2025) |
| Premier excédent en biens avec | Chine (+15,1 Md $US, 2025) | Chine (+29,1 Md $US, 2025) |
| Premier déficit en biens avec | Argentine (−5,55 Md $US, 2025) | États-Unis (−7,94 Md $US, 2025) |
Comparer la balance commerciale de 2 pays au choix
Sources :
- Banque mondiale | Économie et croissance (1960–2025, mis à jour en octobre 2026)
- TradeMap (2001–2025, mis à jour en octobre 2026)
Creative Commons Attribution (CC BY) : vous pouvez copier, partager, adapter et réutiliser ce contenu, y compris à des fins commerciales, à condition de citer statistics.wiki et d’indiquer les modifications apportées. Les sources citées ci-dessus peuvent avoir leurs propres conditions de licence.