
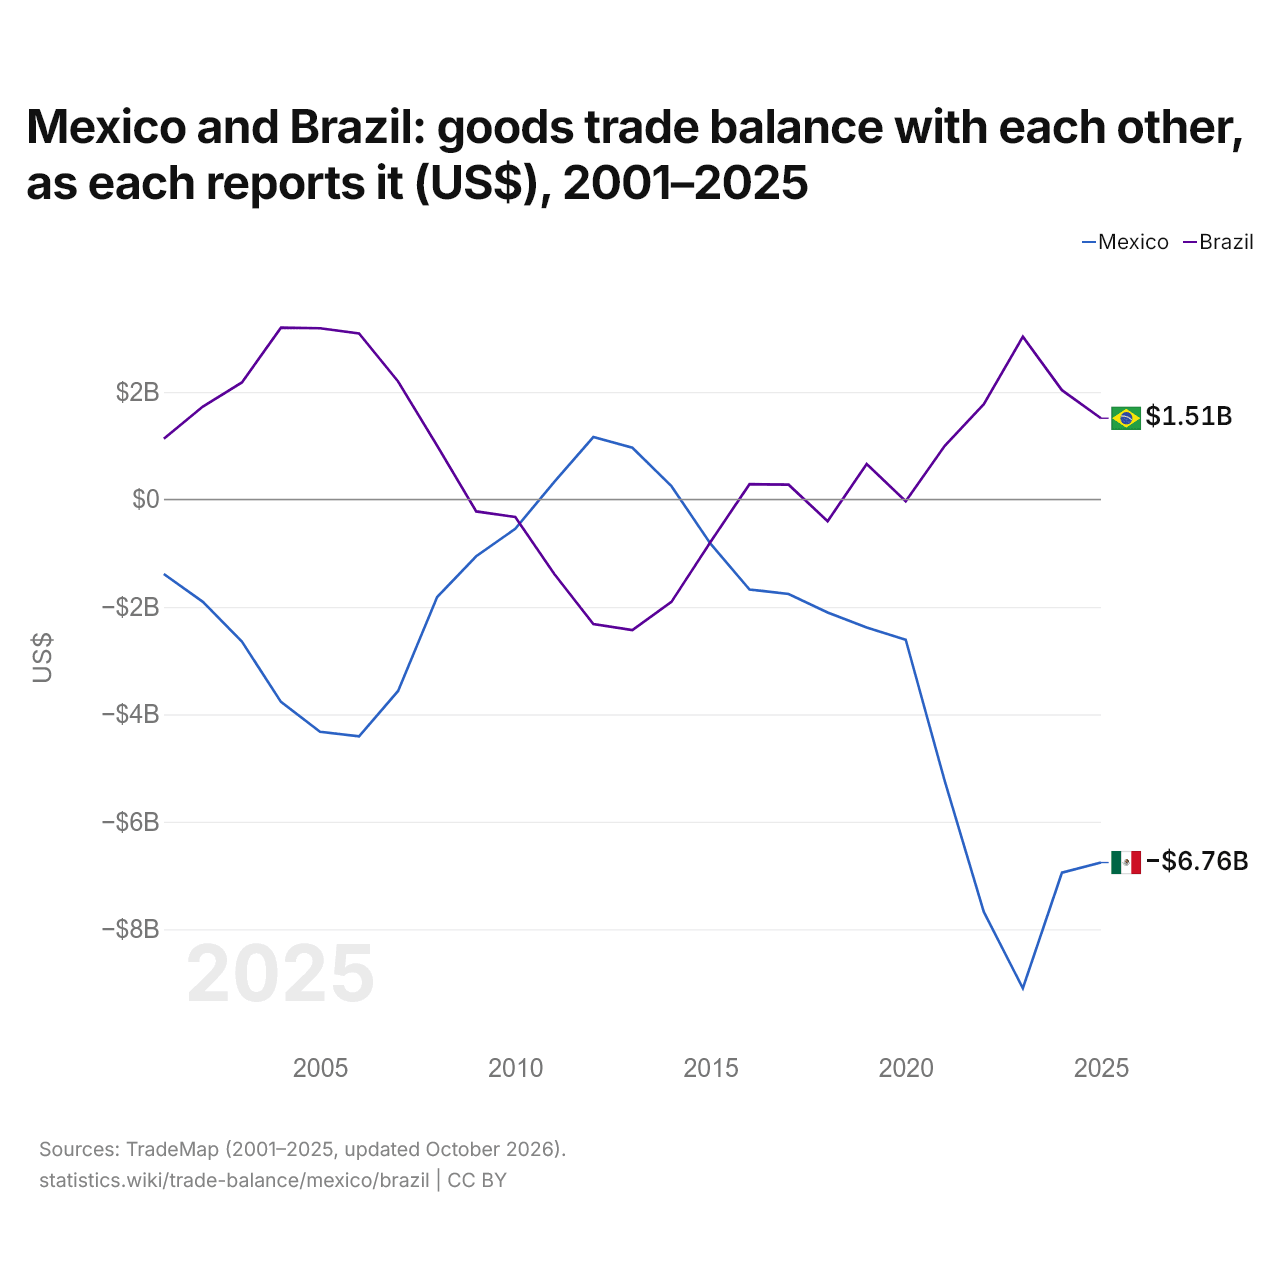
Le Mexique et le Brésil : solde de leur commerce de biens bilatéral, selon chacun ($ US), 2001–2025
| Année | $ US | |
|---|---|---|
| Mexique | Brésil | |
| 2025 | −6 759 051 000 $ US | 1 511 864 000 $ US |
| 2024 | −6 949 018 000 $ US | 2 034 756 000 $ US |
| 2023 | −9 100 370 000 $ US | 3 030 315 000 $ US |
| 2022 | −7 678 963 000 $ US | 1 771 830 000 $ US |
| 2021 | −5 245 459 000 $ US | 999 239 000 $ US |
| 2020 | −2 610 635 000 $ US | −32 973 000 $ US |
| 2019 | −2 385 444 000 $ US | 660 291 000 $ US |
| 2018 | −2 102 905 000 $ US | −404 200 000 $ US |
| 2017 | −1 759 071 000 $ US | 276 052 000 $ US |
| 2016 | −1 676 890 000 $ US | 285 256 000 $ US |
| 2015 | −823 293 000 $ US | −789 573 000 $ US |
| 2014 | 248 679 000 $ US | −1 906 852 000 $ US |
| 2013 | 962 320 000 $ US | −2 431 727 000 $ US |
| 2012 | 1 163 045 000 $ US | −2 319 680 000 $ US |
| 2011 | 329 324 000 $ US | −1 387 212 000 $ US |
| 2010 | −546 390 000 $ US | −327 116 000 $ US |
| 2009 | −1 057 067 000 $ US | −222 098 000 $ US |
| 2008 | −1 815 789 000 $ US | 999 006 000 $ US |
| 2007 | −3 565 235 000 $ US | 2 196 169 000 $ US |
| 2006 | −4 410 543 000 $ US | 3 091 192 000 $ US |
| 2005 | −4 324 010 000 $ US | 3 187 229 000 $ US |
| 2004 | −3 768 227 000 $ US | 3 197 669 000 $ US |
| 2003 | −2 646 174 000 $ US | 2 177 423 000 $ US |
| 2002 | −1 907 043 000 $ US | 1 730 733 000 $ US |
| 2001 | −1 387 400 000 $ US | 1 130 148 000 $ US |
En 2025, selon le Mexique, son commerce de biens avec le Brésil affichait un déficit de 6,76 milliards de dollars ; selon le Brésil, son commerce de biens avec le Mexique affichait un excédent de 1,51 milliard de dollars. En 2001, les chiffres étaient un déficit de 1,39 milliard de dollars pour le Mexique et un excédent de 1,13 milliard de dollars pour le Brésil.
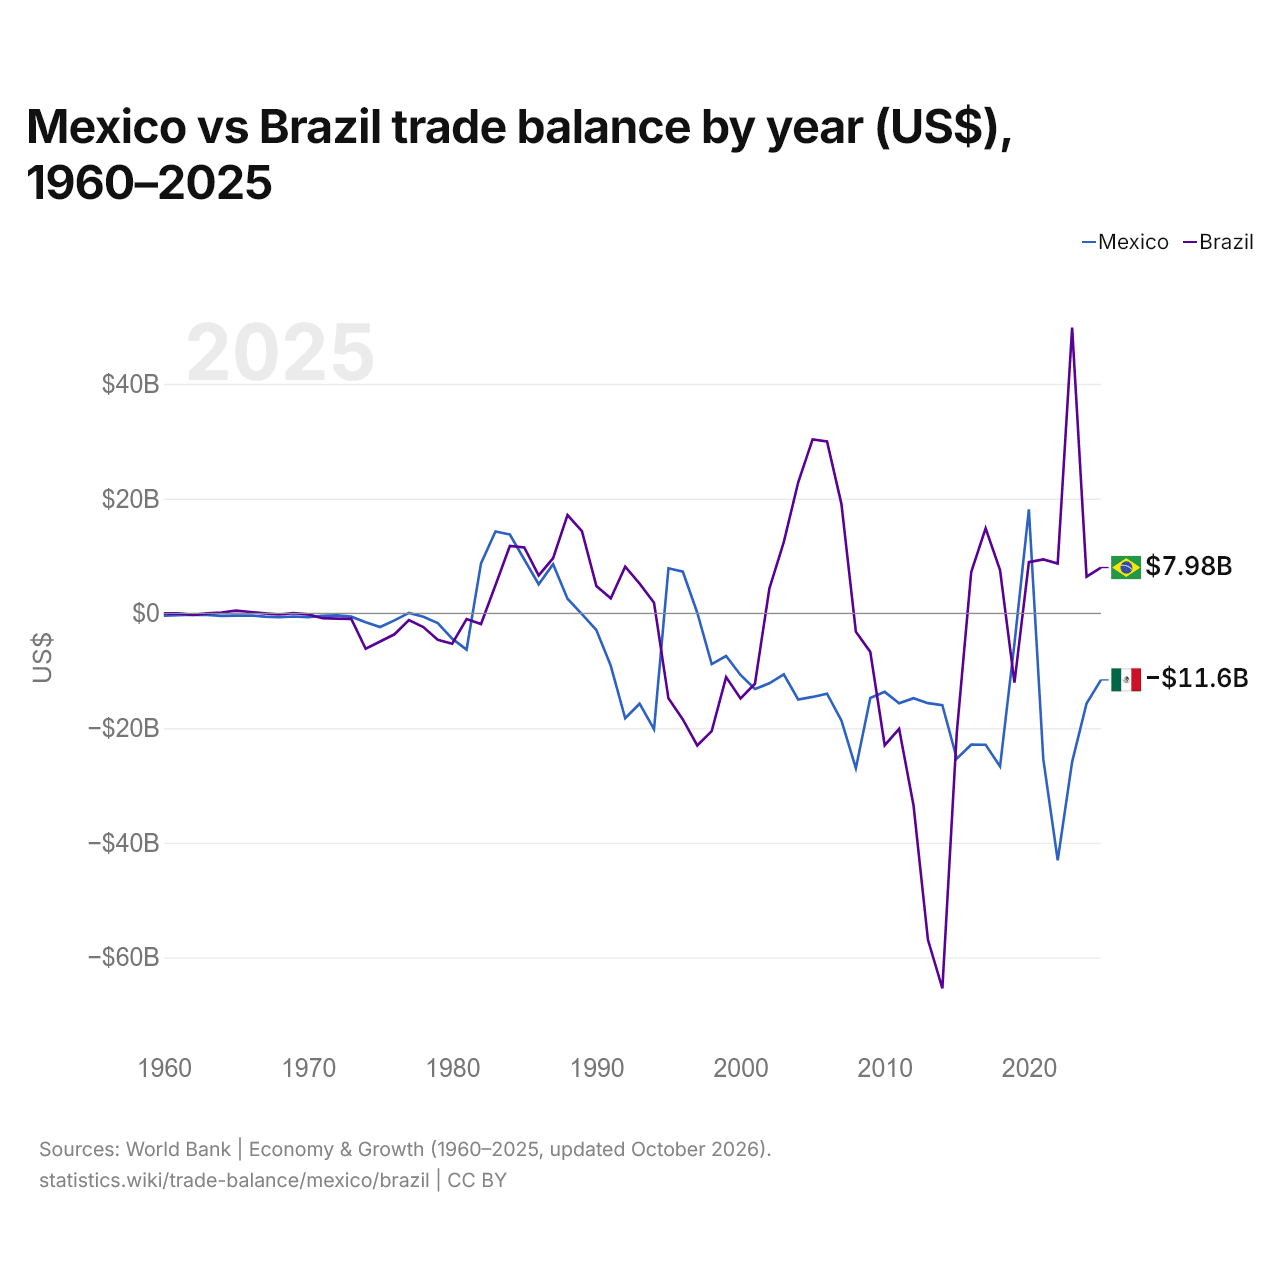
Mexique vs Brésil : balance commerciale par année ($ US), 1960–2025
| Année | $ US | |
|---|---|---|
 Mexique |
 Brésil |
|
| 2025 | −11 605 622 880 $ US | 7 978 888 856 $ US |
| 2024 | −15 717 845 722 $ US | 6 396 477 783 $ US |
| 2023 | −25 897 057 372 $ US | 49 791 689 659 $ US |
| 2022 | −43 038 473 570 $ US | 8 695 119 065 $ US |
| 2021 | −25 421 787 732 $ US | 9 397 892 444 $ US |
| 2020 | 18 118 519 569 $ US | 8 930 824 788 $ US |
| 2019 | −5 251 253 229 $ US | −12 071 834 246 $ US |
| 2018 | −26 693 875 997 $ US | 7 548 801 626 $ US |
| 2017 | −22 908 871 558 $ US | 14 820 192 744 $ US |
| 2016 | −22 900 319 427 $ US | 7 176 956 033 $ US |
| 2015 | −25 326 664 234 $ US | −20 783 887 933 $ US |
| 2014 | −15 997 824 630 $ US | −65 368 099 307 $ US |
| 2013 | −15 664 725 283 $ US | −56 911 843 574 $ US |
| 2012 | −14 798 142 338 $ US | −33 507 264 618 $ US |
| 2011 | −15 687 804 674 $ US | −20 128 178 015 $ US |
| 2010 | −13 690 284 542 $ US | −22 994 190 062 $ US |
| 2009 | −14 766 707 749 $ US | −6 721 885 359 $ US |
| 2008 | −27 007 969 655 $ US | −3 214 805 207 $ US |
| 2007 | −18 700 378 800 $ US | 19 039 021 642 $ US |
| 2006 | −14 004 359 661 $ US | 29 982 705 221 $ US |
| 2005 | −14 575 601 318 $ US | 30 323 248 288 $ US |
| 2004 | −15 028 128 471 $ US | 22 844 658 798 $ US |
| 2003 | −10 635 248 765 $ US | 12 399 391 352 $ US |
| 2002 | −12 211 107 588 $ US | 4 296 672 537 $ US |
| 2001 | −13 196 271 984 $ US | −12 279 677 754 $ US |
| 2000 | −10 745 509 995 $ US | −14 837 154 502 $ US |
| 1999 | −7 439 469 884 $ US | −11 107 588 704 $ US |
| 1998 | −8 854 630 484 $ US | −20 535 451 010 $ US |
| 1997 | 100 862 036 $ US | −23 042 055 321 $ US |
| 1996 | 7 253 513 413 $ US | −18 498 238 583 $ US |
| 1995 | 7 854 137 403 $ US | −14 822 816 229 $ US |
| 1994 | −20 203 083 923 $ US | 1 846 111 837 $ US |
| 1993 | −15 751 893 766 $ US | 5 182 689 343 $ US |
| 1992 | −18 303 180 266 $ US | 8 149 820 789 $ US |
| 1991 | −9 142 911 050 $ US | 2 614 204 545 $ US |
| 1990 | −2 901 886 476 $ US | 4 769 166 667 $ US |
| 1989 | −144 468 779 $ US | 14 323 932 823 $ US |
| 1988 | 2 545 780 331 $ US | 17 141 241 475 $ US |
| 1987 | 8 573 422 397 $ US | 9 608 553 171 $ US |
| 1986 | 5 056 800 480 $ US | 6 601 570 908 $ US |
| 1985 | 9 374 182 472 $ US | 11 487 450 960 $ US |
| 1984 | 13 747 056 510 $ US | 11 753 827 696 $ US |
| 1983 | 14 264 243 010 $ US | 4 906 714 630 $ US |
| 1982 | 8 712 722 953 $ US | −1 872 613 598 $ US |
| 1981 | −6 315 684 275 $ US | −999 146 350 $ US |
| 1980 | −4 418 630 996 $ US | −5 295 341 312 $ US |
| 1979 | −1 697 513 703 $ US | −4 615 615 400 $ US |
| 1978 | −583 862 608 $ US | −2 387 152 106 $ US |
| 1977 | 79 369 158 $ US | −1 172 207 021 $ US |
| 1976 | −1 224 186 438 $ US | −3 659 545 985 $ US |
| 1975 | −2 398 560 000 $ US | −4 907 560 236 $ US |
| 1974 | −1 557 920 000 $ US | −6 172 123 572 $ US |
| 1973 | −581 984 000 $ US | −975 055 647 $ US |
| 1972 | −347 920 000 $ US | −927 784 676 $ US |
| 1971 | −422 920 000 $ US | −848 612 874 $ US |
| 1970 | −675 968 000 $ US | −177 912 553 $ US |
| 1969 | −560 120 000 $ US | 24 981 601 $ US |
| 1968 | −679 896 000 $ US | −206 594 912 $ US |
| 1967 | −568 840 000 $ US | 0 $ US |
| 1966 | −375 216 000 $ US | 225 450 250 $ US |
| 1965 | −412 432 000 $ US | 474 987 148 $ US |
| 1964 | −445 848 000 $ US | 150 139 739 $ US |
| 1963 | −277 032 000 $ US | −17 161 539 $ US |
| 1962 | −234 024 000 $ US | −263 069 676 $ US |
| 1961 | −311 912 000 $ US | −9 149 903 $ US |
| 1960 | −411 824 000 $ US | −8 829 343 $ US |
En 2025, la balance commerciale du Mexique affichait un déficit de 11,6 milliards de dollars et celle du Brésil un excédent de 7,98 milliards de dollars. En 1960, la balance commerciale du Mexique affichait un déficit de 412 millions de dollars et celle du Brésil un déficit de 8,83 millions de dollars.
Sur les années de 1960 à 2025 que les deux pays ont communiquées, la balance commerciale du Mexique a été excédentaire pendant 12 des 65 années, et celle du Brésil pendant 31. Les balances commerciales du Mexique et du Brésil ont été déficitaires en même temps pendant 29 de ces années, la dernière fois en 2019.
Mexique vs Brésil : chiffres de la balance commerciale
|
Mexique
|
Brésil
|
|
|---|---|---|
| Biens et services, $ US | −11,6 Md $US (2025) | +7,98 Md $US (2025) |
| % du PIB | −0,6 % (2025) | +0,3 % (2025) |
| Années d'excédent depuis 2000 | 1 sur 26 | 15 sur 26 |
| Solde des biens entre les deux, chiffres propres | −6,76 Md $US (2025) | +1,51 Md $US (2025) |
| Premier excédent en biens avec | États-Unis (+295 Md $US, 2025) | Chine (+29,1 Md $US, 2025) |
| Premier déficit en biens avec | Chine (−123 Md $US, 2025) | États-Unis (−7,94 Md $US, 2025) |
Comparer la balance commerciale de 2 pays au choix
Sources :
- Banque mondiale | Économie et croissance (1960–2025, mis à jour en octobre 2026)
- TradeMap (2001–2025, mis à jour en octobre 2026)
Creative Commons Attribution (CC BY) : vous pouvez copier, partager, adapter et réutiliser ce contenu, y compris à des fins commerciales, à condition de citer statistics.wiki et d’indiquer les modifications apportées. Les sources citées ci-dessus peuvent avoir leurs propres conditions de licence.