
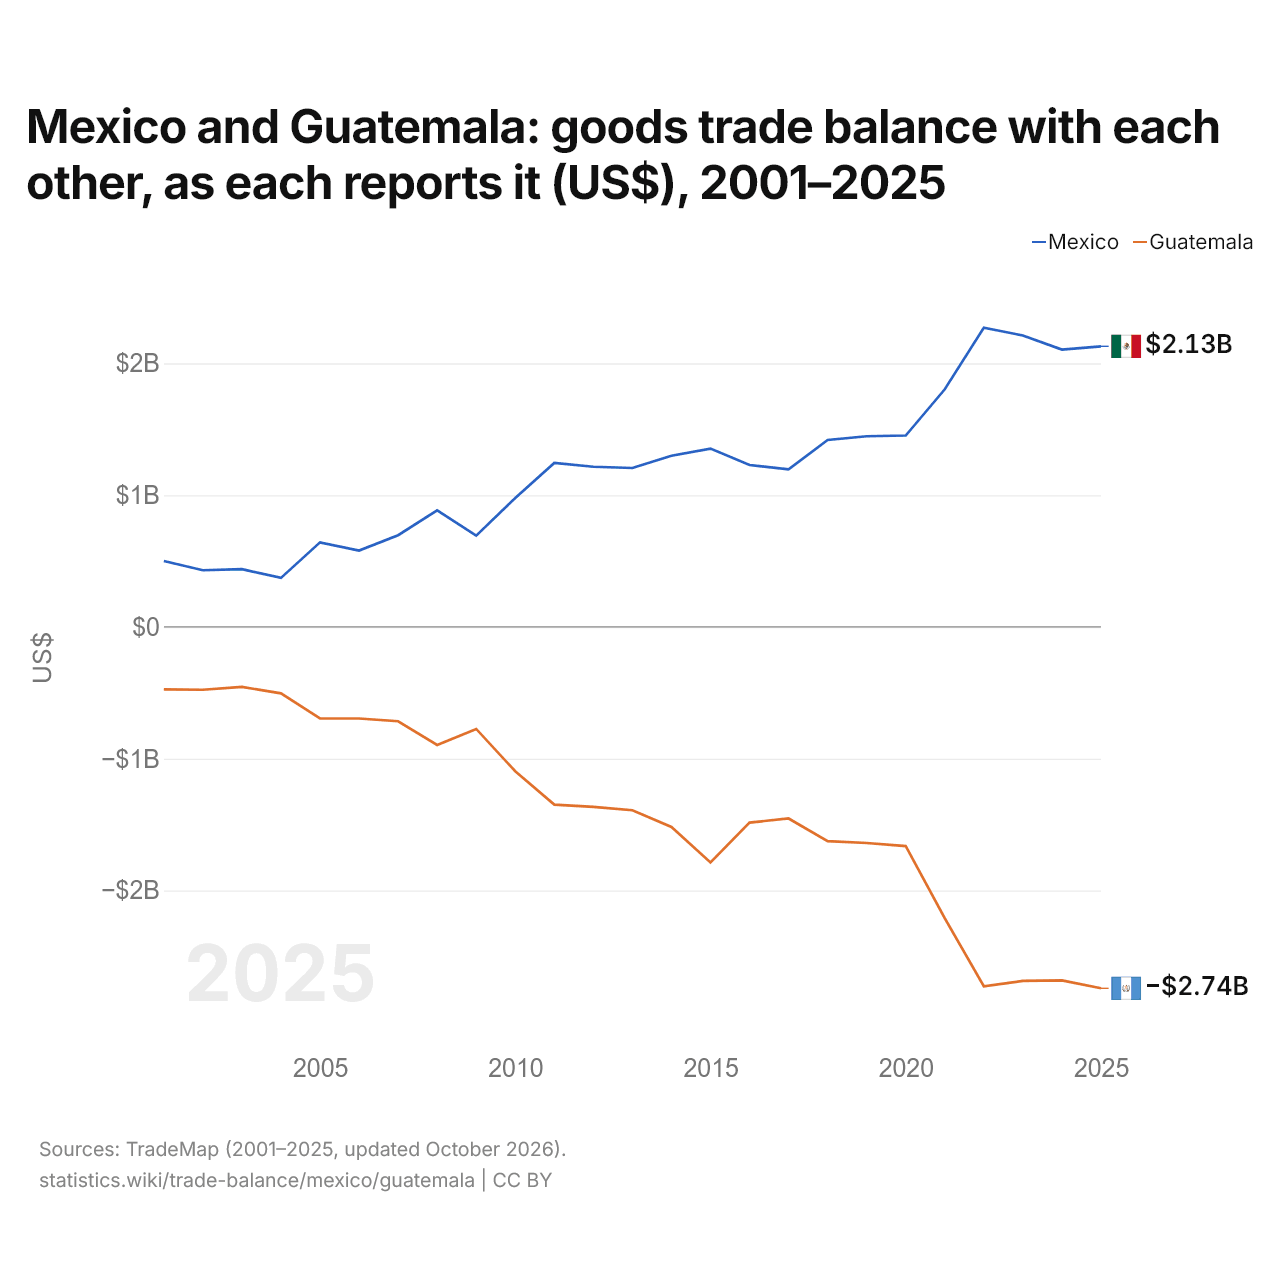
Le Mexique et le Guatemala : solde de leur commerce de biens bilatéral, selon chacun ($ US), 2001–2025
| Année | $ US | |
|---|---|---|
| Mexique | Guatemala | |
| 2025 | 2 129 189 000 $ US | −2 742 102 000 $ US |
| 2024 | 2 104 272 000 $ US | −2 682 255 000 $ US |
| 2023 | 2 211 383 000 $ US | −2 686 304 000 $ US |
| 2022 | 2 270 455 000 $ US | −2 726 843 000 $ US |
| 2021 | 1 803 125 000 $ US | −2 210 672 000 $ US |
| 2020 | 1 452 196 000 $ US | −1 663 127 000 $ US |
| 2019 | 1 446 680 000 $ US | −1 639 497 000 $ US |
| 2018 | 1 418 810 000 $ US | −1 625 406 000 $ US |
| 2017 | 1 195 172 000 $ US | −1 453 474 000 $ US |
| 2016 | 1 228 348 000 $ US | −1 484 407 000 $ US |
| 2015 | 1 353 006 000 $ US | −1 787 785 000 $ US |
| 2014 | 1 299 194 000 $ US | −1 517 606 000 $ US |
| 2013 | 1 205 692 000 $ US | −1 390 648 000 $ US |
| 2012 | 1 215 532 000 $ US | −1 365 816 000 $ US |
| 2011 | 1 243 983 000 $ US | −1 348 227 000 $ US |
| 2010 | 978 172 000 $ US | −1 095 194 000 $ US |
| 2009 | 692 624 000 $ US | −774 145 000 $ US |
| 2008 | 883 883 000 $ US | −895 938 000 $ US |
| 2007 | 695 704 000 $ US | −715 869 000 $ US |
| 2006 | 579 876 000 $ US | −694 886 000 $ US |
| 2005 | 641 889 000 $ US | −694 321 000 $ US |
| 2004 | 371 944 000 $ US | −504 218 000 $ US |
| 2003 | 438 785 000 $ US | −455 033 000 $ US |
| 2002 | 430 221 000 $ US | −476 623 000 $ US |
| 2001 | 499 647 000 $ US | −474 107 000 $ US |
En 2025, selon le Mexique, son commerce de biens avec le Guatemala affichait un excédent de 2,13 milliards de dollars ; selon le Guatemala, son commerce de biens avec le Mexique affichait un déficit de 2,74 milliards de dollars. En 2001, les chiffres étaient un excédent de 500 millions de dollars pour le Mexique et un déficit de 474 millions de dollars pour le Guatemala.
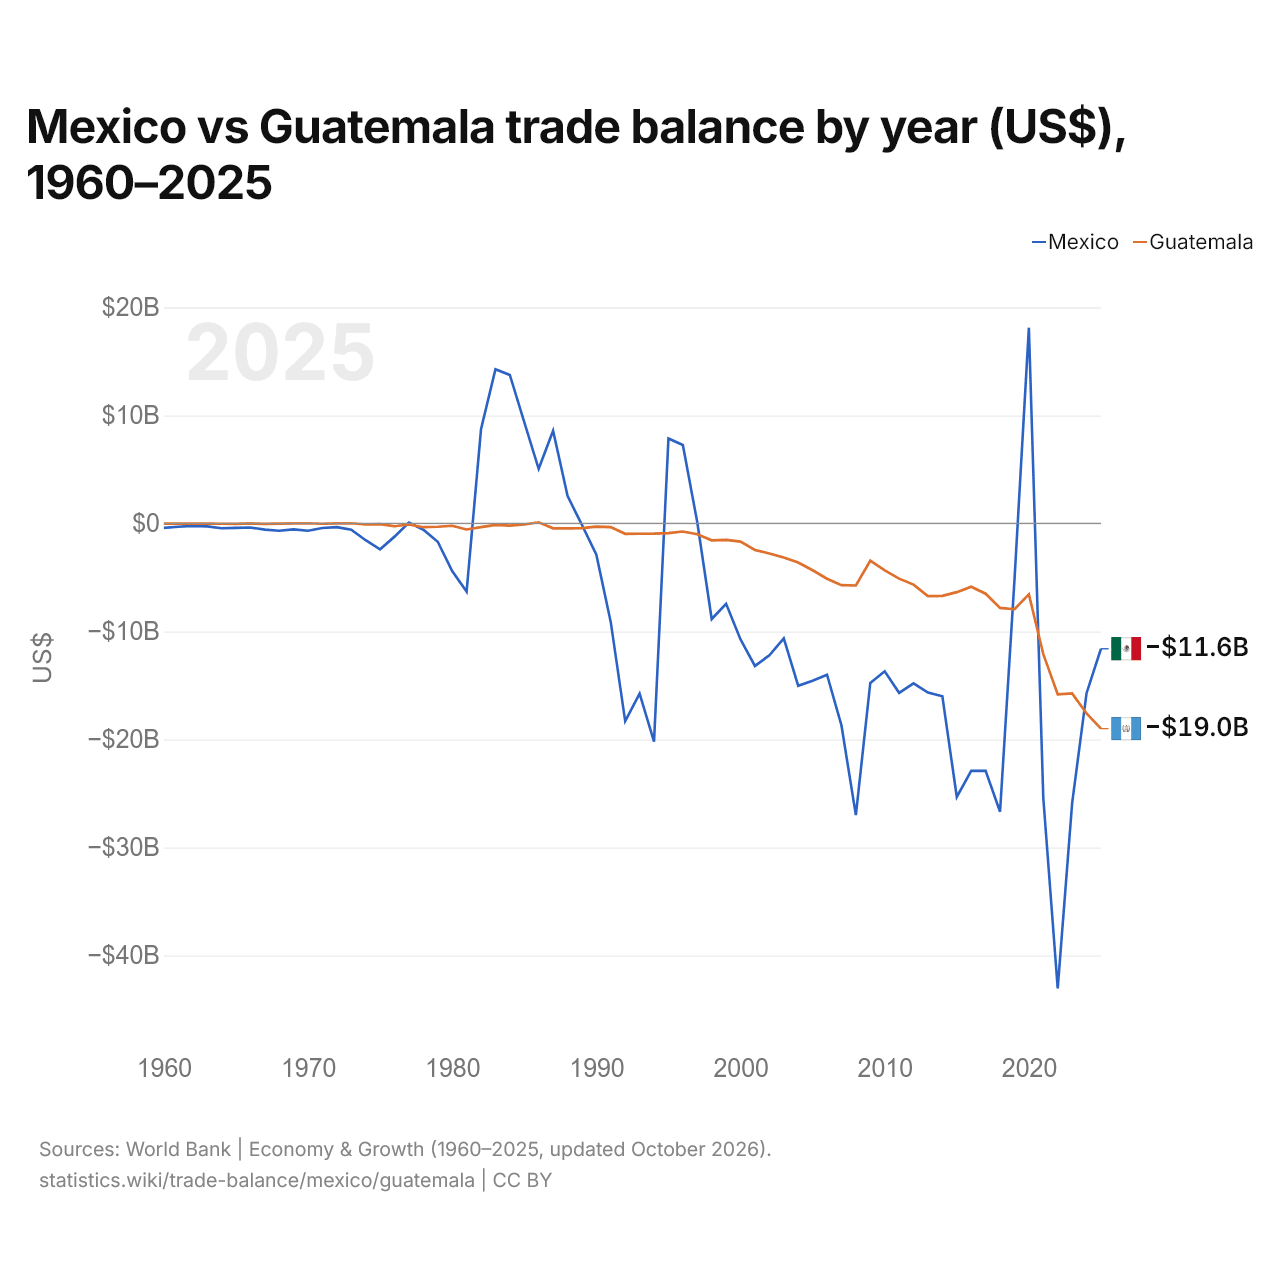
Mexique vs Guatemala : balance commerciale par année ($ US), 1960–2025
| Année | $ US | |
|---|---|---|
 Mexique |
 Guatemala |
|
| 2025 | −11 605 622 880 $ US | −19 000 550 382 $ US |
| 2024 | −15 717 845 722 $ US | −17 591 856 739 $ US |
| 2023 | −25 897 057 372 $ US | −15 743 603 592 $ US |
| 2022 | −43 038 473 570 $ US | −15 819 132 051 $ US |
| 2021 | −25 421 787 732 $ US | −12 105 359 985 $ US |
| 2020 | 18 118 519 569 $ US | −6 570 043 061 $ US |
| 2019 | −5 251 253 229 $ US | −7 943 184 987 $ US |
| 2018 | −26 693 875 997 $ US | −7 826 360 108 $ US |
| 2017 | −22 908 871 558 $ US | −6 505 679 348 $ US |
| 2016 | −22 900 319 427 $ US | −5 856 664 075 $ US |
| 2015 | −25 326 664 234 $ US | −6 363 896 711 $ US |
| 2014 | −15 997 824 630 $ US | −6 707 698 798 $ US |
| 2013 | −15 664 725 283 $ US | −6 724 671 222 $ US |
| 2012 | −14 798 142 338 $ US | −5 666 222 525 $ US |
| 2011 | −15 687 804 674 $ US | −5 114 940 803 $ US |
| 2010 | −13 690 284 542 $ US | −4 341 925 329 $ US |
| 2009 | −14 766 707 749 $ US | −3 454 600 723 $ US |
| 2008 | −27 007 969 655 $ US | −5 748 620 323 $ US |
| 2007 | −18 700 378 800 $ US | −5 720 072 253 $ US |
| 2006 | −14 004 359 661 $ US | −5 125 605 018 $ US |
| 2005 | −14 575 601 318 $ US | −4 337 274 363 $ US |
| 2004 | −15 028 128 471 $ US | −3 625 257 837 $ US |
| 2003 | −10 635 248 765 $ US | −3 158 808 057 $ US |
| 2002 | −12 211 107 588 $ US | −2 791 095 734 $ US |
| 2001 | −13 196 271 984 $ US | −2 455 612 818 $ US |
| 2000 | −10 745 509 995 $ US | −1 688 845 868 $ US |
| 1999 | −7 439 469 884 $ US | −1 529 708 069 $ US |
| 1998 | −8 854 630 484 $ US | −1 567 257 913 $ US |
| 1997 | 100 862 036 $ US | −1 003 310 355 $ US |
| 1996 | 7 253 513 413 $ US | −748 115 757 $ US |
| 1995 | 7 854 137 403 $ US | −904 435 170 $ US |
| 1994 | −20 203 083 923 $ US | −951 801 198 $ US |
| 1993 | −15 751 893 766 $ US | −954 508 166 $ US |
| 1992 | −18 303 180 266 $ US | −963 712 352 $ US |
| 1991 | −9 142 911 050 $ US | −340 035 952 $ US |
| 1990 | −2 901 886 476 $ US | −291 812 443 $ US |
| 1989 | −144 468 779 $ US | −434 552 557 $ US |
| 1988 | 2 545 780 331 $ US | −457 366 450 $ US |
| 1987 | 8 573 422 397 $ US | −456 599 960 $ US |
| 1986 | 5 056 800 480 $ US | 105 570 776 $ US |
| 1985 | 9 374 182 472 $ US | −100 695 565 $ US |
| 1984 | 13 747 056 510 $ US | −203 500 000 $ US |
| 1983 | 14 264 243 010 $ US | −140 999 900 $ US |
| 1982 | 8 712 722 953 $ US | −340 000 000 $ US |
| 1981 | −6 315 684 275 $ US | −560 499 900 $ US |
| 1980 | −4 418 630 996 $ US | −215 300 000 $ US |
| 1979 | −1 697 513 703 $ US | −310 800 000 $ US |
| 1978 | −583 862 608 $ US | −351 300 100 $ US |
| 1977 | 79 369 158 $ US | −98 700 100 $ US |
| 1976 | −1 224 186 438 $ US | −262 400 000 $ US |
| 1975 | −2 398 560 000 $ US | −66 000 000 $ US |
| 1974 | −1 557 920 000 $ US | −103 000 000 $ US |
| 1973 | −581 984 000 $ US | 17 400 000 $ US |
| 1972 | −347 920 000 $ US | 7 800 000 $ US |
| 1971 | −422 920 000 $ US | −28 000 000 $ US |
| 1970 | −675 968 000 $ US | 15 100 000 $ US |
| 1969 | −560 120 000 $ US | 6 400 000 $ US |
| 1968 | −679 896 000 $ US | −27 100 000 $ US |
| 1967 | −568 840 000 $ US | −48 000 000 $ US |
| 1966 | −375 216 000 $ US | −2 700 000 $ US |
| 1965 | −412 432 000 $ US | −37 600 000 $ US |
| 1964 | −445 848 000 $ US | −35 100 000 $ US |
| 1963 | −277 032 000 $ US | −20 800 000 $ US |
| 1962 | −234 024 000 $ US | −18 700 000 $ US |
| 1961 | −311 912 000 $ US | −16 600 000 $ US |
| 1960 | −411 824 000 $ US | −19 800 000 $ US |
En 2025, la balance commerciale du Mexique affichait un déficit de 11,6 milliards de dollars et celle du Guatemala un déficit de 19 milliards de dollars ; le déficit du Guatemala était 1,6 fois plus grand. En 1960, la balance commerciale du Mexique affichait un déficit de 412 millions de dollars et celle du Guatemala un déficit de 19,8 millions de dollars.
De 1960 à 2025, la balance commerciale du Mexique a été excédentaire pendant 12 des 66 années, et celle du Guatemala pendant 5. Les balances commerciales du Mexique et du Guatemala ont été déficitaires en même temps pendant 50 de ces années, la dernière fois en 2025.
Mexique vs Guatemala : chiffres de la balance commerciale
|
Mexique
|
Guatemala
|
|
|---|---|---|
| Biens et services, $ US | −11,6 Md $US (2025) | −19,0 Md $US (2025) |
| % du PIB | −0,6 % (2025) | −15,4 % (2025) |
| Années d'excédent depuis 2000 | 1 sur 26 | 0 sur 26 |
| Solde des biens entre les deux, chiffres propres | +2,13 Md $US (2025) | −2,74 Md $US (2025) |
| Premier excédent en biens avec | États-Unis (+295 Md $US, 2025) | Nicaragua (+911 M $US, 2025) |
| Premier déficit en biens avec | Chine (−123 Md $US, 2025) | États-Unis (−6,09 Md $US, 2025) |
Comparer la balance commerciale de 2 pays au choix
Sources :
- Banque mondiale | Économie et croissance (1960–2025, mis à jour en octobre 2026)
- TradeMap (2001–2025, mis à jour en octobre 2026)
Creative Commons Attribution (CC BY) : vous pouvez copier, partager, adapter et réutiliser ce contenu, y compris à des fins commerciales, à condition de citer statistics.wiki et d’indiquer les modifications apportées. Les sources citées ci-dessus peuvent avoir leurs propres conditions de licence.